


Customizing a Summary View
When designing a Summary View, Zoho Analytics offers a wide range of options to customize the view to suit your needs. In this section we will discuss about various options provided by Zoho Analytics to customize a Summary View that you create.
Customizing a Summary View - General
Zoho Analytics allows you to customize the appearance of the Summary View (like adding description, hiding row numbers etc.).
- Open the Summary View you would like to customize.
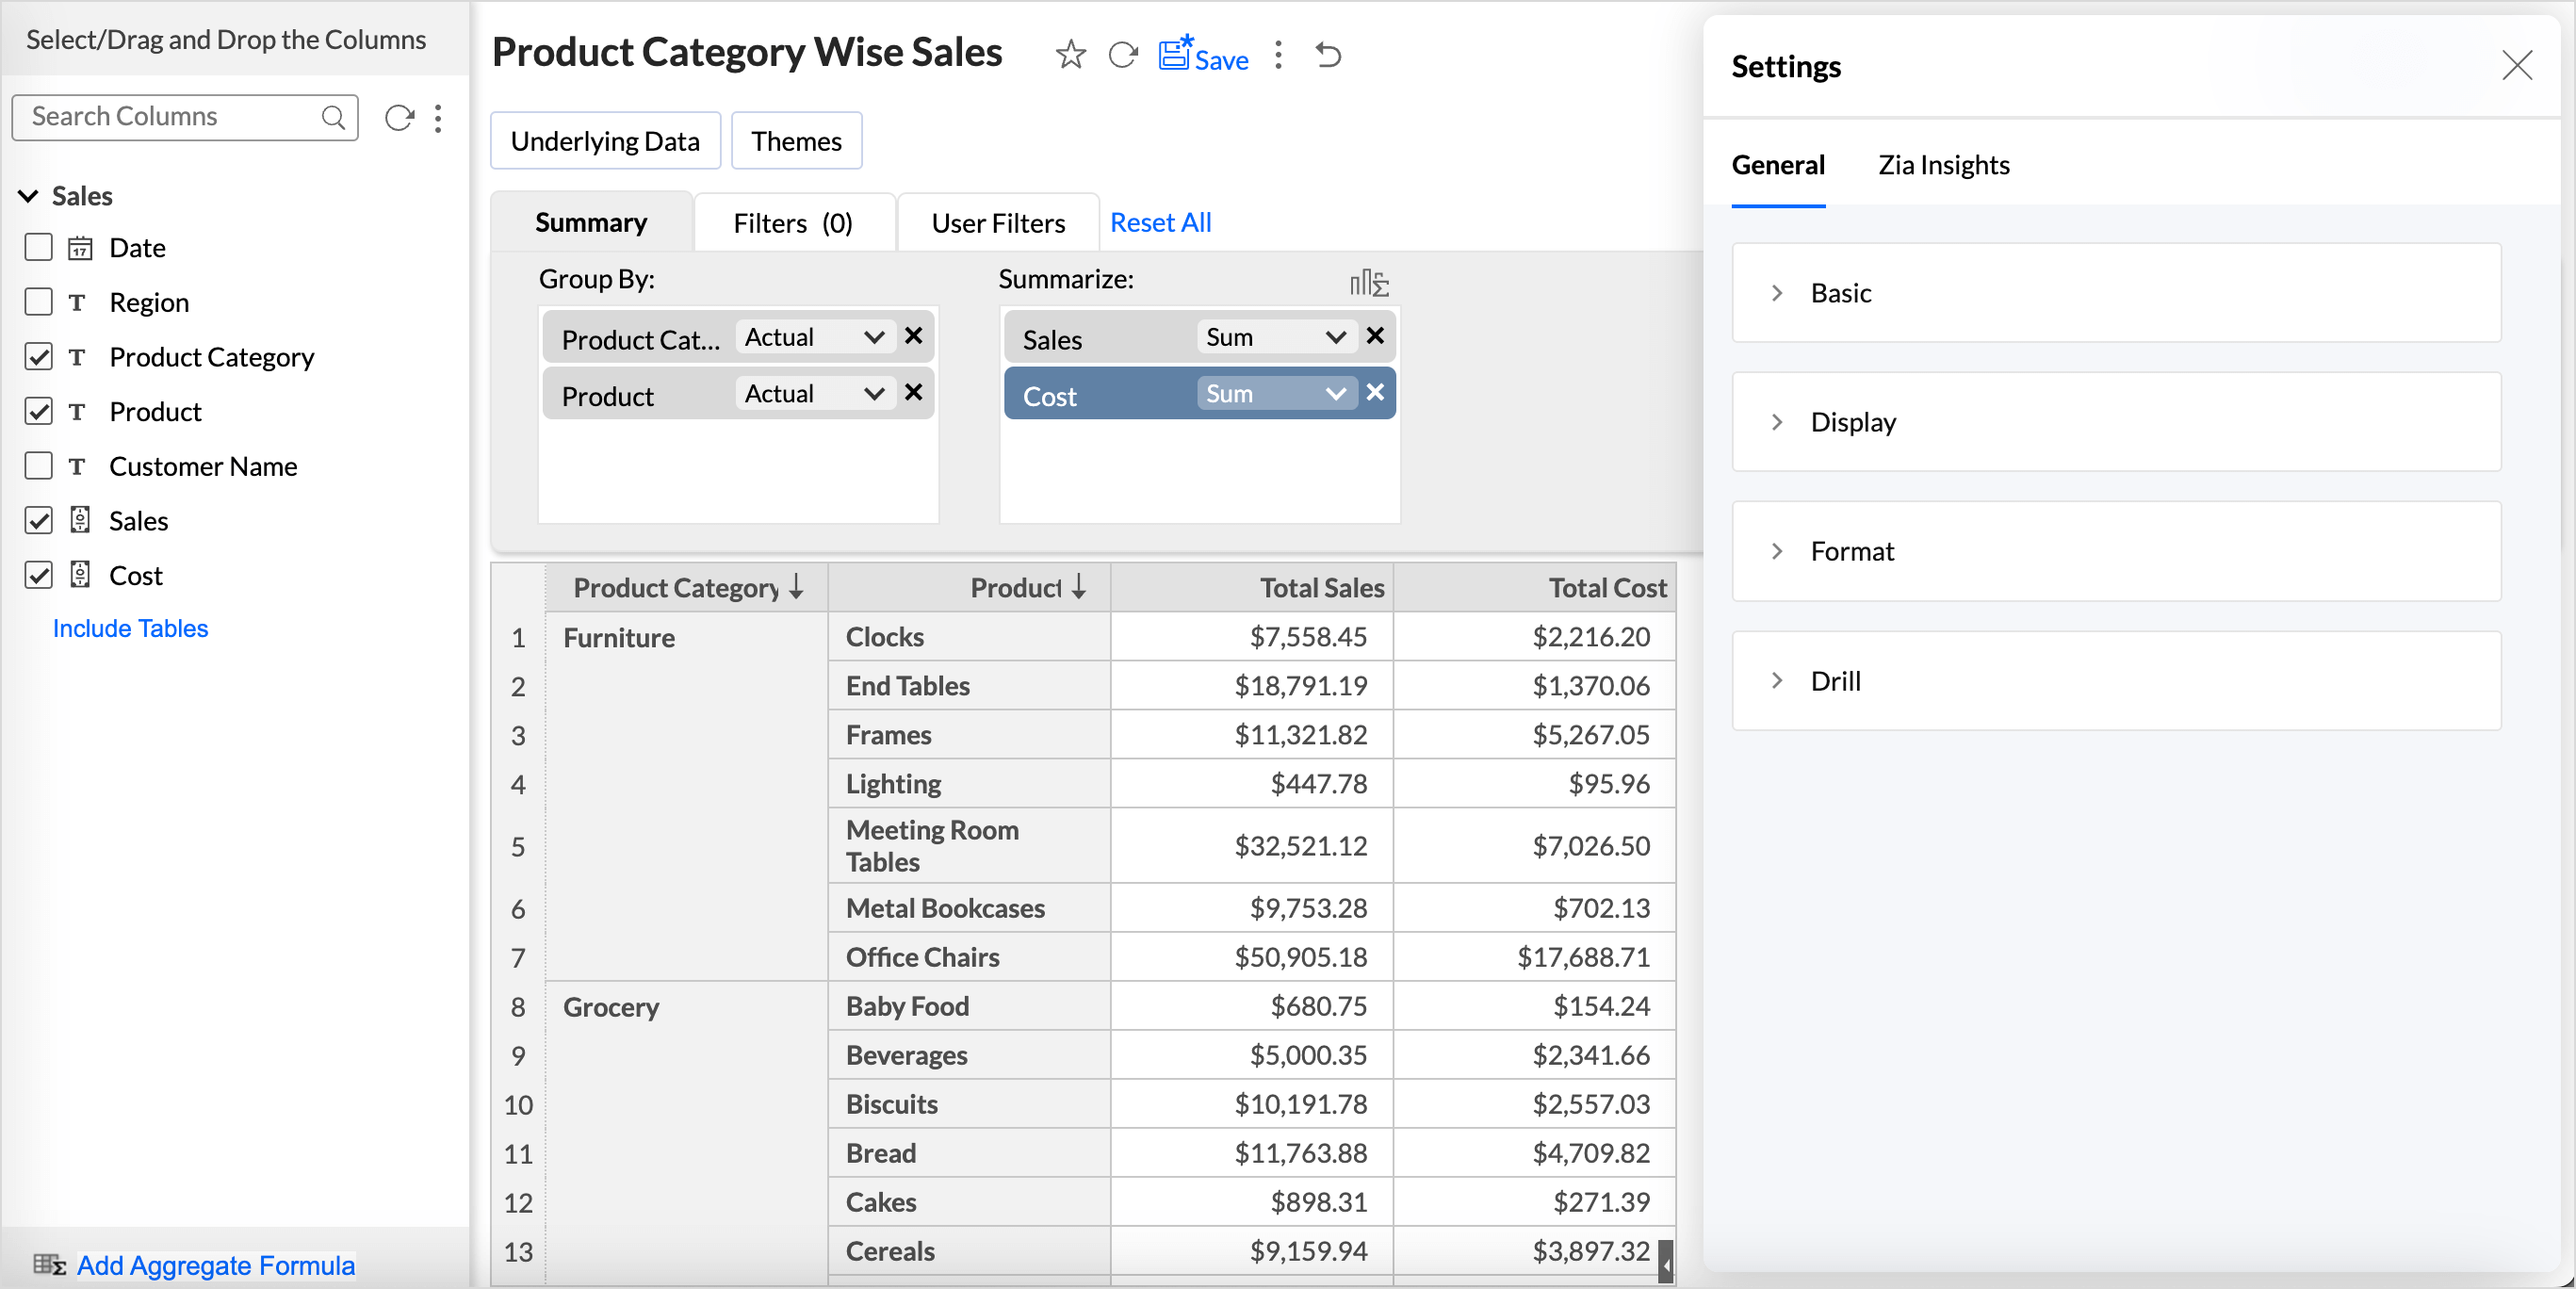
- Select Settings option in the toolbar. This will open the Settings page. You will notice that this page contains four tabs - General, Format, Display and Drill.

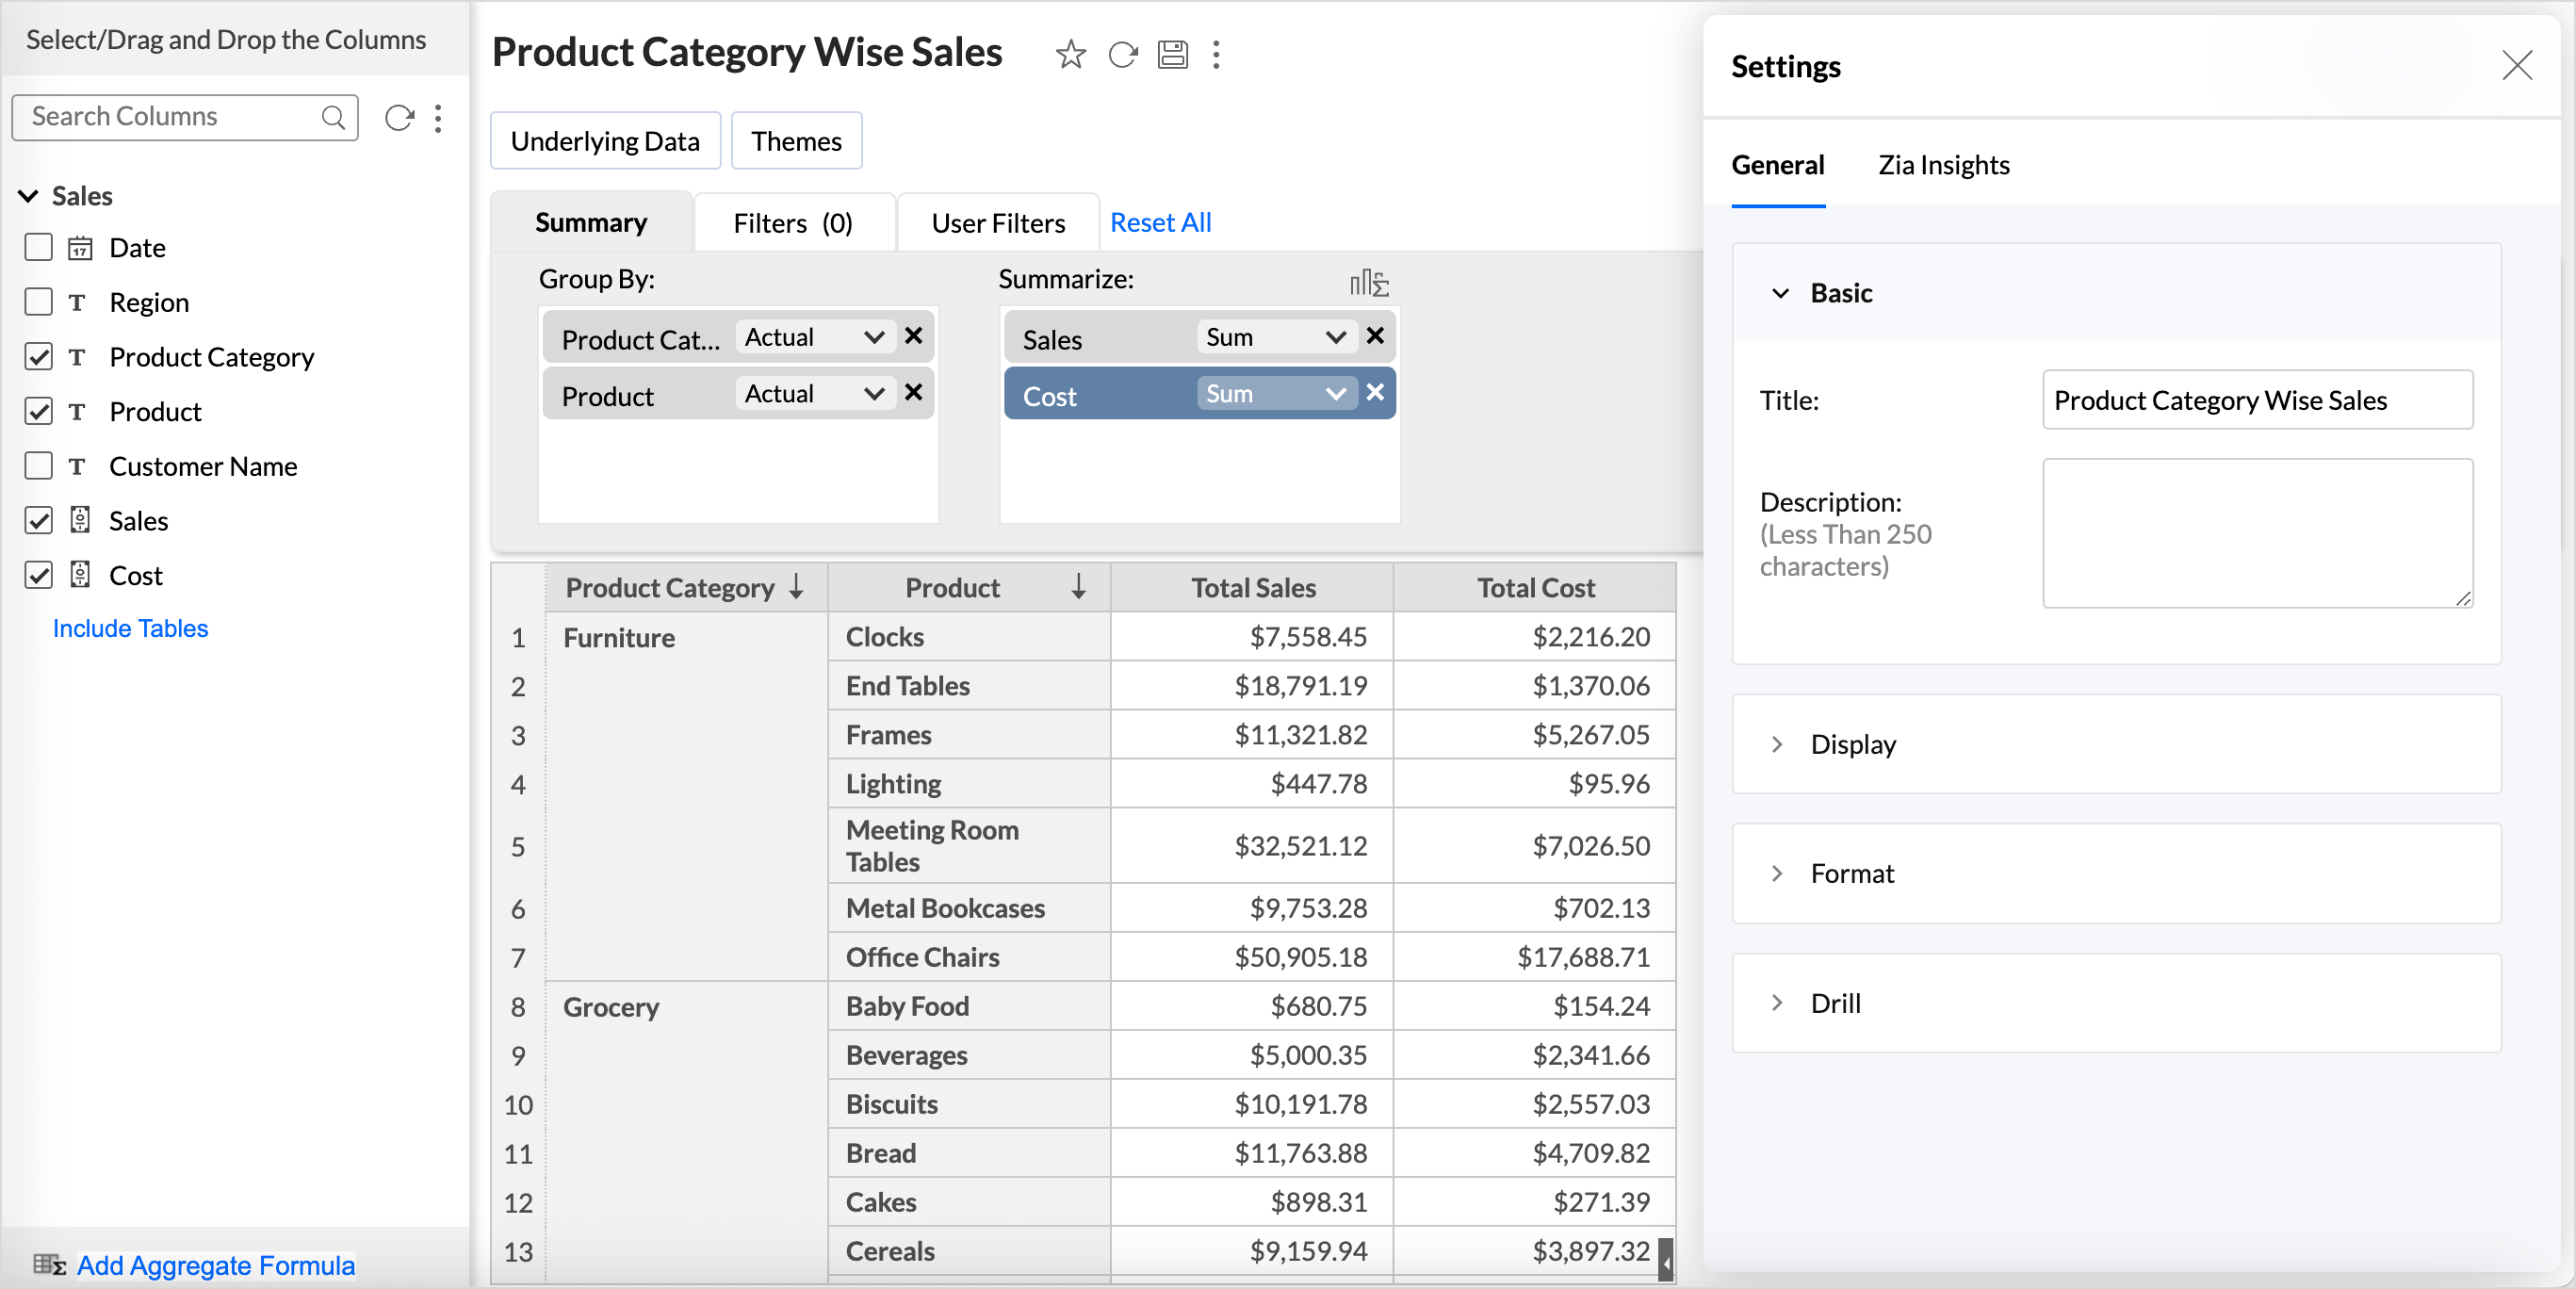
Basic
Zoho Analytics provides options to modify the title and description in the General tab of your Summary View.
- Title: You can edit the title of your Summary View from here. This field is mandatory.
- Description: You can change the description of your Summary View from here. This field is optional.

Display
Under the Display section, you can customize the following options:
- Show row numbers: Displays the index number for the rows. By default, this will not be selected. This option is enabled by default.
- Show Vertical Line between Each Column: Separates each column in the pivot table with a vertical line. This option is enabled by default. Removing vertical lines can be helpful while preparing financial statements.
- Wrap text in Column Headings: This wraps the text in a column header to next line in case the column headers are lengthy.
- Repeat group label value in each row: Select this option in case you wish to repeat the group label for each row. (Check the snapshot below)


- Column Alignment: To align column headers from Left, Center, and Right for improved readability
- Column Width: The Column Width enables you to set a specific width to columns in the summary view. You can use the options available to set uniform, compact, or varied widths across all columns in a summary view.
- Compact: This option tightly packs the columns in the pivot table, thereby helping to save horizontal space and improve readability without the need to scroll sideways.
- Fit to Screen: This option adjusts column width to fit the table across the entire screen. In case of adding/removing columns, applying filters, etc in the future, the column width will always adapt to the screen size. The Fit to Screen option can also be applied to all pivot and summary views in the dashboard by enabling the Fit the Pivot/Summary view to card width from the Settings menu in the dashboard.
- Equal: This option allows you to uniformly resize all the columns to an equal width. Once selected, specify the required width (in pixels) in the provided field.
- Display 'Unknown' value as: Null or empty value present in the underlying data of the Summary View will be displayed as -No Value- by default. You can specify an alternate value that could be displayed instead of this in the Display 'Unknown' value as field.

Format
Using the right format is imperative for both analysis and interpretation of the data. Zoho Analytics provides many options to format a column based on the data type. This helps ensure all the data points in the column have the same consistent format.
You can edit the following details from the Format tab:
- Label: You can edit the labels of the columns in your Summary View.
- Format: You can change the format of the data displayed in your Summary View. The options in the Format dialog will vary depending on the data type of the column. These options will be similar to that of the table column formatting options in Tables. Refer to the Formatting a column article to learn more.
Drill
The drill feature enables you to view data at varying levels of granularity, making it easier to compare different data segments.
The Drill Through action lets you navigate from a data point in one report to related reports for deeper insights. For example, from a Region-wise Sales report, you can drill through to a Product-wise Sales report to identify which products are driving sales in a specific region.
Configuring a Drill Through Action
- Click the Settings icon in the top right corner.
- Enable the Drill Through toggle button.
- Select the views to drill through from the report. Drill through lets you open another view from this chart, passing the selected data point(s) as filter. All the views created over the chosen table and its related views are listed for selection. Only the views created over the same chosen table and the related tables are listed.
- Click Apply.

Renaming
Zoho Analytics provides option to rename columns.
To rename a column, follow the given steps:
- Open the Summary View in Edit Mode.
- Right click the column header and then select Rename Column.
You can also rename the column by clicking the Edit icon in the column header

Sorting
To sort a column:
- Right click the column header.
- Select one of the following sorting options
- Sort Ascending - Sorts text data in ascending alphabetical order (A to Z), numbers from smallest to largest (0-9), and dates from oldest to latest.
- Sort Descending - Sorts text data in descending alphabetical order (Z to A), numbers from largest to smallest (9-0), and dates from latest to oldest.
- Remove Sorting - Clears the applied sorting.

Conditional Formatting
Conditional formatting feature allows you to visually highlight data cells in a Summary View with different styles based on matching conditions. You have to specify the required conditions/criteria for formatting. The condition that matches first with the data cell will be applied.
To apply conditional formatting:
- Open the Summary View for which you want to apply Conditional Formatting.
- Right click on any one of the cells in the data series for which you want to apply conditional formatting.
- In the menu, click Conditional Formatting.
- The Conditional Formatting dialog opens with options for specifying the conditions and selecting colors for font and background.

- Click the drop down arrow under Condition header and select the type of the condition that you want to apply.
- Type the matching value that you want to use for the condition in the Value text box.
- Select the required colors for the font and background.
- You can also insert texts and icons using the Additional Formatting Options dialog to highlight your condition. Click the
 icon to add text and icons.
 - You can add any number of conditions using +Add Condition link.
- Conditions specified will be evaluated from top to bottom and the corresponding formatting options that matches first will be applied on the data cell that meets the condition.
- Click OK after you have added all the conditions.

You can also view and modify all the conditional formats applied over the Summary View in Conditional Format tab in Settings section.