


Data Pipeline
Organizations have large volumes of data from various sources, and the raw data needs to be prepared for analysis. The visual data pipeline builder in Zoho Analytics enables you to create data flows with multiple data stages and apply advanced data transformation functions to make the data ready for analysis. It significantly reduces time spent on data preparation by enabling you to automate the data preparation process.
Creating a Data Pipeline
Creating a data pipeline comprises three major stages: Data Ingestion, Data Transformation, and Pipeline Execution.
Data Ingestion
Zoho Analytics allows you to import from various data sources, such as files and feeds, cloud storage, databases and data lakes, and business applications, to a workspace for analysis. Choose the tables and apply the necessary data cleansing and transformation functions to create a pipeline.
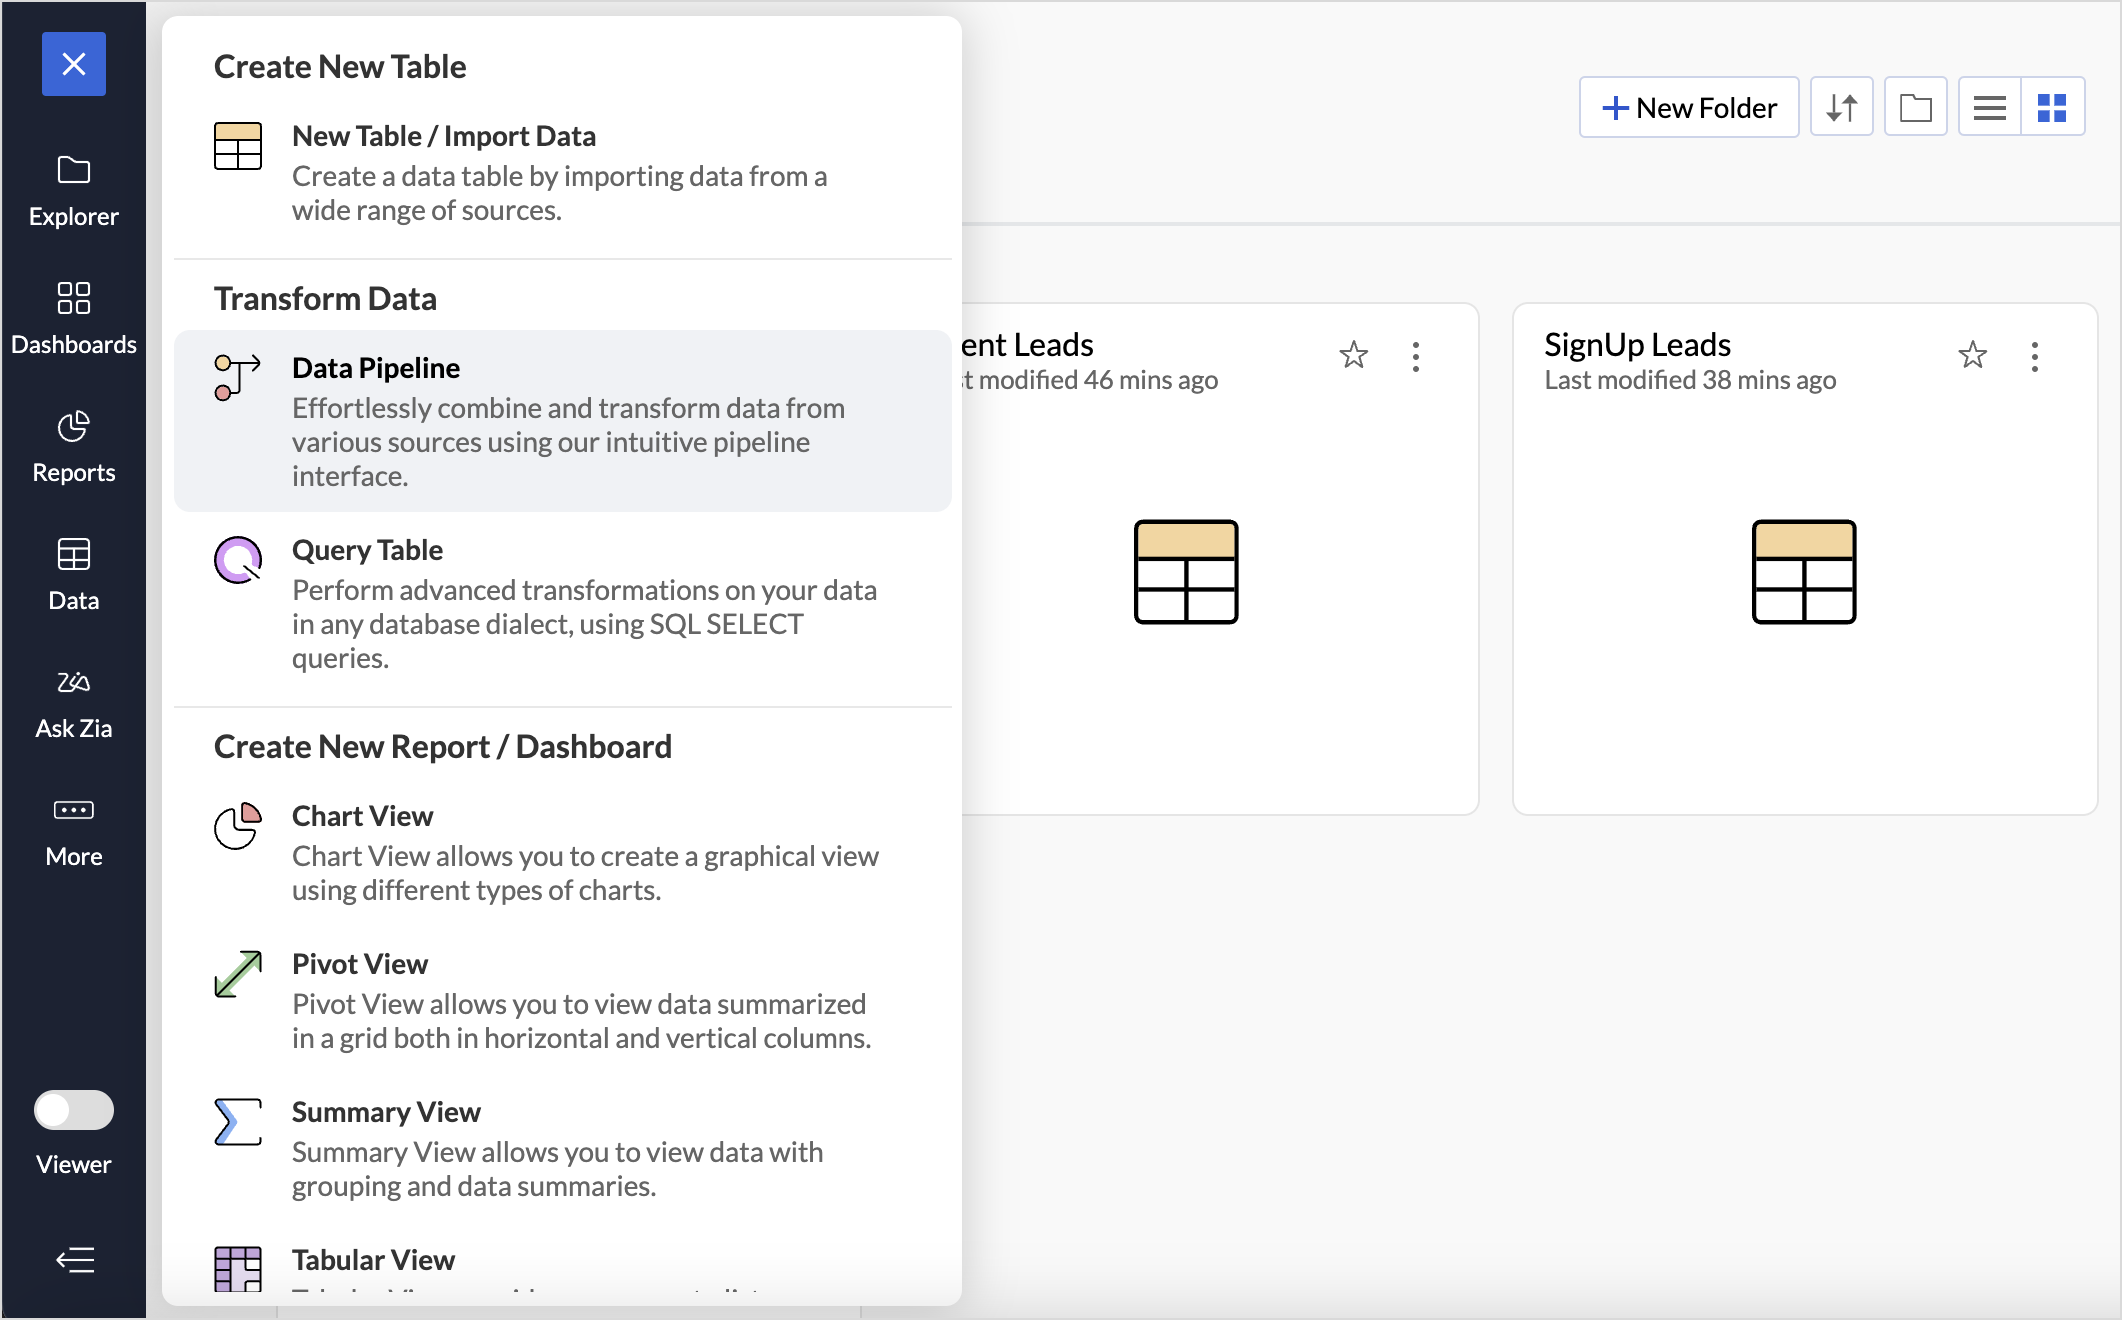
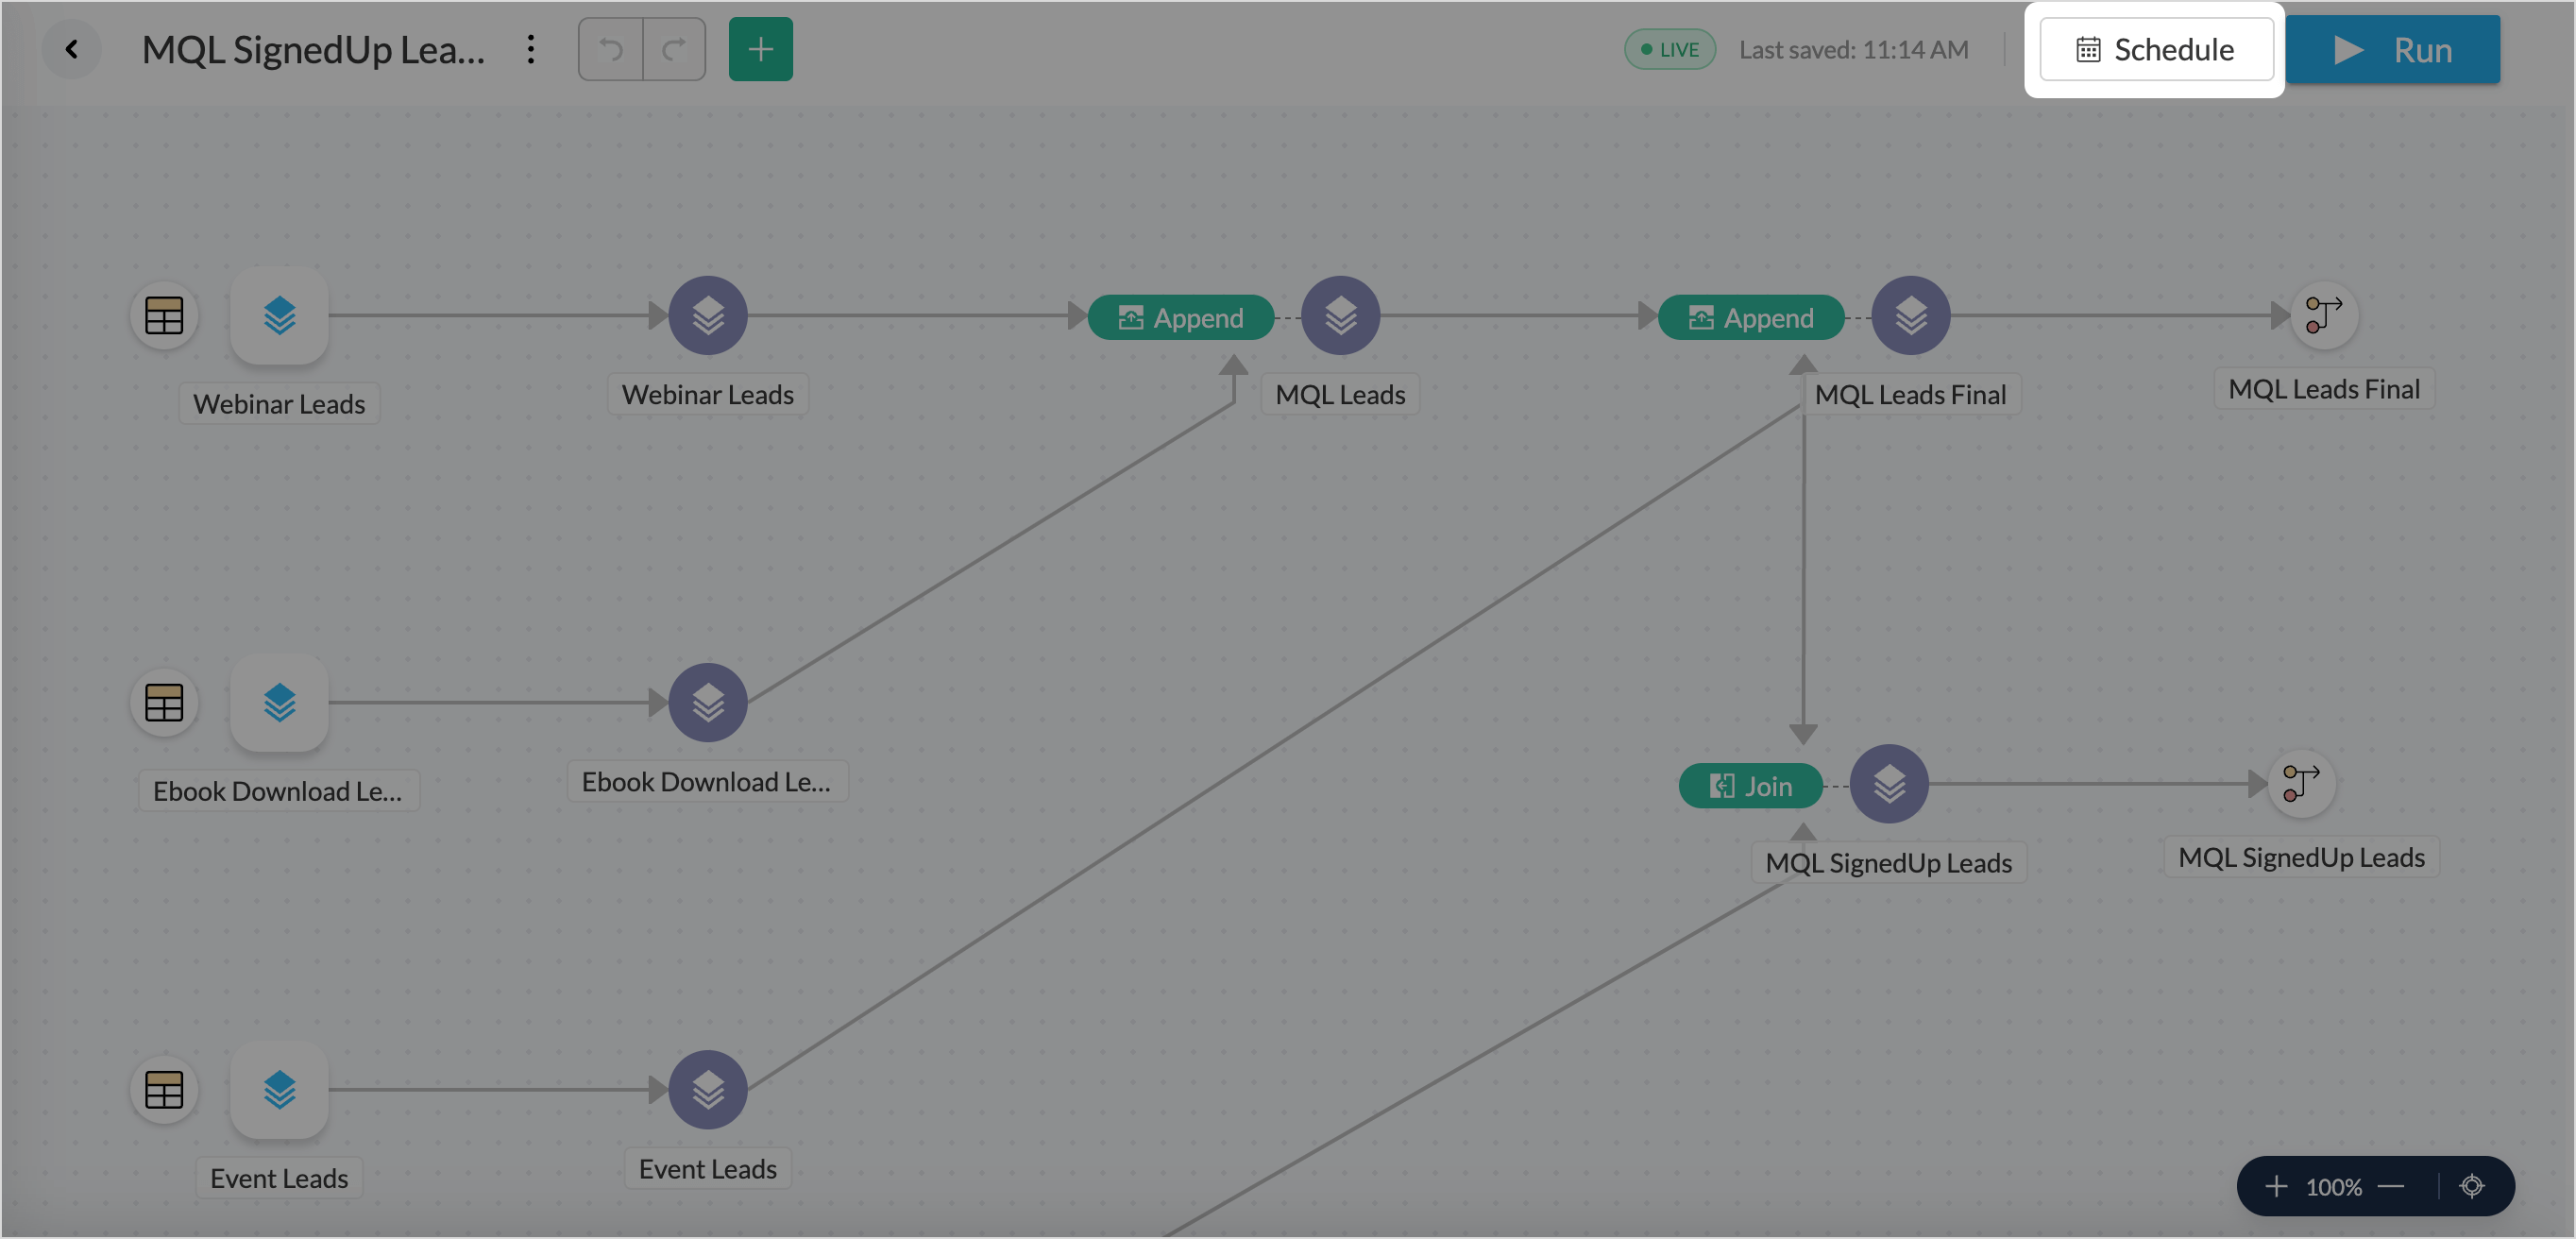
- Click the Create icon on the side navigation panel and choose Data Pipeline from the drop-down menu.
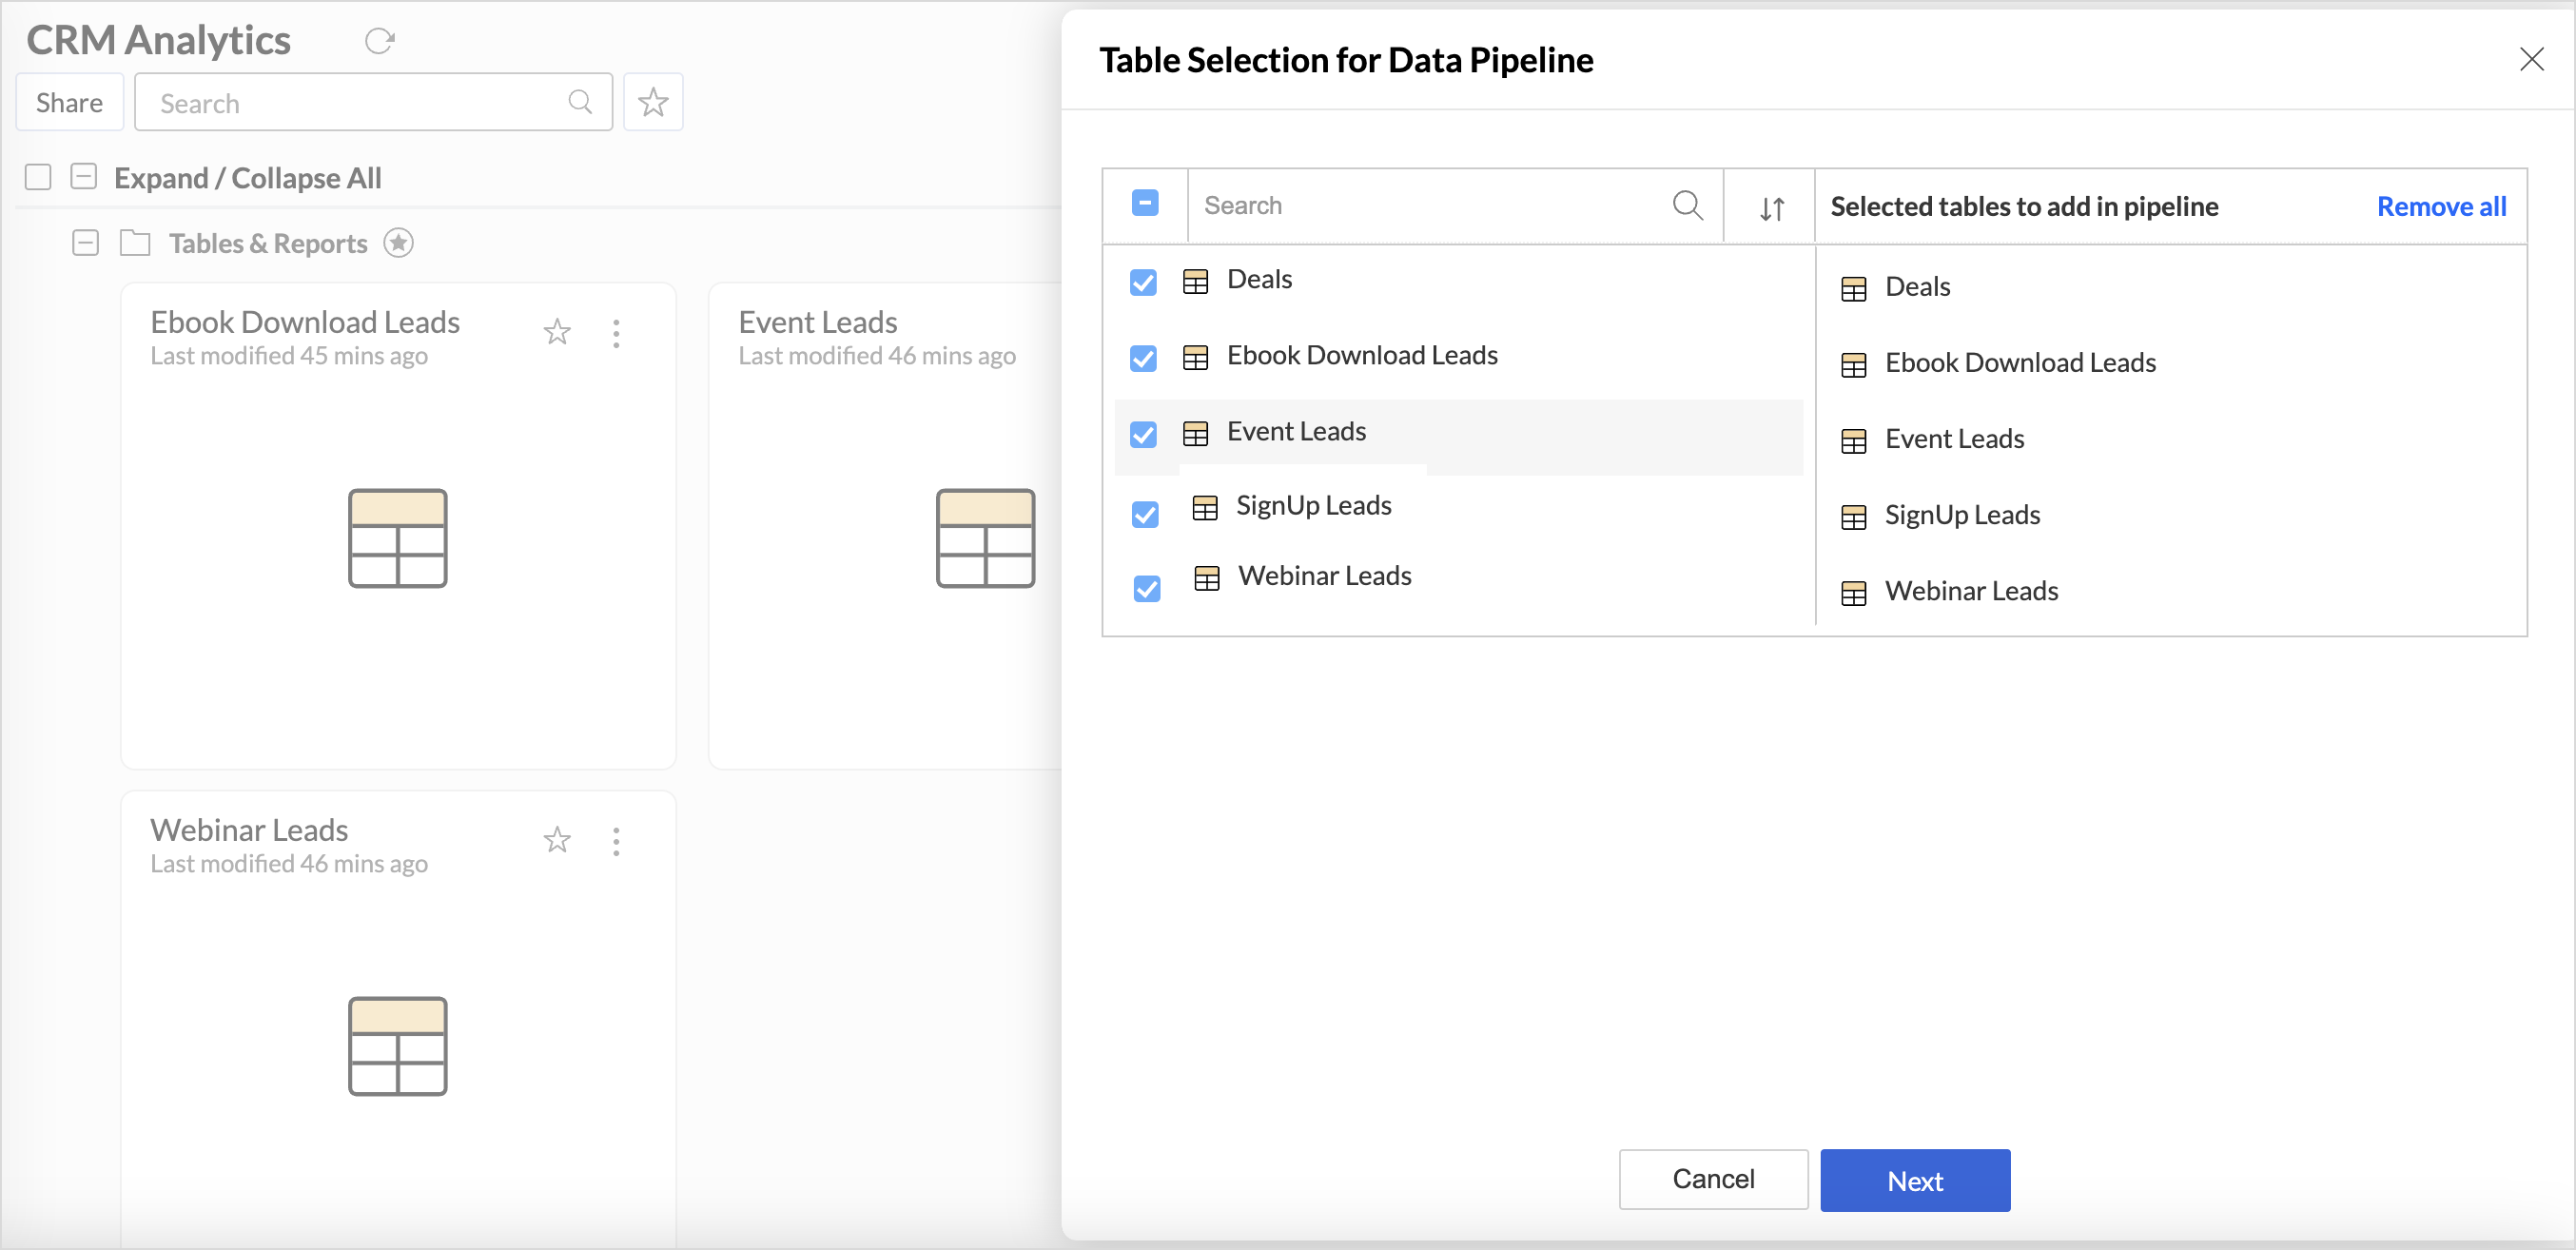
- From the Table selection for the data pipeline pane, select the tables for creating a pipeline and click Next.
- The Pipeline builder powered by Zoho DataPrep window will open.
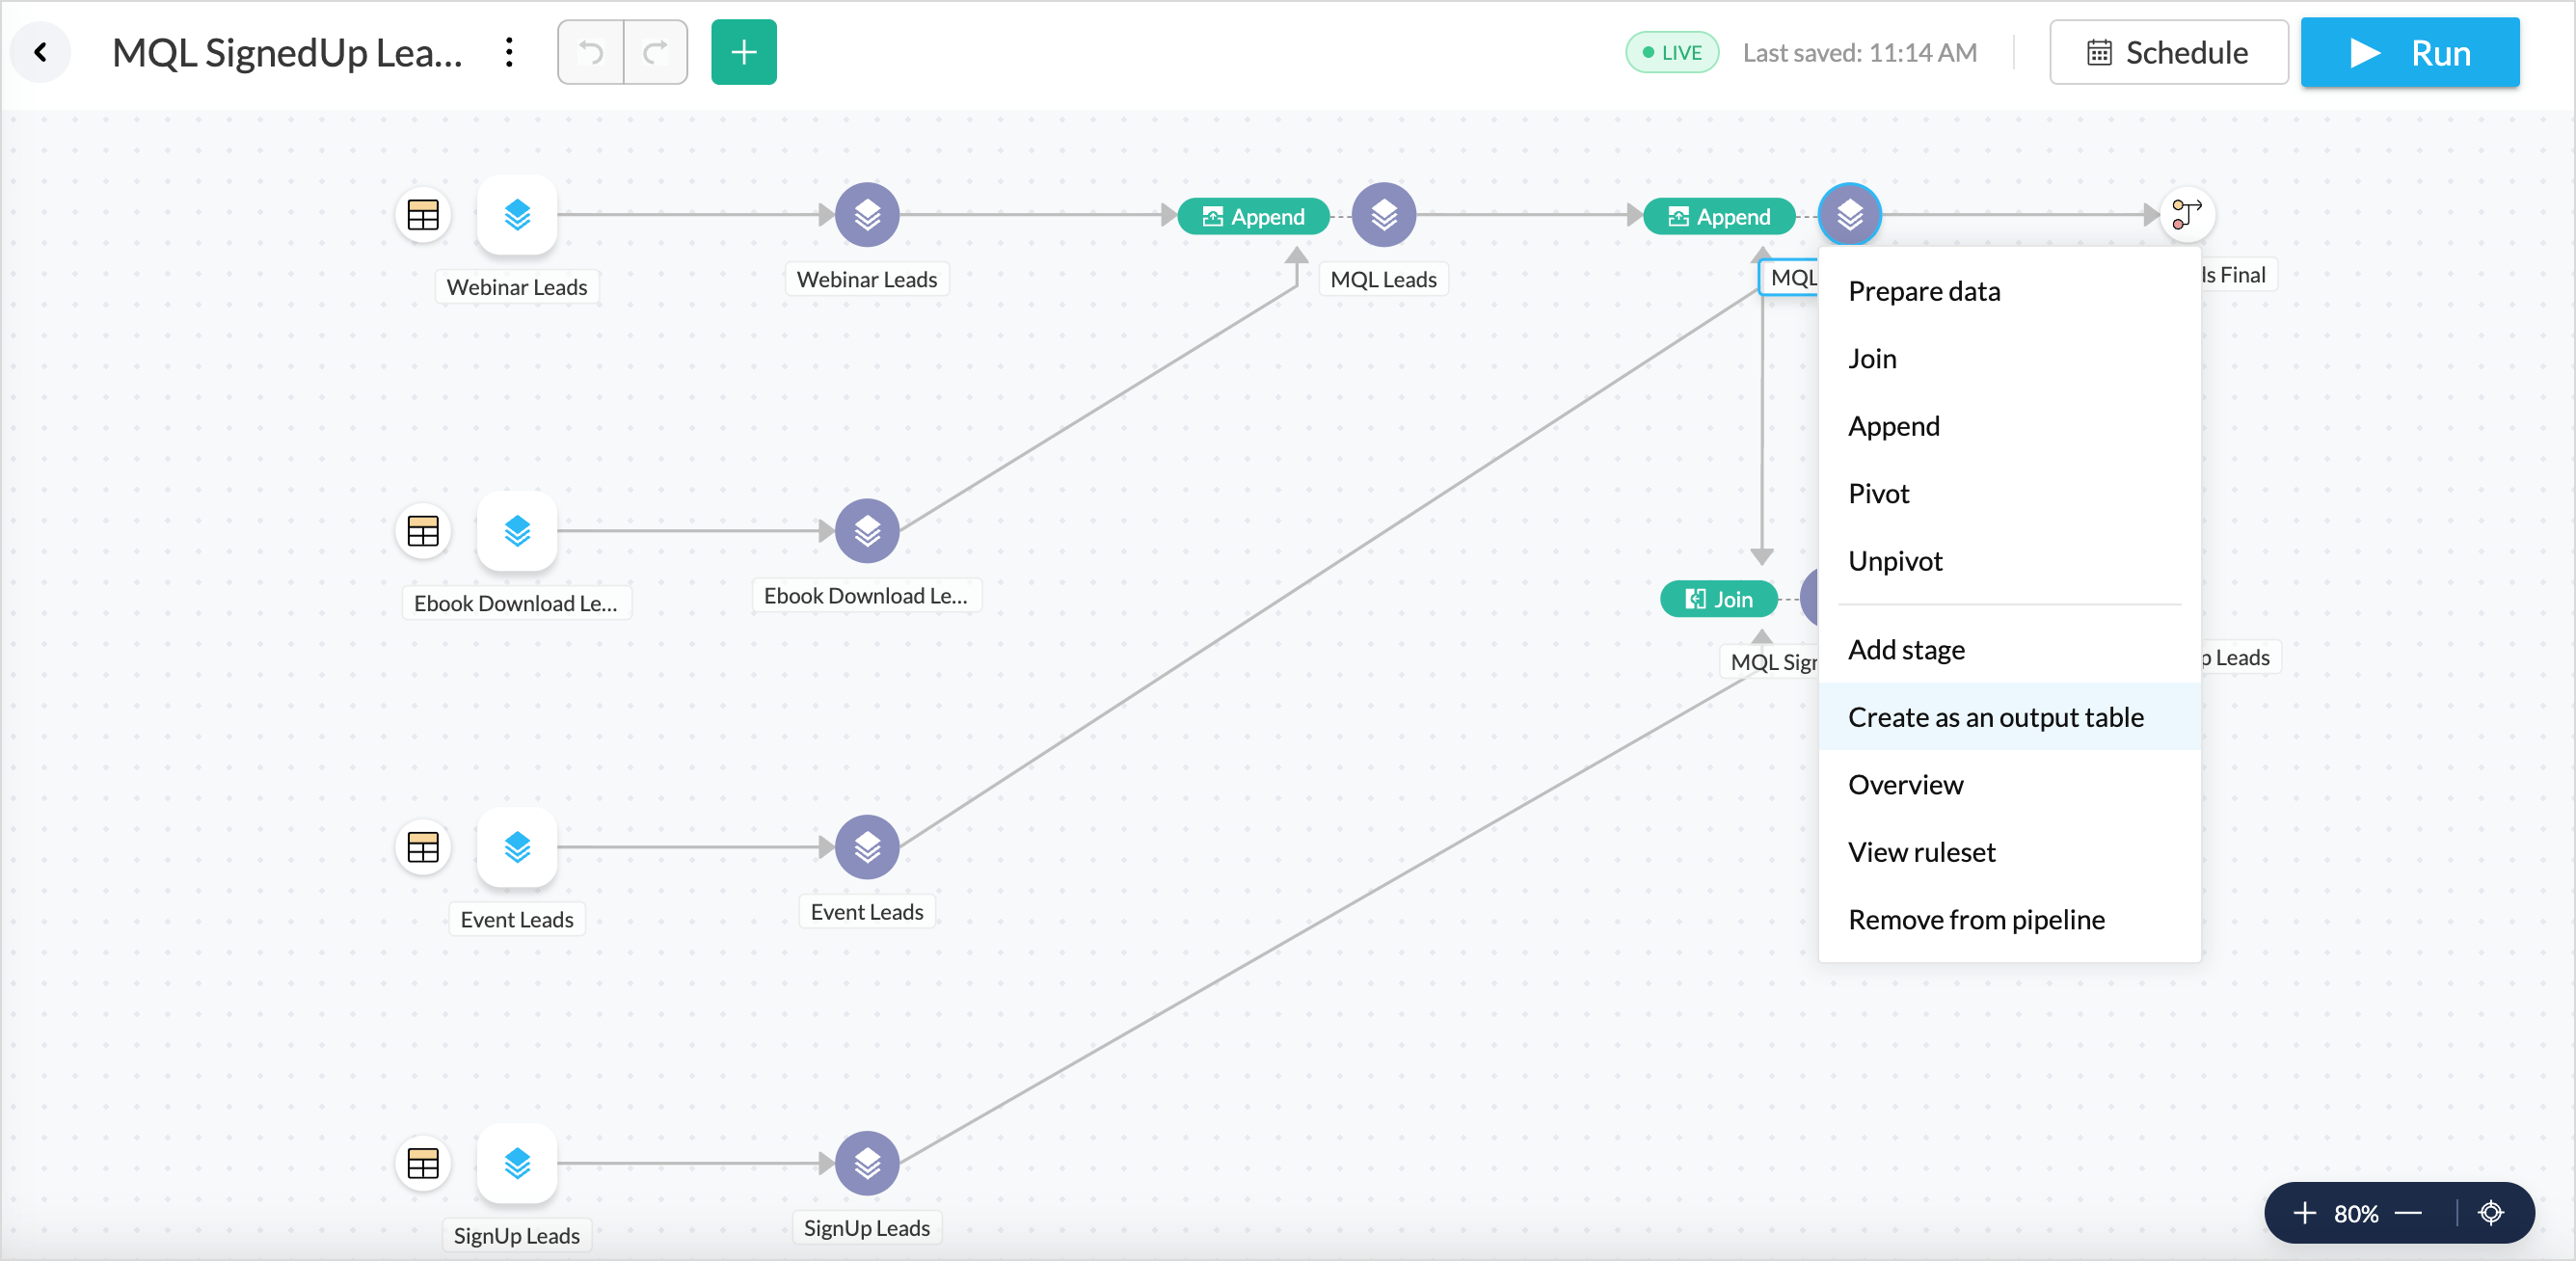
- Stages are nodes created for processing data while applying data flow transforms. Every table selected will have a stage created by default.


Note: Data pipelines are currently not supported for tables connected using the Live Connect option.
Data Transformation
- Click the + icon and choose Prepare Data to open the DataPrep Studio page and explore more data transformations.
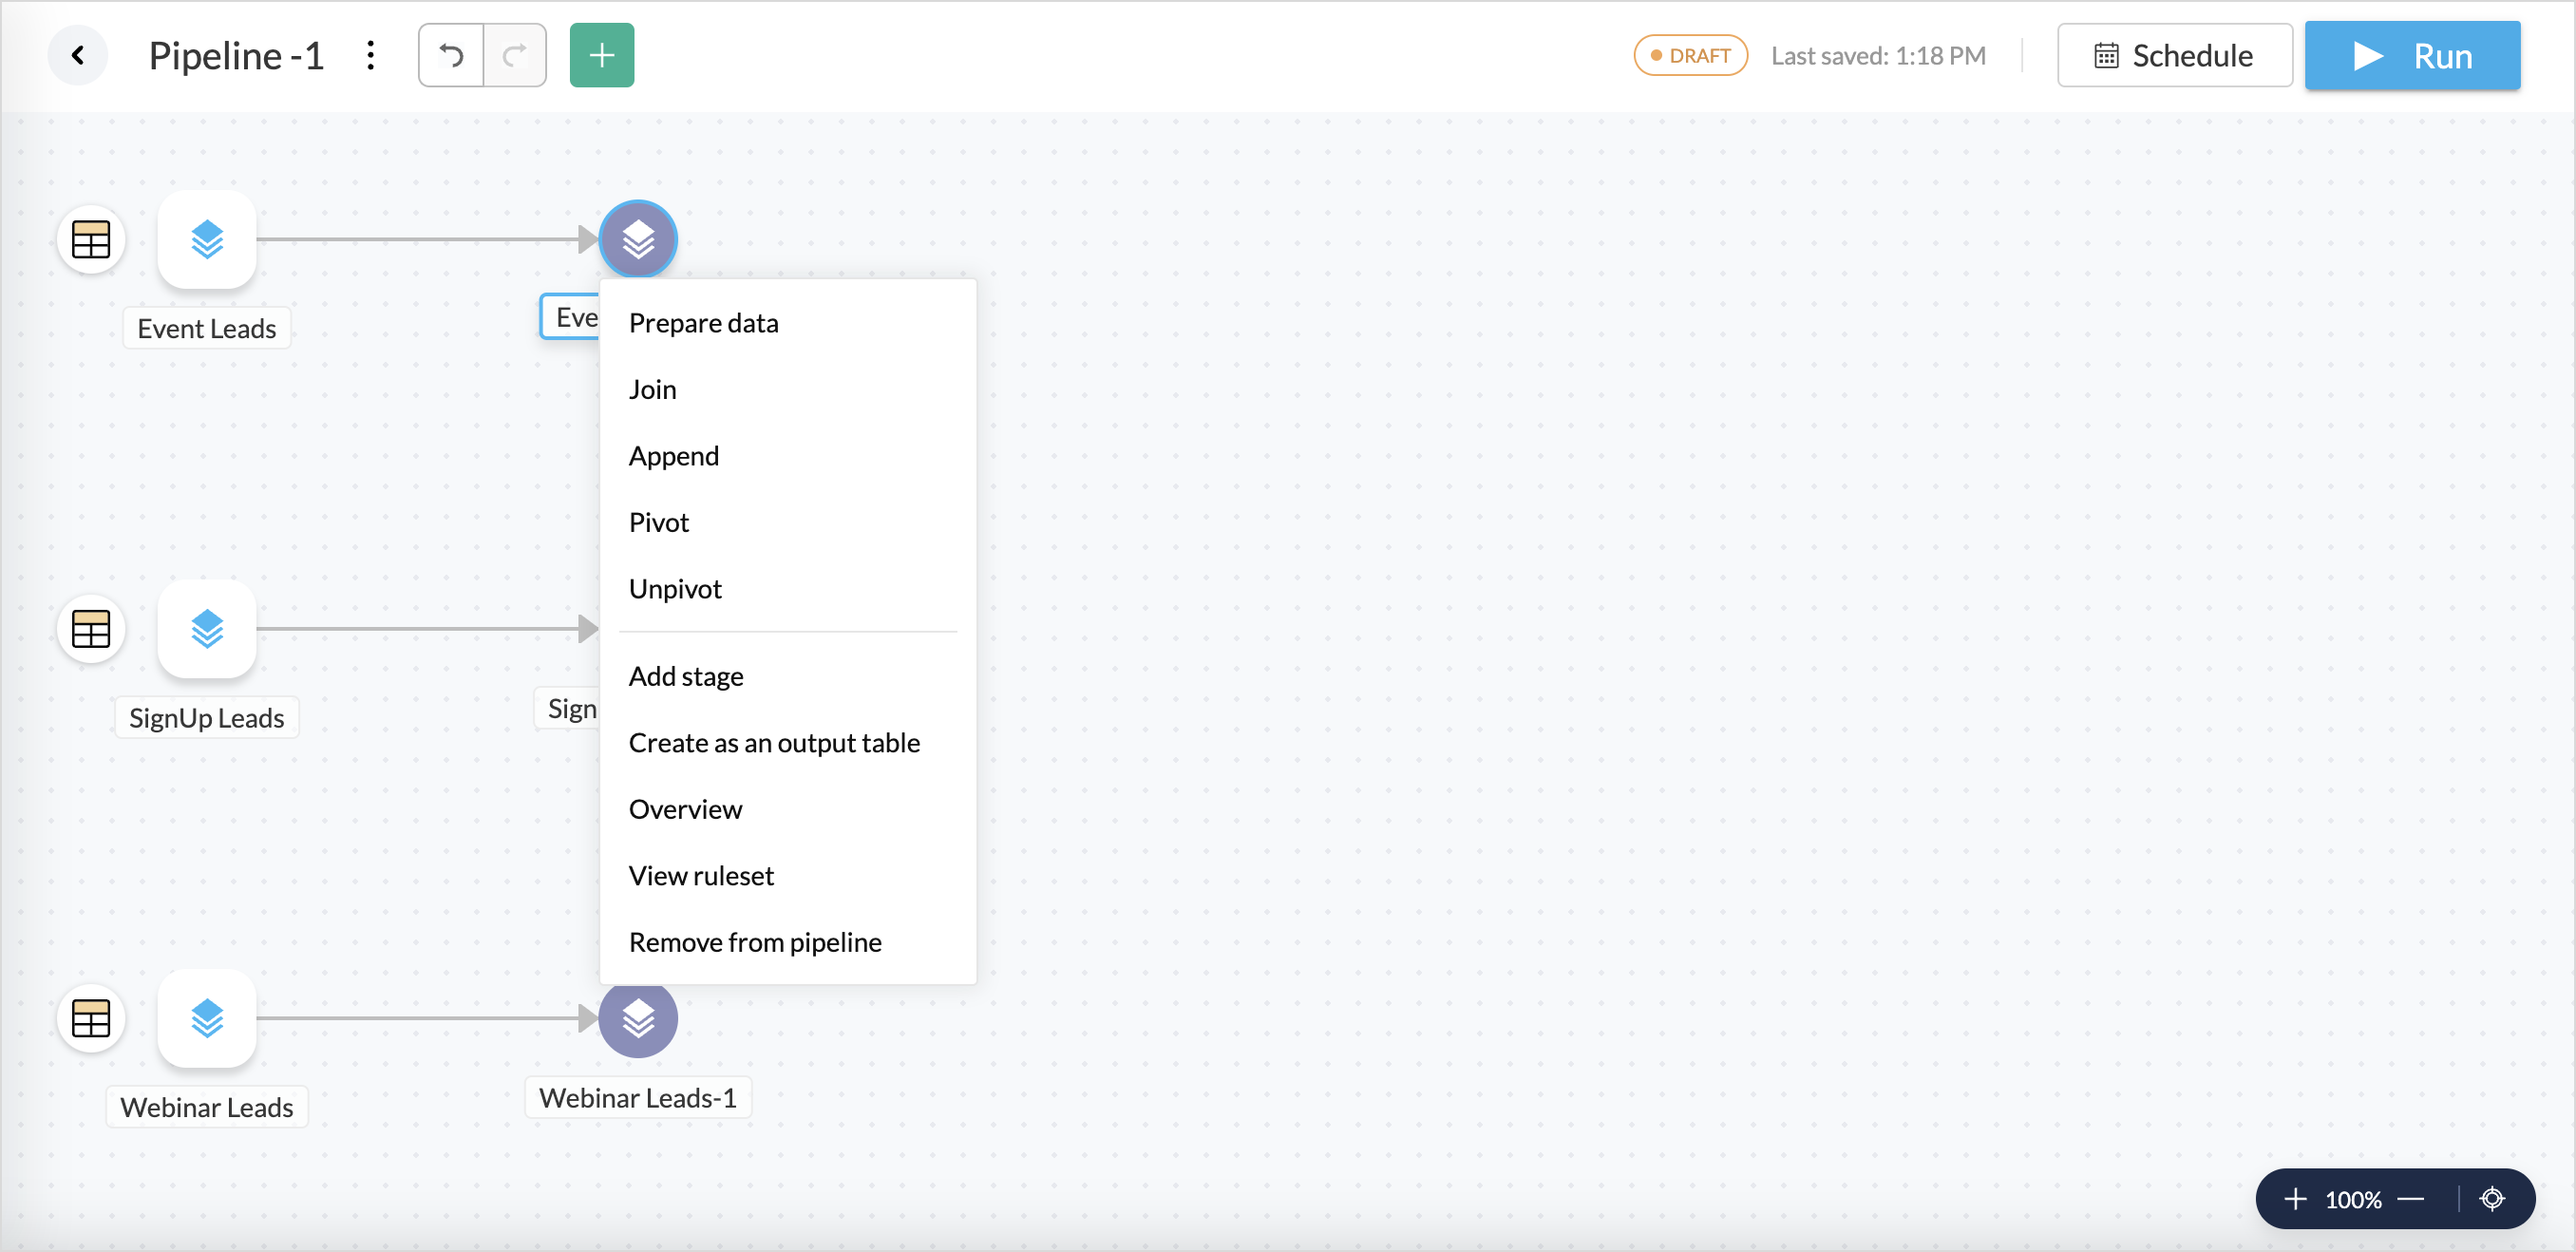
- Alternately, right click a stage and choose the necessary transformation function to be added to that stage.
- Append: Combines data from two or more datasets by adding rows from one dataset to another, assuming both have the same structure (columns).
- Join: Merges two datasets based on a common key, bringing together columns from both datasets.
- Pivot: Converts unique values from one column into multiple columns.
- Unpivot: Converts columns into rows, reversing a pivot operation, often used to normalize wide data into a long format.
- Once you are done creating a data flow, right-click the final stage and choose Create as an output table.


Pipeline Execution
Once you have created the output table, Zoho Analytics allows you to execute the data pipeline either through a Manual Run or by scheduling it for automatic execution. Any pipeline created is saved as a Draft initially. To add the pipeline as a table to the workspace, click the Draft option and change it to Mark as Ready.

Manual run
Click the Run option in the top right corner. Each pipeline execution is saved as a job, and a summary is provided for each execution.
Scheduling Pipeline Execution
Scheduling pipeline automates the execution of a data pipeline at predefined intervals. Instead of running the pipeline manually each time, you can set up a schedule to trigger the pipeline automatically at specific times or frequencies.
To schedule a pipeline execution,
- Click the Schedule option in the top right corner.
- Choose the interval in which the pipeline should be executed from the Repeat option. The following are the supported intervals for execution.
- Every N hours
- Every Day
- Weekly Once
- Monthly Once
- Select the Time zone in which the pipeline execution should occur. By default, your local time zone will be selected.
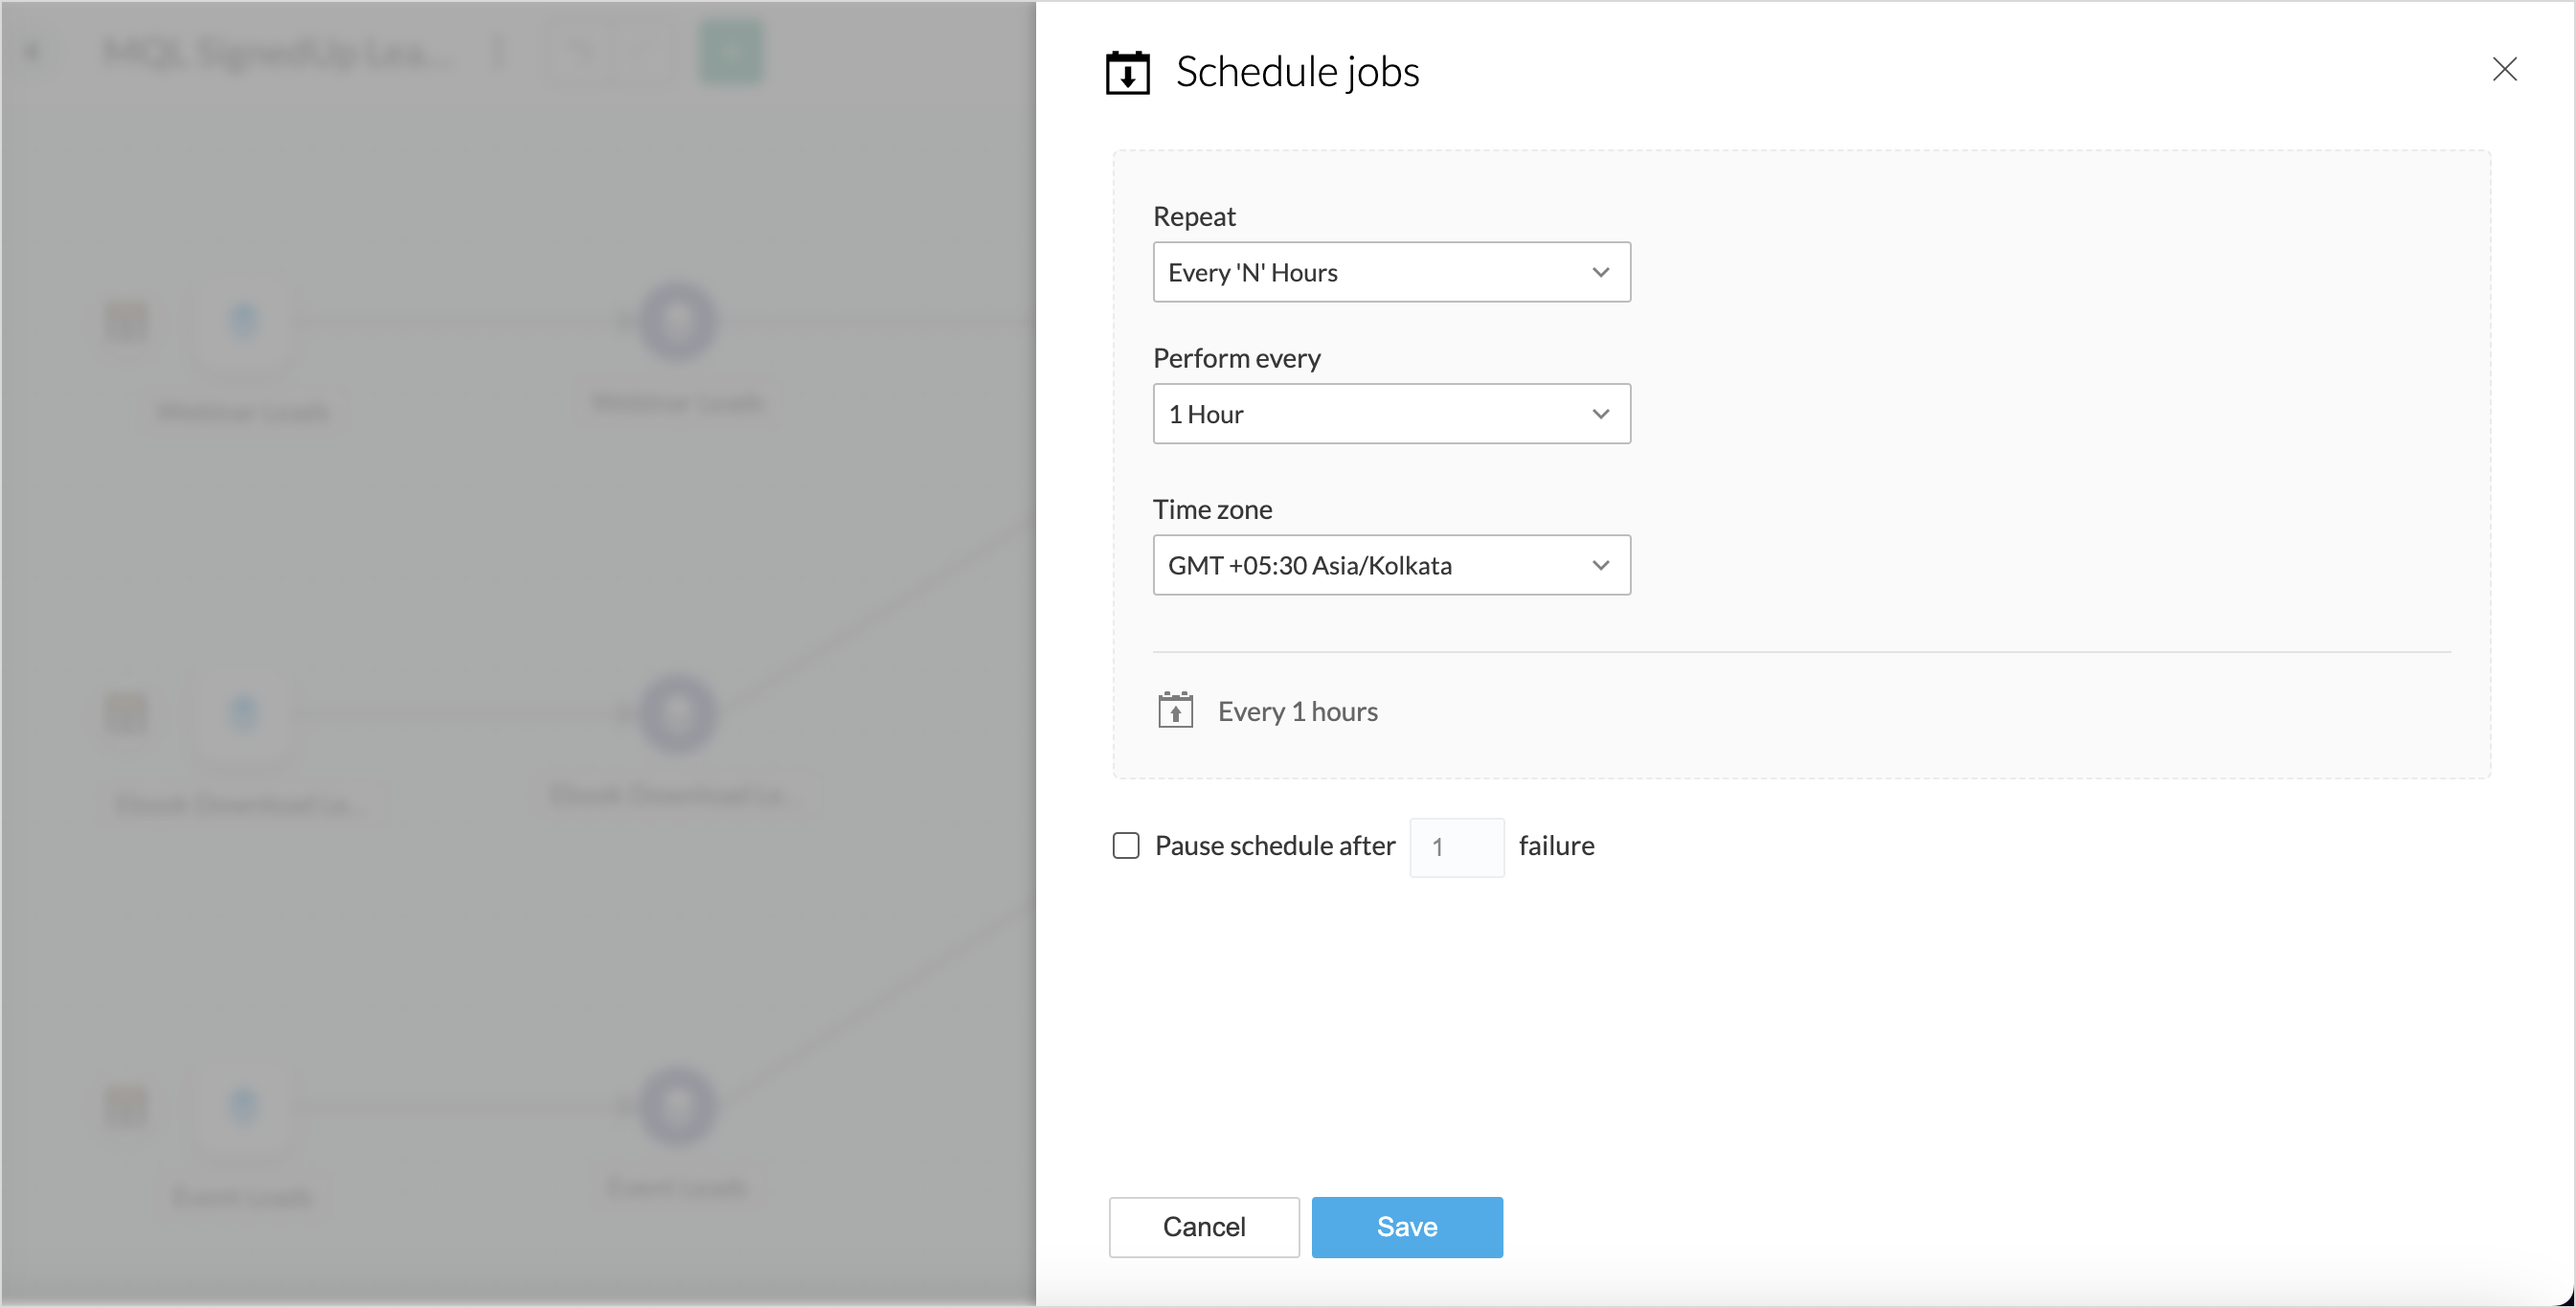
- The Pause Schedule After option allows you to choose to stop the schedule after n number of failures.


Job Summary
A pipeline execution is called a Job; a job tracks the progress of imports, transformations, and exports in a pipeline. Each time a pipeline is executed, a Job summary is provided.
Overview
The Overview tab provides the general details about the pipeline execution as given below:
- Pipeline Status: Indicates whether an execution was a success or a failure.
- Duration: The time taken for execution.
- Run by: The user profile who executed the pipeline.
- Storage Used & Data Processed: Shows the total data storage and the number of rows used for executing the data pipeline.
- Start & end time: Gives the time when the execution was started and completed.
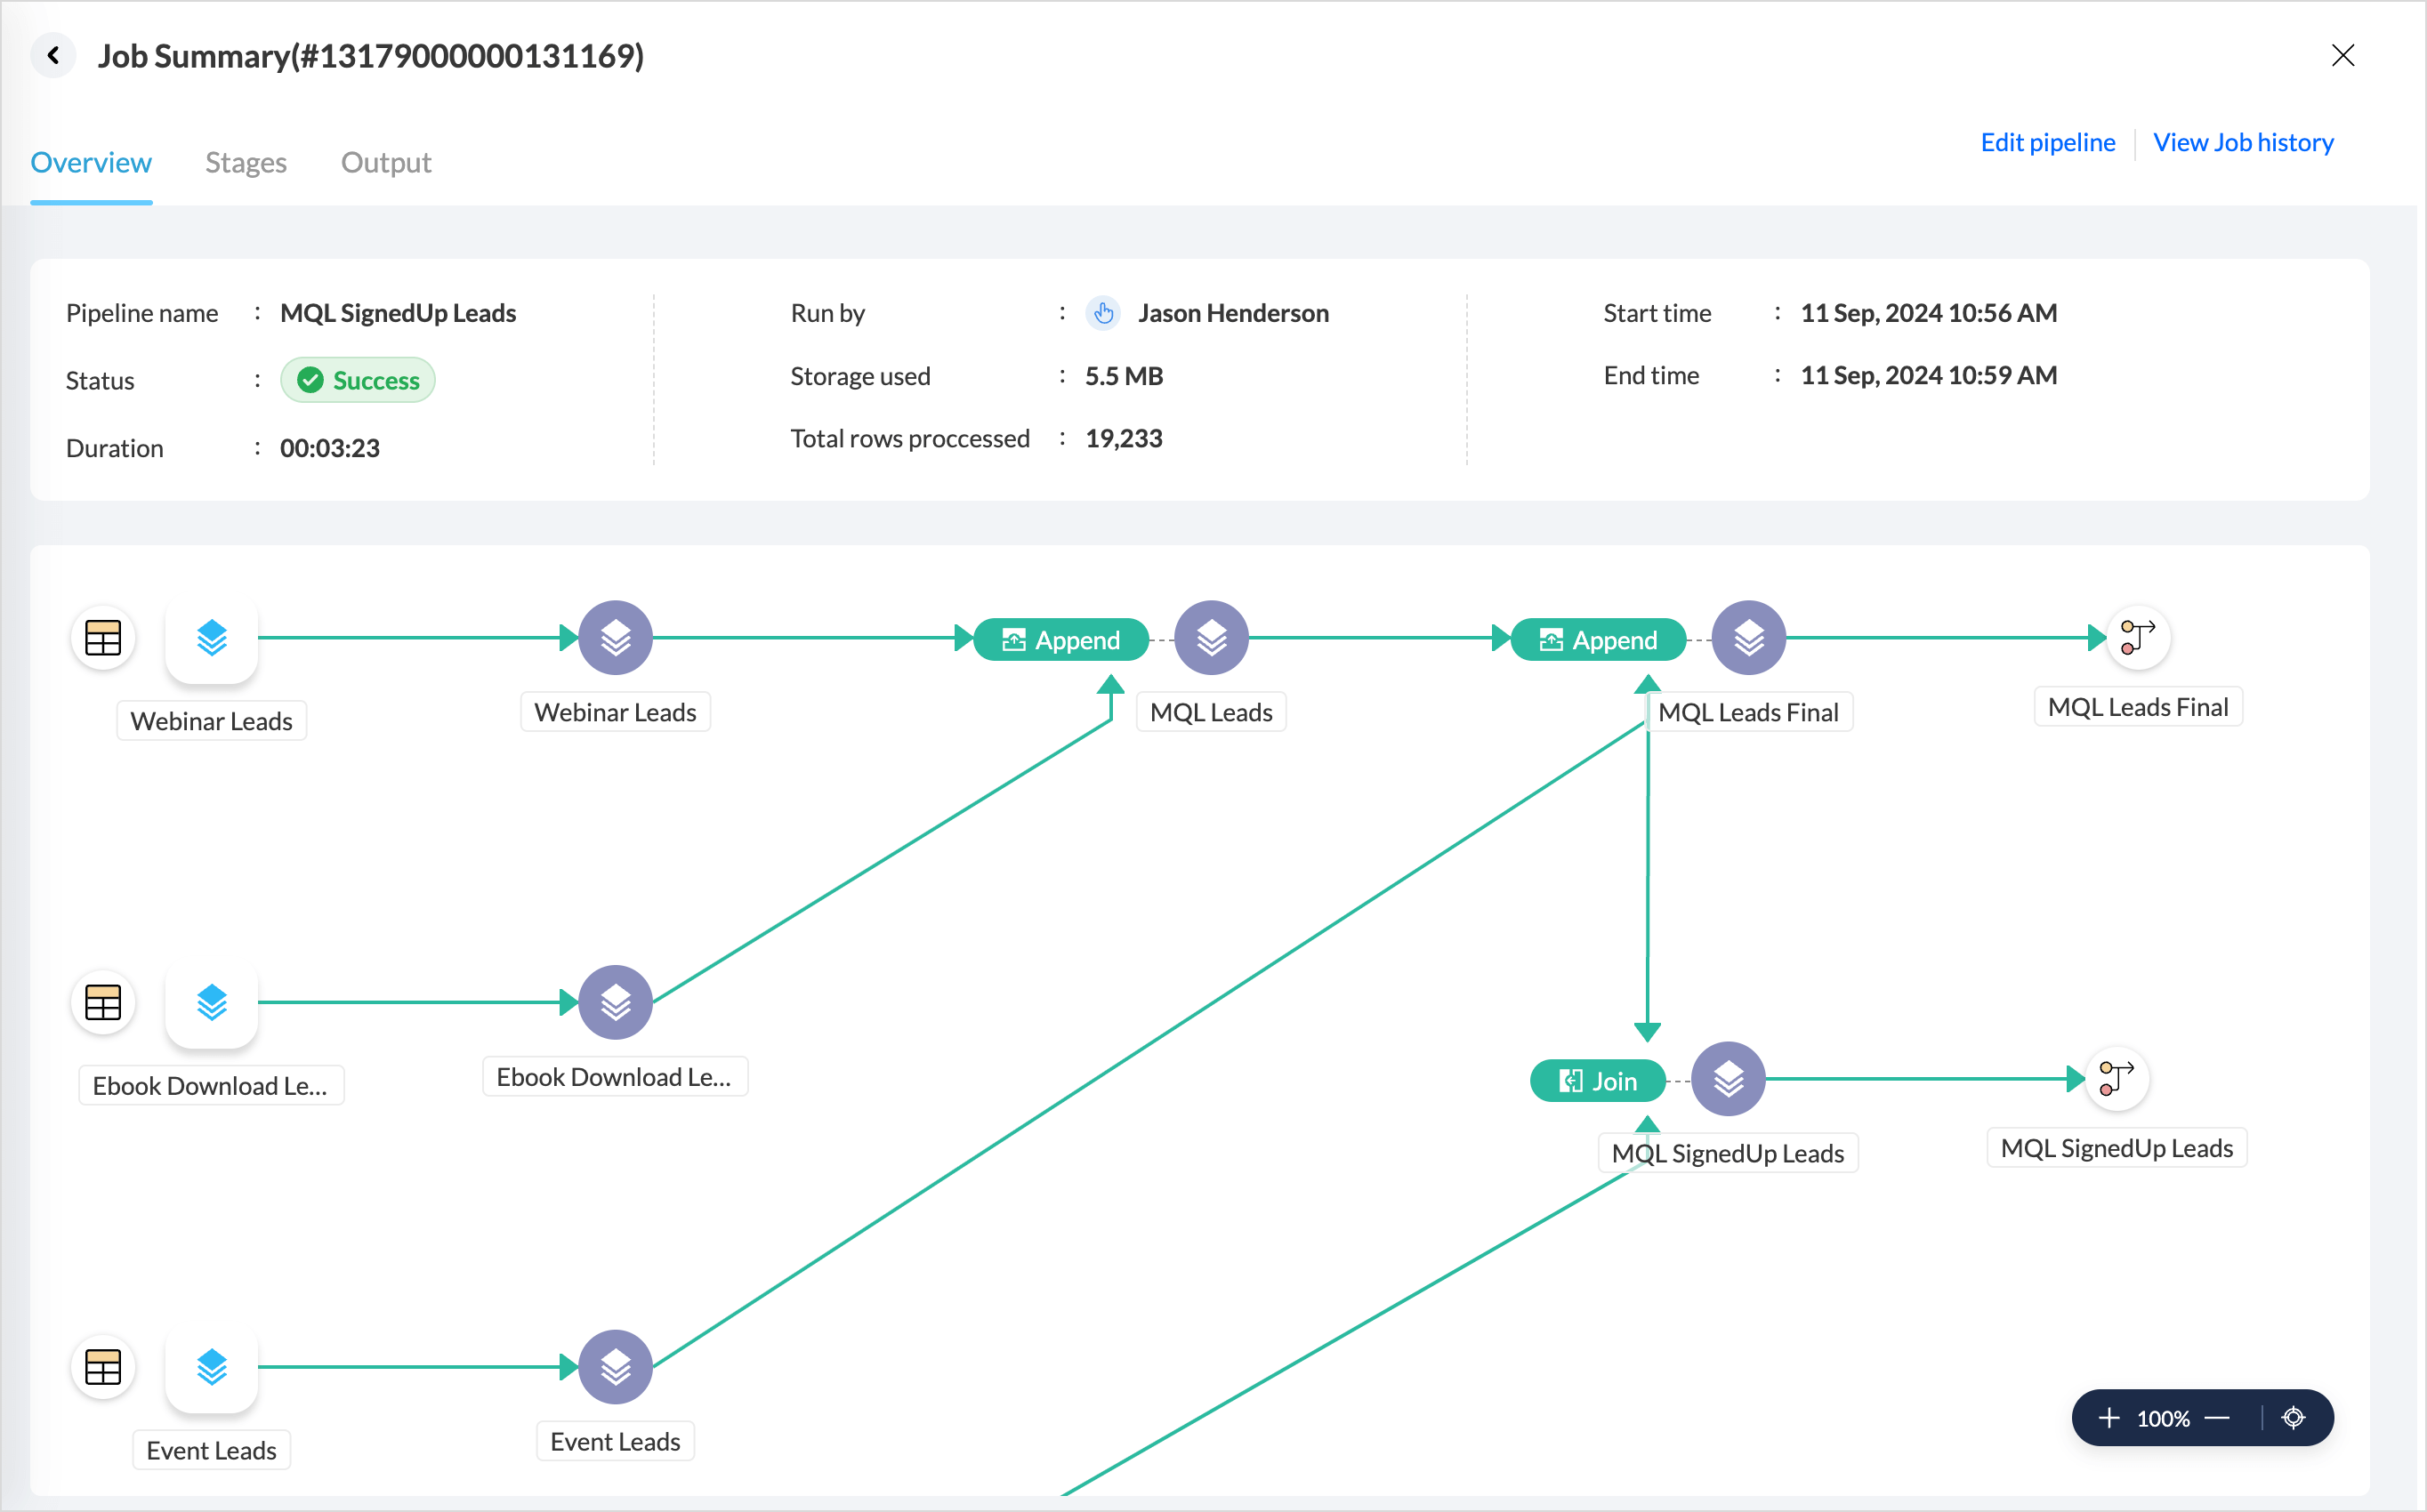

Stages
The Stages tab provides a detailed summary of each stage in the pipeline, such as the tables used for creating the data flow, the transform functions applied over the tables, and the details of the final table to be exported.
Output
The Output tab displays the data quality, total number of rows consumed, data size, and status of the pipeline execution of the final table.

Edit Pipeline
The Edit Pipeline option allows you to modify the pipeline flow. Choosing this option will open the pipeline builder pane.

Job History
Job History displays records of all pipeline executions, including details such as execution time, status, user who initiated the run, and the storage and rows consumed. Job with manual execution and sync schedule are also listed separately.
Manage Data Pipelines
The Data Sources tab lists all the connections configured and the data pipeline flows created within the workspace.
Click the Pipelines tab to view and manage the pipelines in the workspace. It provides general details about each pipeline status, such as Last Modified Time, Last Run Time, Next Schedule, and Schedule Status for each pipeline.

- Click any pipeline to access the Pipeline Builder to modify or execute the pipeline.
- Click the more icon to view the job history or to delete a pipeline.