


Anomaly Detection
Anomaly, or outlier detection, is the process of identifying events or data points that exhibit a significant deviation from the standard or expected behavior. Identifying the outliers in the data serves as an early indicator for various scenarios, helping executives and analysts find potential issues if any, capitalize on successful strategies, or understand external factors that contribute to better performance.
Zoho Analytics deploys robust machine learning algorithms like RPCA (Robust Principal Component Analysis) and various statistical models for detecting the outliers. This feature is highly customizable according to the distribution of the data.
- Business Use Cases
- Points to Note
- How to Apply Anomaly Detection to the Data
- Anomaly Detection for Dimension Fields
- Information about the Anomalies
- Machine Learning Model - RPCA (Robust Principal Component Analysis)
- Statistical Models
Business Use Cases
- E-commerce: It helps businesses understand the reasons behind a sudden spike or drop in sales. An increased cart abandonment rate in a short period of time can signal issues with the websites while checking out.
- Marketing: It can be used to understand the underlying reasons that lead to increased or decreased website traffic or signups.
- Help desk: It can be used to identify sudden spikes in support ticket submissions or issues related to a specific product that may require attention.
- Security Threat Detection: For cybersecurity, anomaly detection is essential for identifying unusual network activities or patterns that may indicate a security threat.
Points to Note
- Anomaly detection is supported for columns of numeric data type.
- The RPCA model requires a minimum of 6 data points and statistical model requires a minimum of 7 data points to identify anomalies.
- Anomaly or outlier detection is supported for all types of line and bar charts.
- An anomaly can be applied for multiple Y-axes.
How to Apply Anomaly Detection to the Data
- Anomaly configuration can be set up from a chart's Settings tab or from the Analysis data option on the tool bar.
- Select the columns for which the anomalies should be detected.
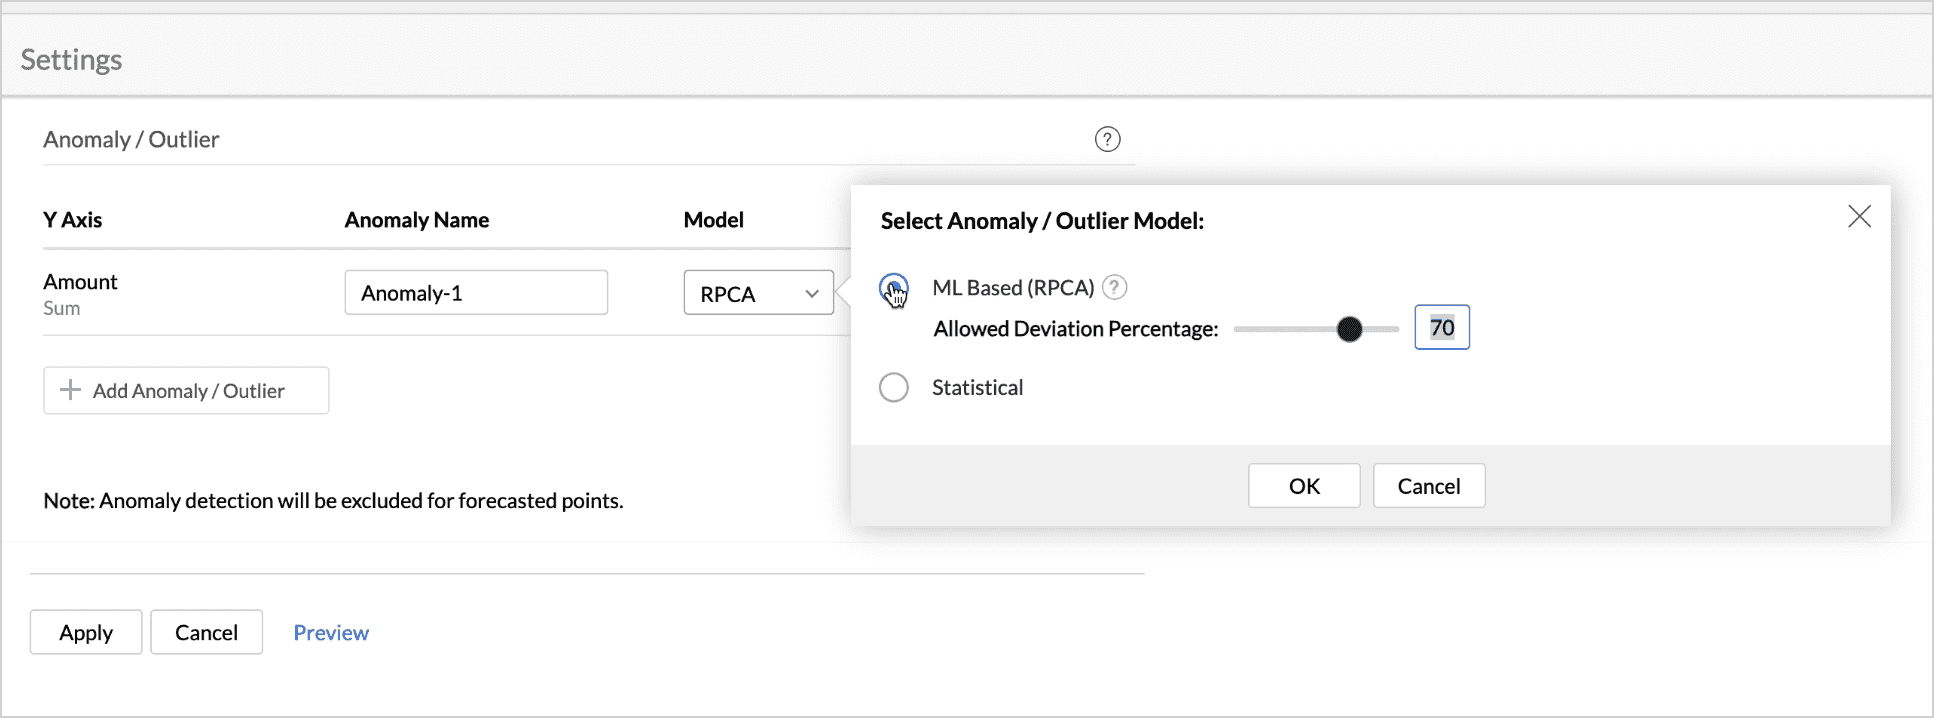
- Click the Add Anomaly / Outlier button.
- Give a suitable name of your choice.
- Select the Model that should be used for detecting the outliers. Refer to the Models sections to learn how to choose the models based on the data.
- RPCA Model: Adjust the Deviation Percentage of the RPCA model if needed. Decreasing the deviation percentage makes the data more sensitive, and even a slight deviation is marked as an outlier. Increasing the deviation percentage reduces the sensitivity, making it more selective in finding the outliers. 70% is set as the default deviation percentage for this model.
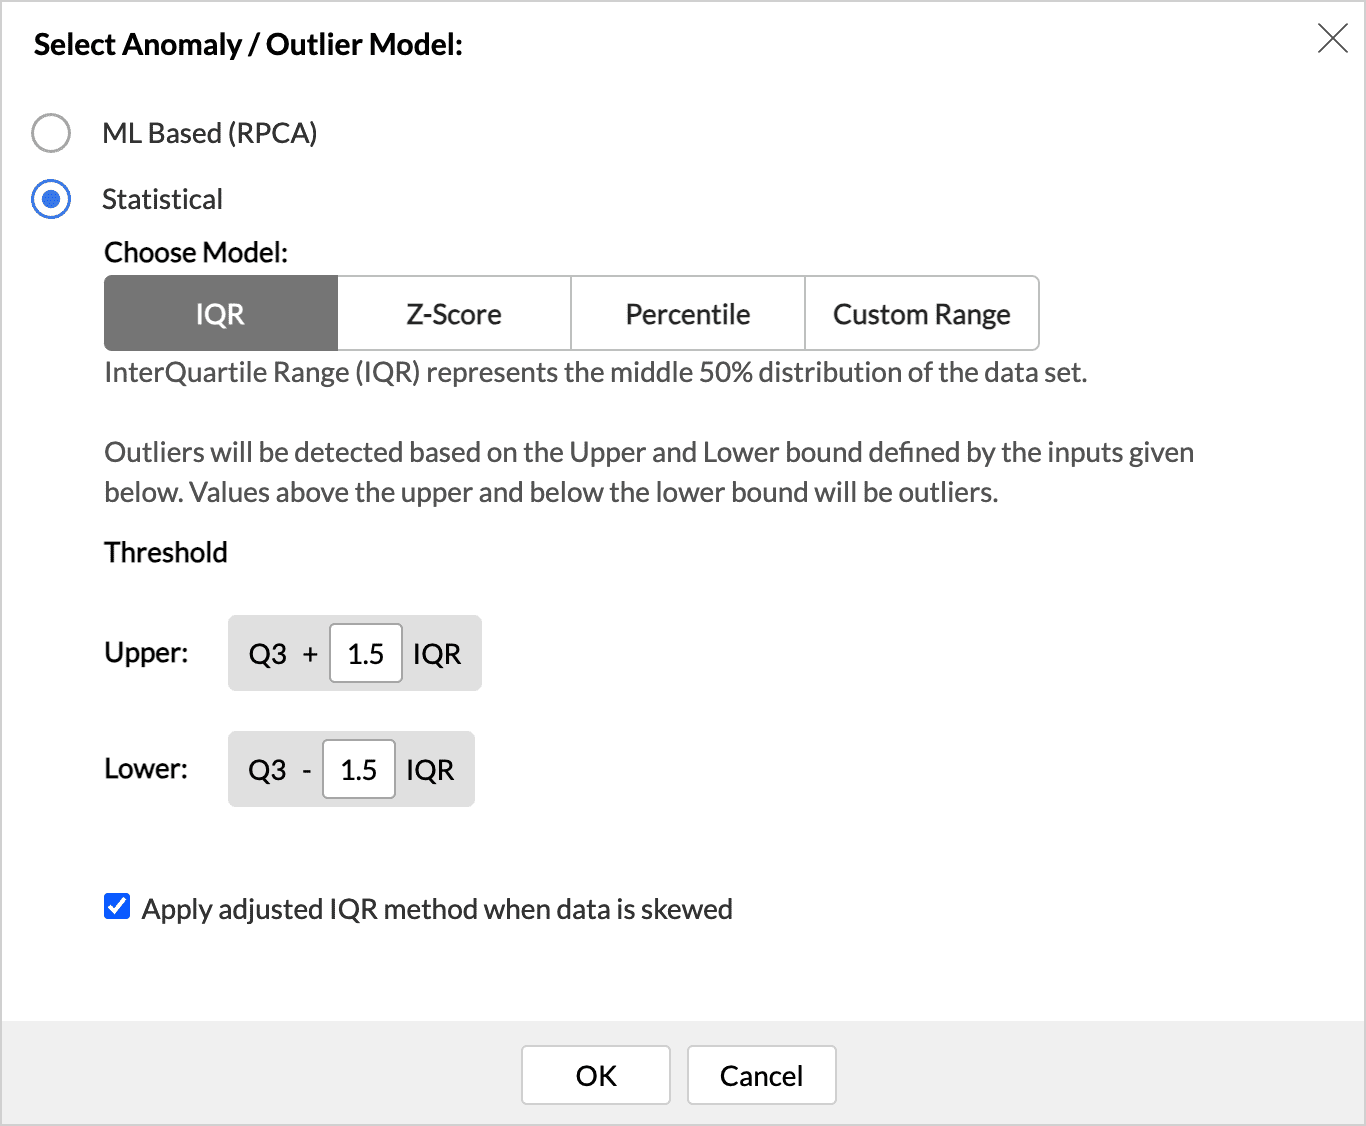
- Statistical Models: Choose the statistical model and the threshold that should be used to identify the outliers. Click here to learn how to choose the statistical model based on the data distribution.
- RPCA Model: Adjust the Deviation Percentage of the RPCA model if needed. Decreasing the deviation percentage makes the data more sensitive, and even a slight deviation is marked as an outlier. Increasing the deviation percentage reduces the sensitivity, making it more selective in finding the outliers. 70% is set as the default deviation percentage for this model.
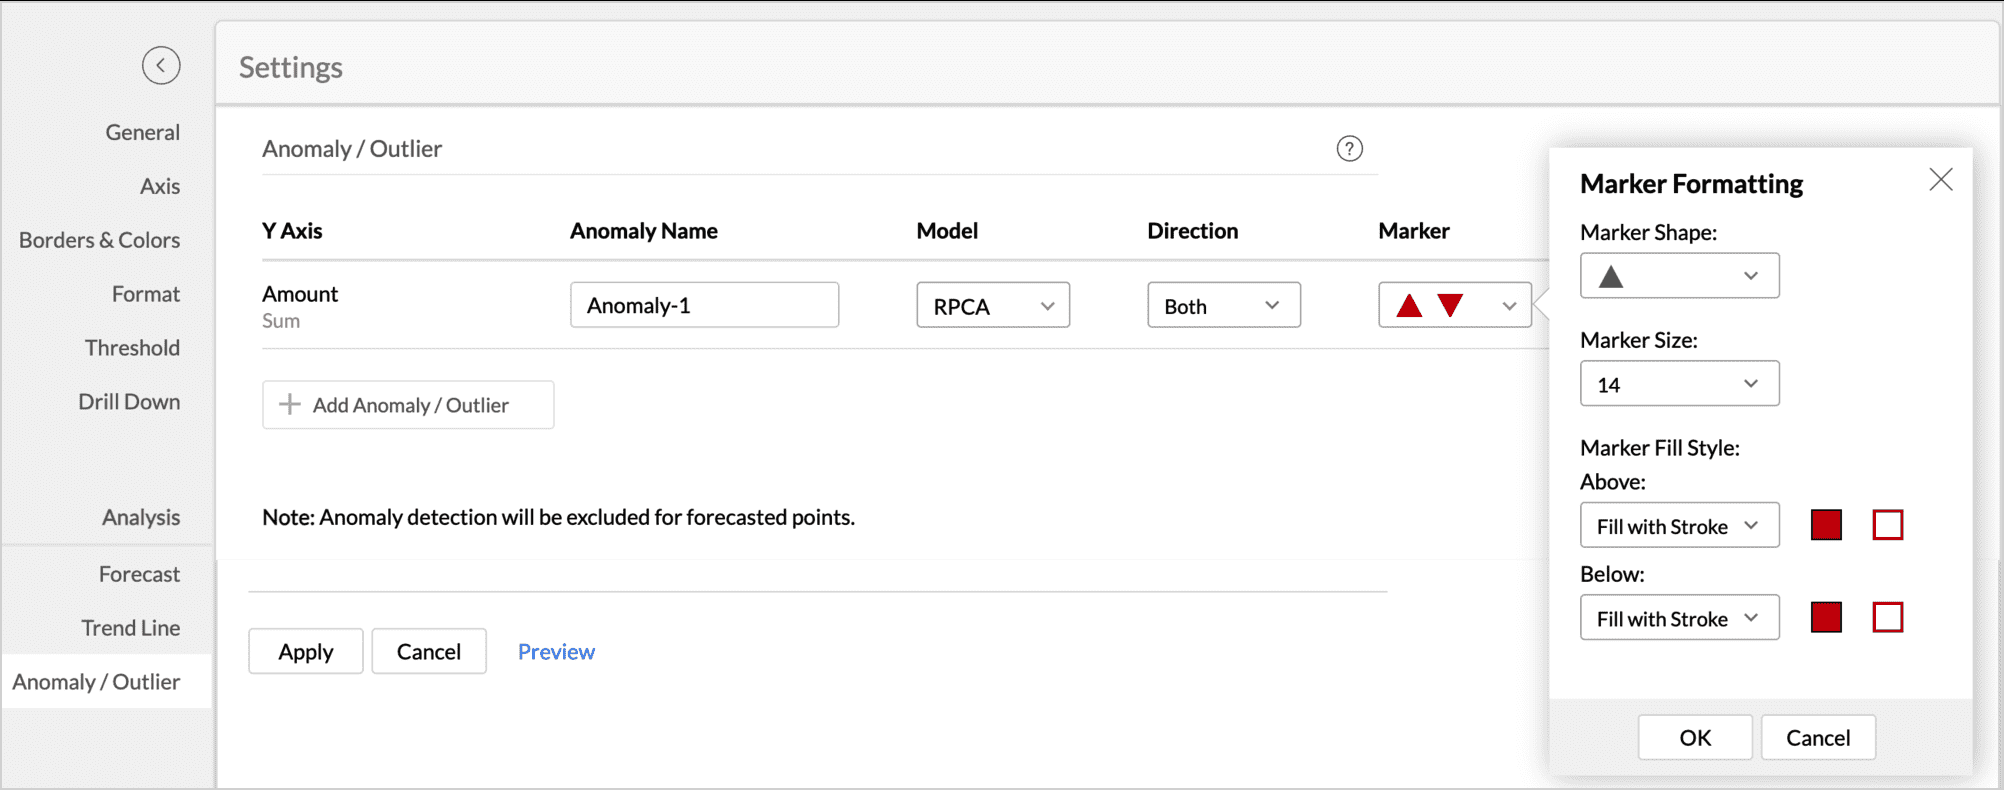
- Select the Direction (Above, Below) to identify anomalies within the specific boundaries. By default, anomalies are identified in Both directions.
- While choosing the direction, the threshold options will be available based on the directions
- Above: When the Above Direction option is chosen, the upper threshold configuration alone will be displayed for the statistical models.
- Below: When the Below Direction option is chosen, the lower threshold configuration alone will be displayed for the statistical models.
- Customize the Marker Shape, Size, and Color as needed. Varied colors can be used to differentiate the upper and the lower anomalies.
- Click Apply.


Anomaly Detection for Dimension Fields
Zoho Anaytics detects anomalies when a dimension field (category) is dropped in to the color shelf. It provides the below options to define how the anomalies should be detected.

- Overall Data: This considers the data as a whole and detects anomalies across all data points.T
- Each X-series: This detects anomalies for each value in the x-series individually.
- Each Color - Series Individually: This detects anomalies for all the different categories in the data dropped in the color shelf.
- Each Combined Series of X and Color Columns: This detects anomalies combining the x-axis values and the color column values.
Information about the Anomalies
The data points that are identified as outliers will be marked in red. Upon clicking on these marked data points, detailed information about the anomalies will be displayed.

- Expected value - The Y-value computed by the selected anomaly detection methods for the underlying X-value.
- Difference - The difference between the actual value of an anomaly and its expected value.
- Deviation Percentage - Percentage of the deviation over the expected value.
Machine Learning Model - RPCA (Robust Principal Component Analysis)
This model is capable of accurately identifying anomalies in a single-variable dataset within time-series data, considering both seasonal patterns and temporal aspects. The algorithm in this model identifies anomalies based on the allowed deviation percentage. By adjusting the deviation percentage, the algorithm can detect anomalies that exhibit significant deviations. The range of deviation can vary from 0% to 95%. 70% is the default deviation percentage.
This method is best suitable for detecting anomalies on aggregated measures over time-series values.
Statistical Models
Interquartile Range
IQR - The interquartile range (IQR) is a measure of statistical dispersion that describes the range within which the middle 50% of a data set falls. The Outliers are calculated based on this range.
The IQR is calculated as the difference between the third quartile (Q3) and the first quartile (Q1). The default scale value of 1.5 is multiplied by the IQR to determine the upper and lower boundaries (thresholds). The threshold values can be adjusted based on the distribution of the data.
For data with a skewed distribution, the adjusted IQR method will be applied.
Z-Score
The Z-score determines how far a data point is from the mean of the dataset in terms of standard deviations. By default, a data point will be marked as an outlier if the Z-score is more than 3 standard deviations.
A Z-score of ±3 is often set as a threshold for detecting the outliers. This means that data points falling beyond 3 standard deviations from the mean in either direction (to the left or right) are considered outliers. The thresholds can be adjusted based on the distribution of the data.
For data with a skewed distribution, the modified Z-score method will be applied. The Z-score is calculated based on the Median Absolute Deviation method.
Percentile
A percentile is a statistical measure that represents the relative position of a particular value within a dataset. Percentiles divide the data into 100 equal parts, and the value at each percentile indicates the percentage of values that are equal to or below a given value. Outliers will be determined based on the percentile value.
The 5th and 95th percentiles are set as the default values for the upper and lower bound. The threshold values can be changed based on the specific characteristics of the data.
Custom Range
In this method, the upper bound and the lower bound are any particular values from the dataset. The outliers are calculated based on the thresholds.