Conversion Bar Chart
Conversion bar charts show the connected stages of a process and the gradual decrease in data as it moves through different stages of the process. Each stage is represented by a bar, with a step or stair case pattern indicating the shift in values at each stage.
On this Page
- Data Requirements
- Creating a Conversion Bar Chart
- Customizing Conversion Bar chart
- Possible Combinations
Data Requirements
A minimum of one dimension column and one measure column is required to create a conversion bar chart.
Creating a Conversion Bar Chart
- Access the chart designer.
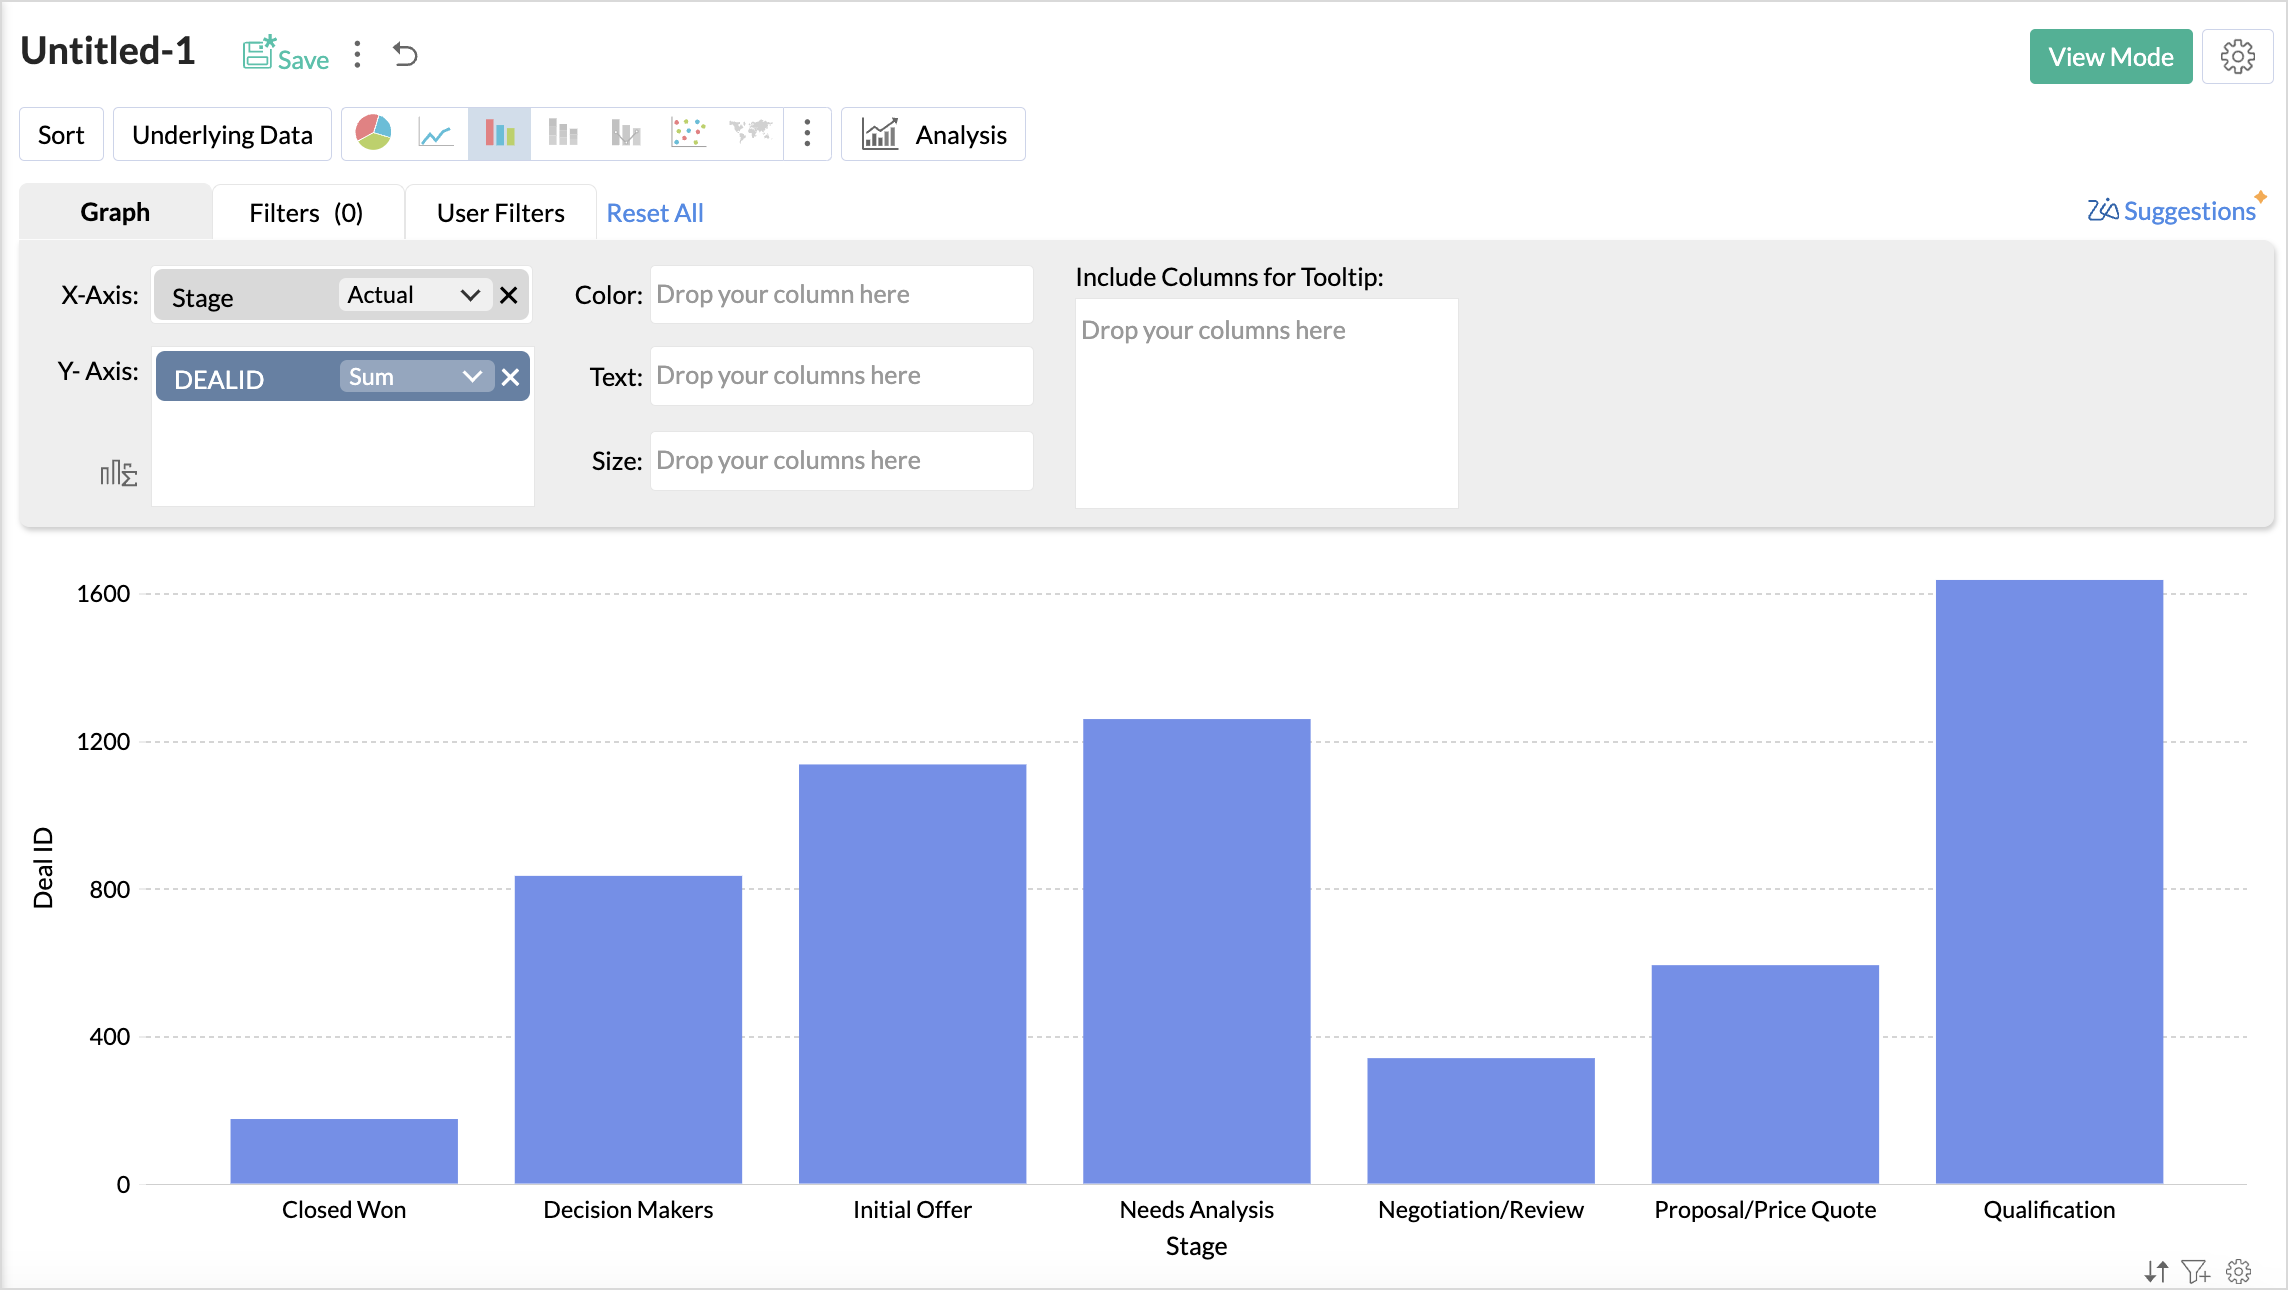
- Drag and drop the columns as shown below
- X-axis: Add a Dimension column.
- Y-axis: Add a Measure column.
- Click Generate Graph. A bar chart will be generated.
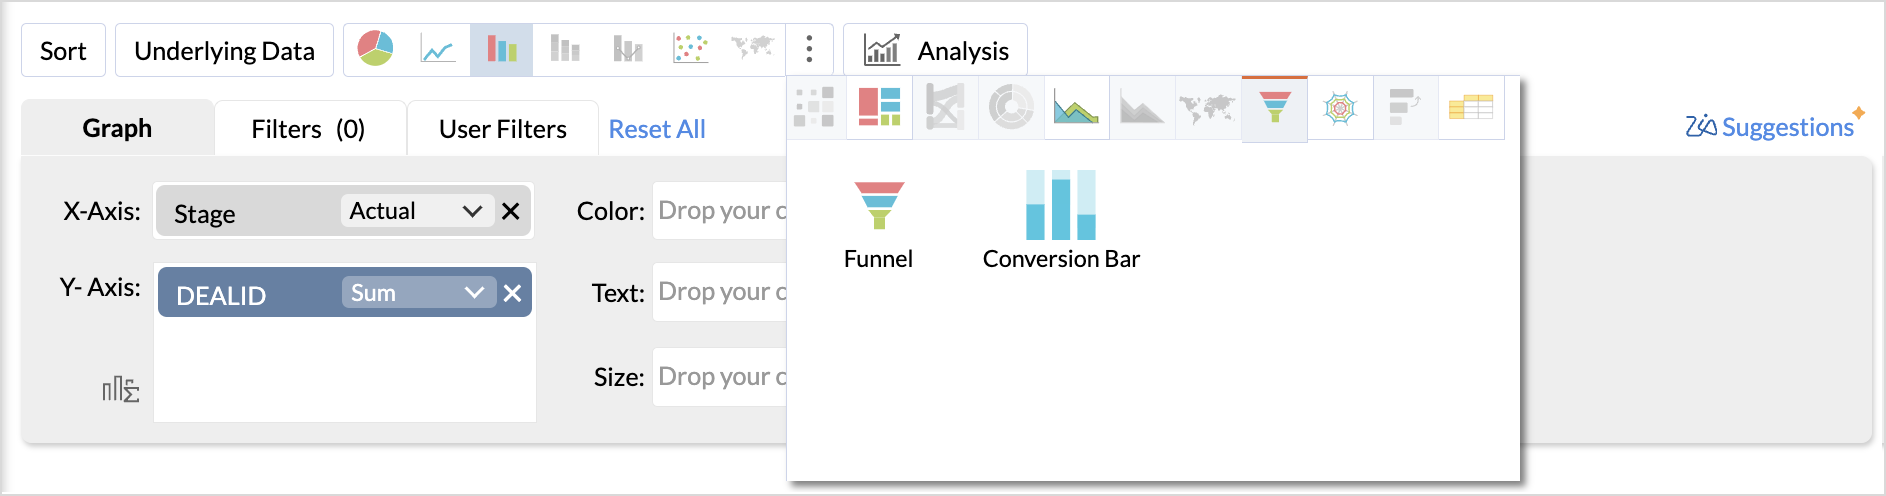
- Choose Conversion Bar from the chart types.


A conversion bar chart showing the flow of prospects will be created as shown below.
Customizing Conversion Bar Chart
Zoho Analytics offers extensive options to customize any chart. This section explains the customization options specific to the conversion bar chart. Refer to Customizing Charts article to learn more. Access the Settings tab to customize the chart settings,
Show Conversion Label
Click General to customize the data labels of the chart.
Difference Value: Displays the change in value between the current stage and its previous stage.
Percentage
Comparison with Previous Value: Displays the percentage by comparing the current stage with its previous stage.
Comparison with First Value: Displays the percentage by comparing the current stage with the first stage.
Show Conversion rate
Displays the overall conversion rate by comparing the first stage to the last stage.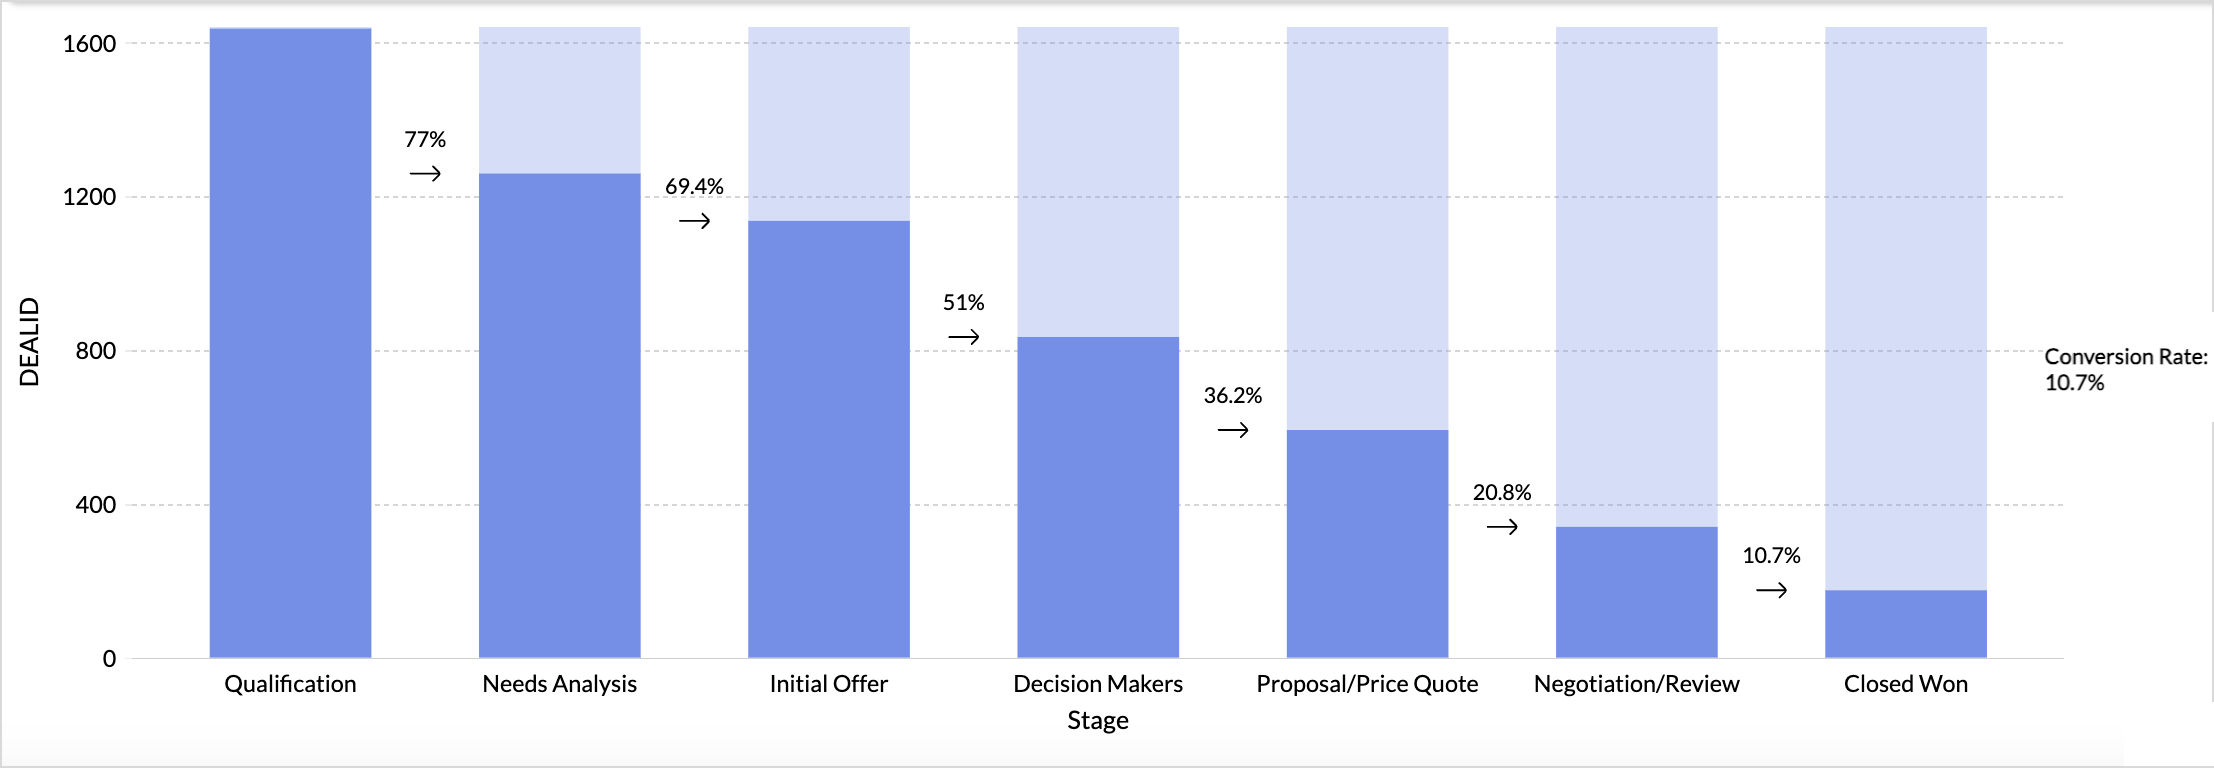
Possible Combinations
| X-axis | Y-axis | Color | Text | Tooltip | |
| Case 1 | Dimension | Aggregate | - | Aggregate/Measure (optional) | Aggregate/Measure (optional) |
| Case 2 | Optional | Aggregate | - | Aggregate/Measure (optional) | Aggregate/Measure (optional) |