Filter Quantitative Data
This article lists all the filter options available for quantitative data. Numeric data type has the following four filter options.
Individual Values
This option filters only the specific values from the data. All the values from the selected field will be listed in the filter shelf. Choose the values that need to be included or excluded. In the below example, the unknown values are excluded from being shown in the report.

Ranges
This option filters the data based on a specified numeric range. Default ranges of values are pre-listed in the filter shelf, and you can also define custom ranges for filtering.

Top or Bottom N
The top or bottom N filter is one of the extensively used filters for analysis. It quickly aids in identifying the high-performing and underperforming areas. Top or bottom N analysis can be executed across various dimensions and measures.
This analysis primarily works by sorting the data and then assigning a rank to each data point based on its relative position. Below is a simple example that shows the top 10 countries with the highest sales.

Top or Bottom N Filter Settings
While working with data, the need might arise to compute and identify the top or bottom contributors across various dimensions. The rank-based capabilities help achieve the complex cases easily. It helps conduct the top or bottom n analysis within individual groups and across multiple categories.
- By is the Primary Field based on the which the values will be grouped and ranked.
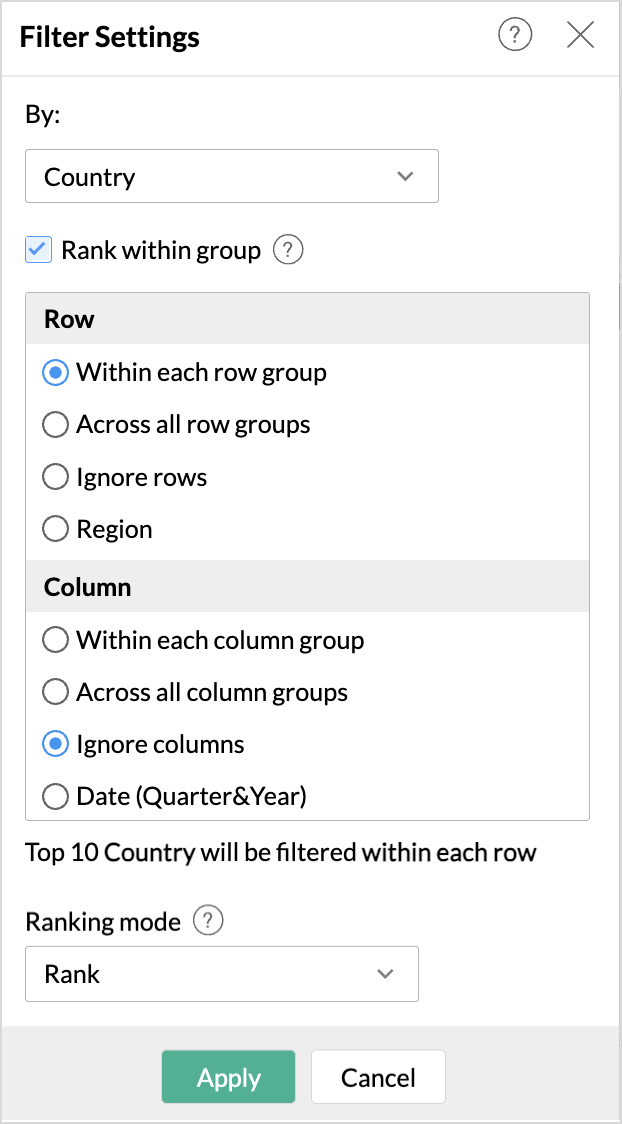
- Rank within group allows to identify the top or bottom n values in the report by customizing the grouping that should be used for ranking. The following are the options available:
- Within each Group: This option ranks the aggregated data and gets the top or bottom n values from each of the groups present in the report.
- Across all Groups: This option ranks the aggregated data and gets the top or bottom n values spanning across the entire group of fields
- Ignore Rows or Columns: This option is available only for the pivot view, and this excludes all the fields present in the row or column, shelf for ranking.
- Fields used in the report: The nested fields in the report present above the primary field chosen for ranking will be listed in the order in which the columns are dropped in the designer shelf.
- Ranking mode: By default, the records are ranked based on the basic ranking method. The ranking method can also be done based on Unique and Dense rank functions.

Examples to understand how different ranking combinations filter data
The below pivot table provides the summary of sales.

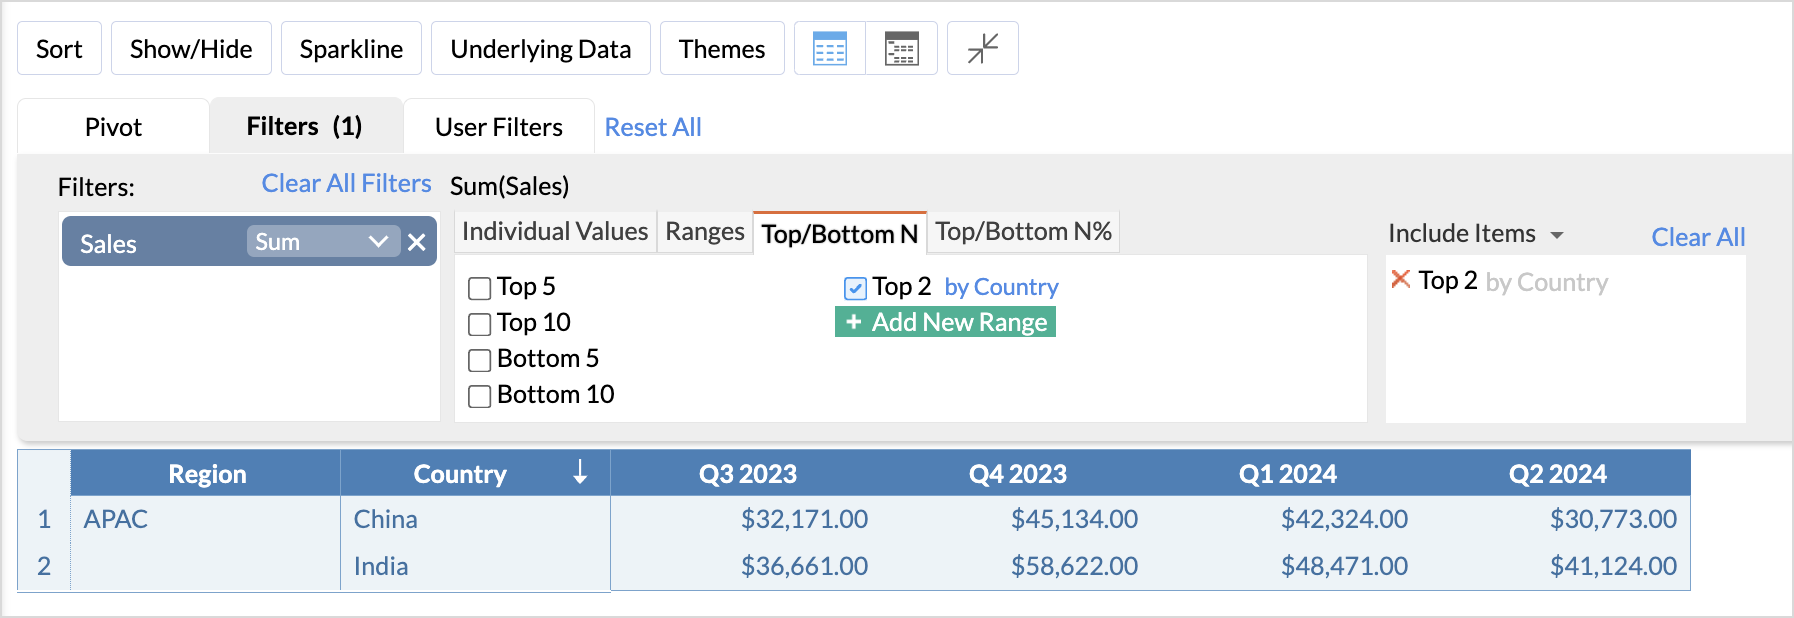
Now, let's say you want to filter or find the Top 2 countries with the highest sales in each region.
To achieve this,
- Drop the Sales (measure) column to the filter shelf and choose the Top/Bottom N filter option.
- Click Add new range and specify the range as Top 2.
- Choose the primary field (By) as Country. This will rank the sales based on the countries and give the top two countries with highest sales.
- To get the top two countries with the highest sales in each region, we need to group the country-wise sales within each region. To achieve this, select the checkbox Rank within group.
- Choose Within each row group option. This will filter the top two countries in each region with the maximum sales.
- Since we wish to get the top 2 countries within each region based on the overall sales and not the year-wise sales, we choose to ignore the column grouping for ranking by selecting the Ignore columns grouping.

- Click Apply.


This will filter the top two countries with the highest sales in each region.
Top or Bottom N%
This option filters the top or bottom N% of values from the selected field. In the below example, only the top 50% that contributes to sales is filtered.
