


Integrate ClickUp Data with Zoho Analytics
Ensure timely and high-quality project delivery with the ClickUp - Zoho Analytics integration. Identify potential risks early and optimize workflows with data-driven decisions. Analyze team and individual performance based on task completion, time tracking, and other key metrics. Track how far ahead or behind you are from finishing a project, using the burndown reports, and take corrective actions promptly.
- Setting up the Integration
- Data Sync Frequency
- Handling Data Synchronization Failure
- Manage Data Sources
- Data Modeling & Preparation
- Data Visualization/Analysis
- Sharing & Collaboration
- Help & Support
Setting up the Integration
A user with Administrator privileges (Account admin, Org admin) can configure the integration.
Follow the below steps to seamlessly import your ClickUp data into Zoho Analytics:
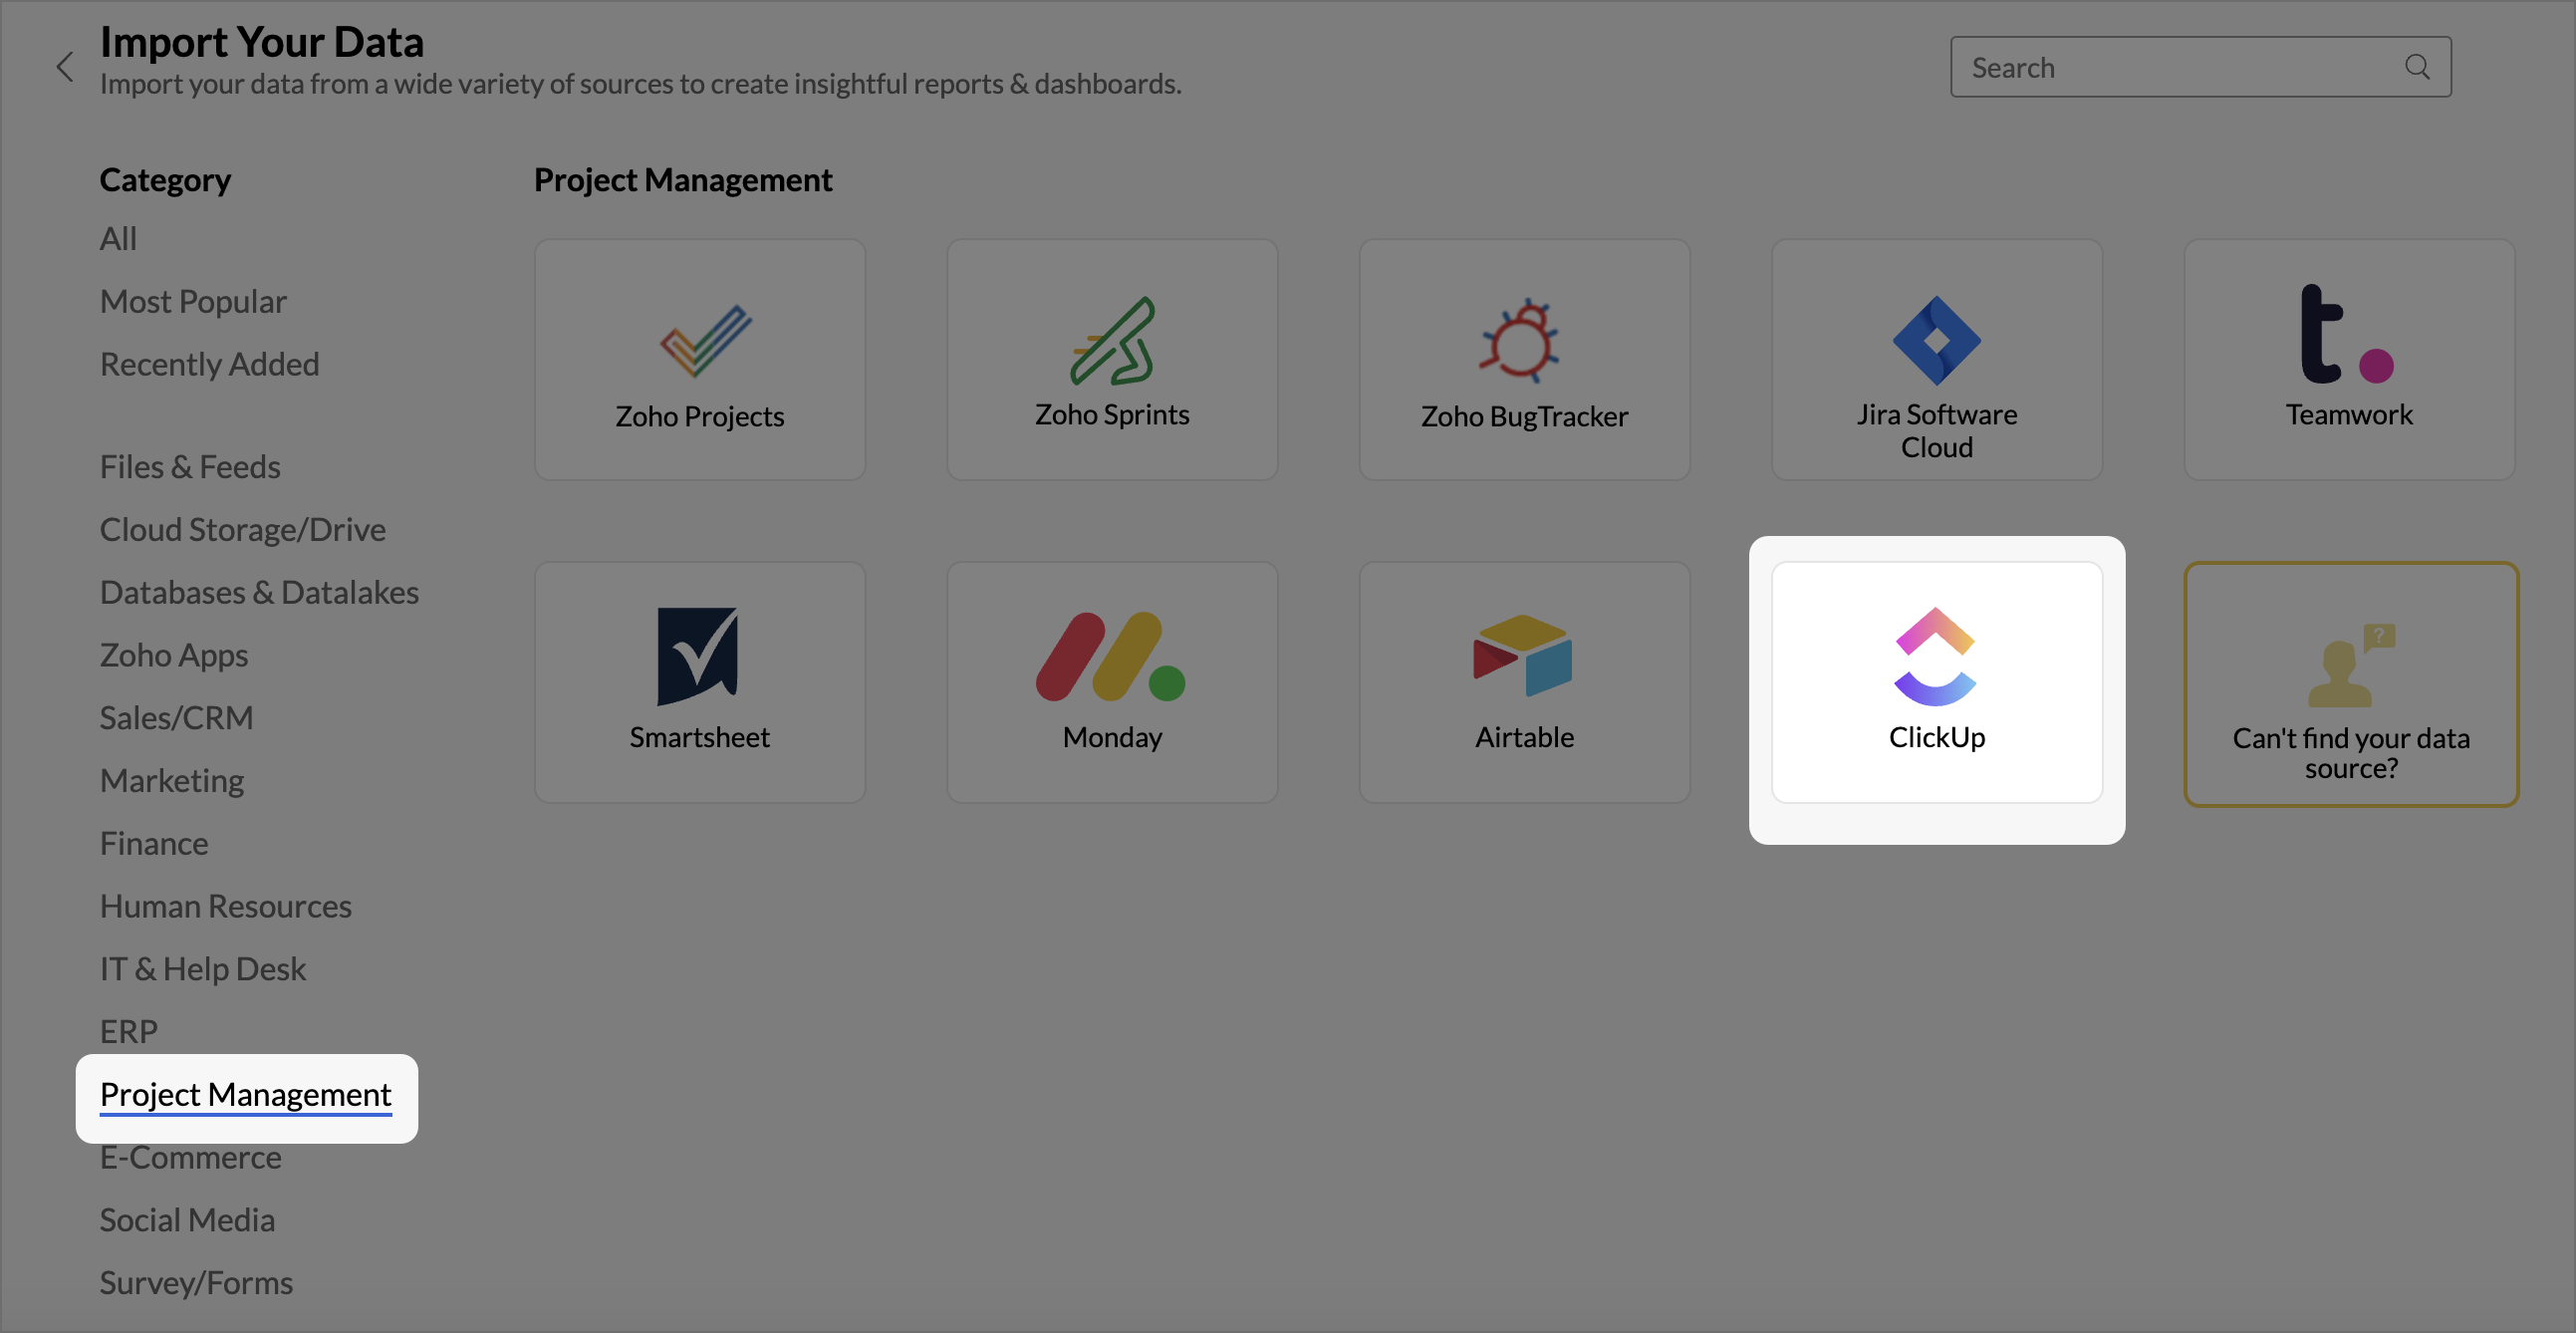
- Click Import Your Data from the Zoho Analytics home page.
- Access the Project Management tab and choose ClickUp from the listed data sources.
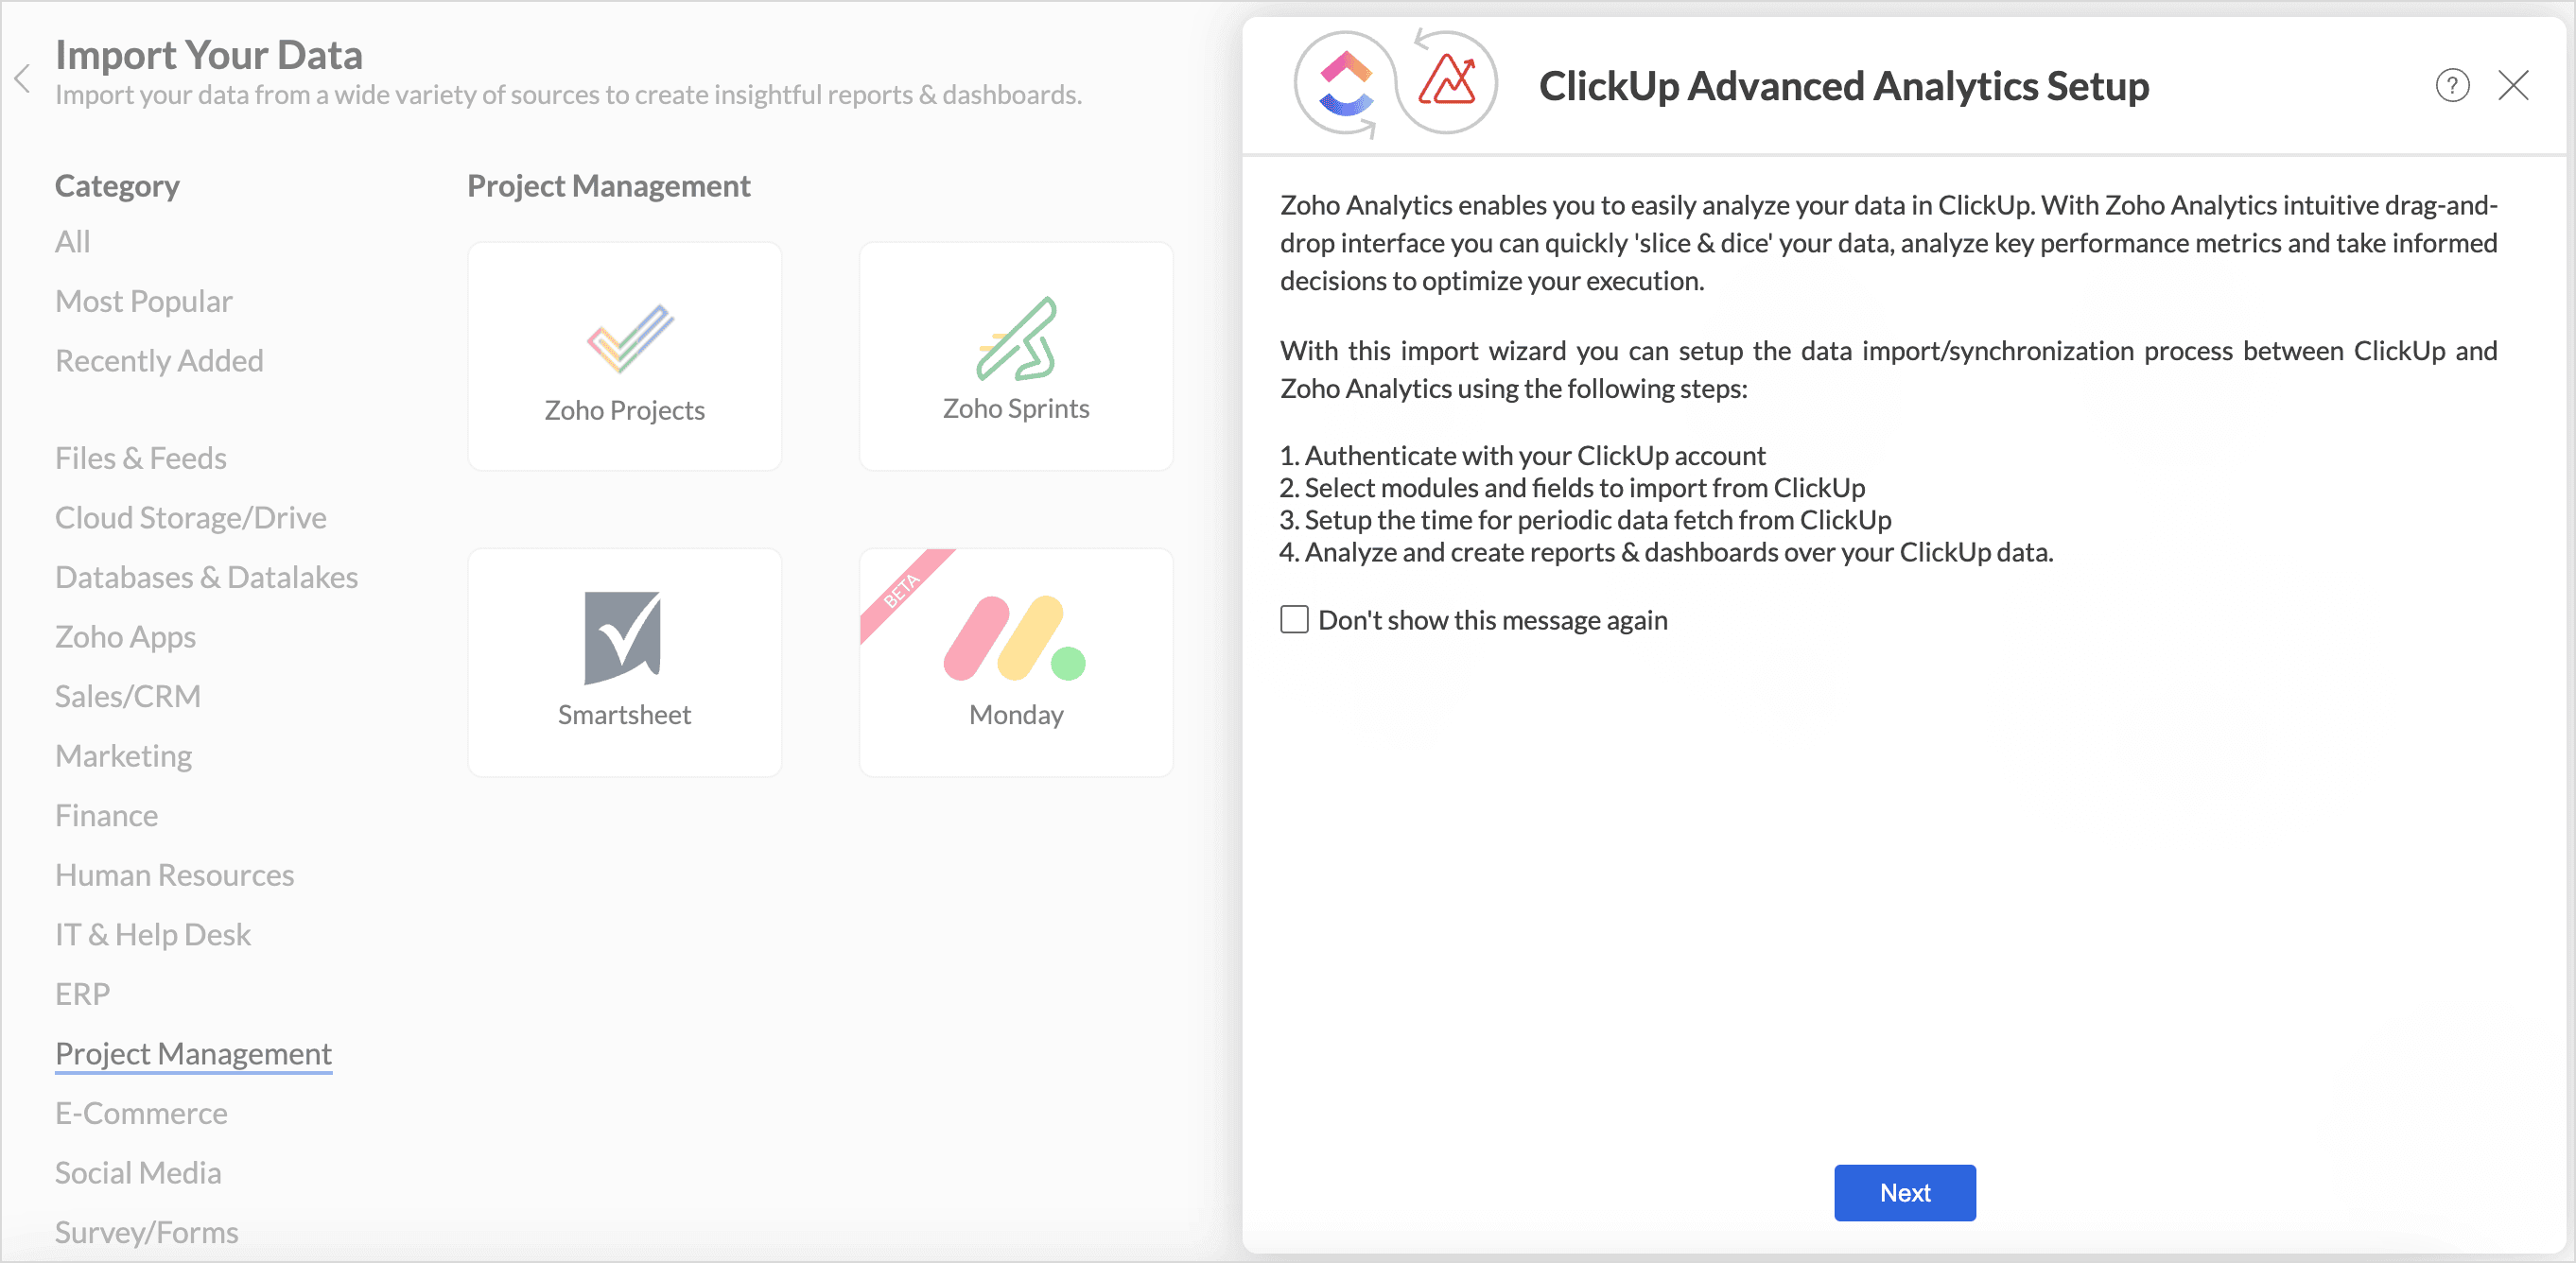
- The ClickUp Advanced Setup pane will open, Click Next.
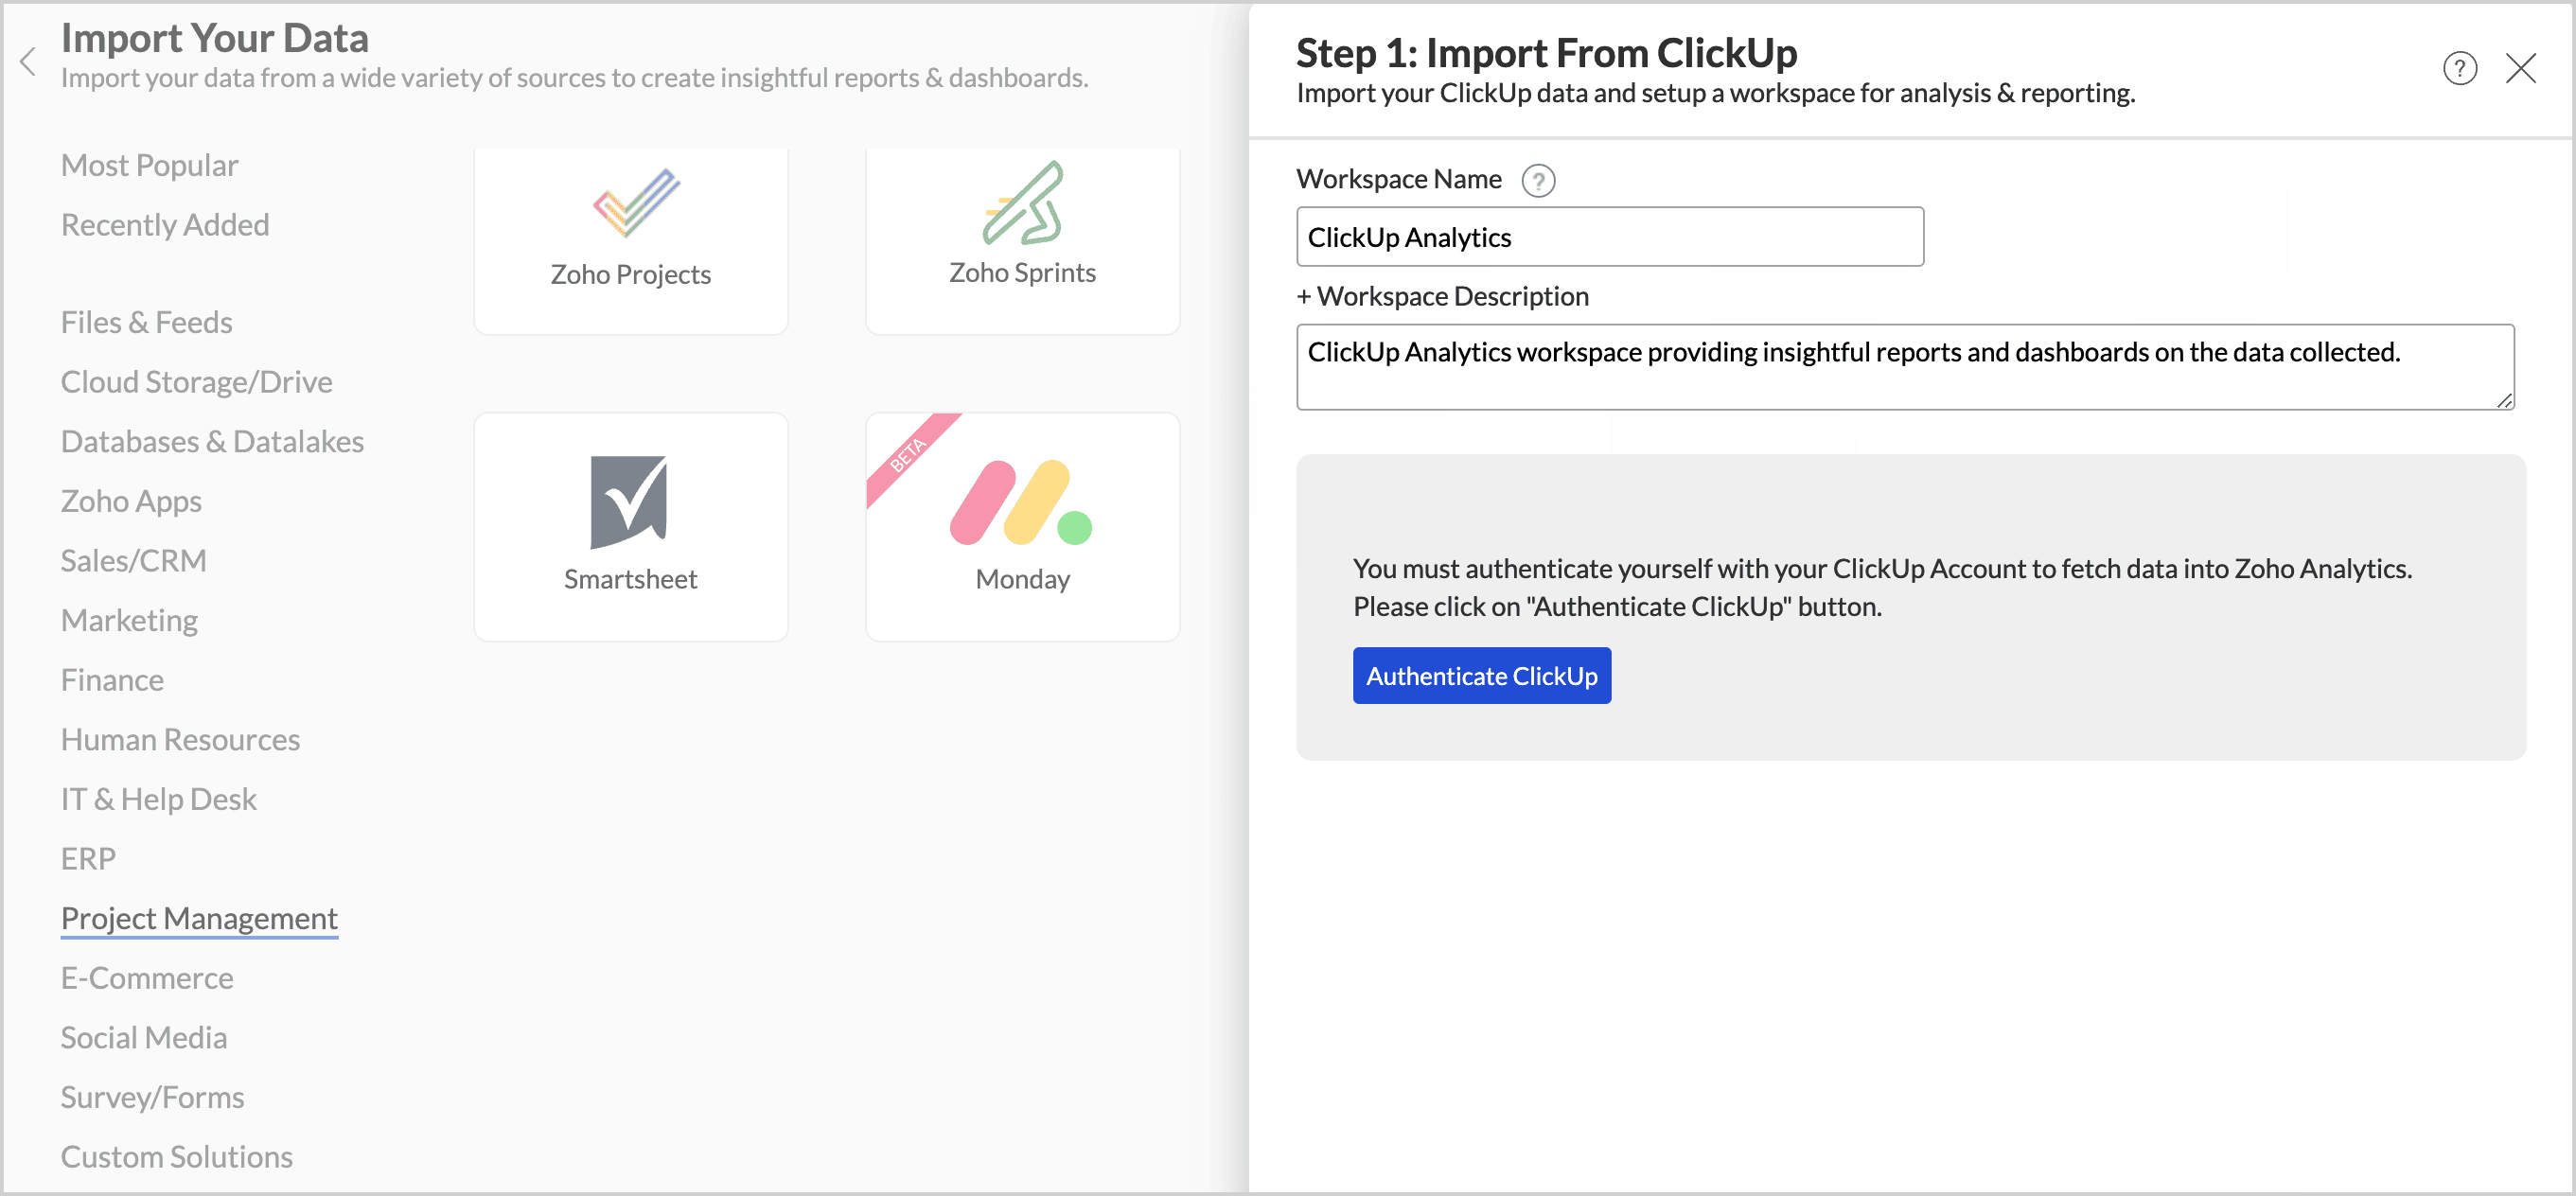
- The Import from ClickUp dialog will open, Specify the Workspace Name and additional information in the Workspace Description. Click Authenticate ClickUp.
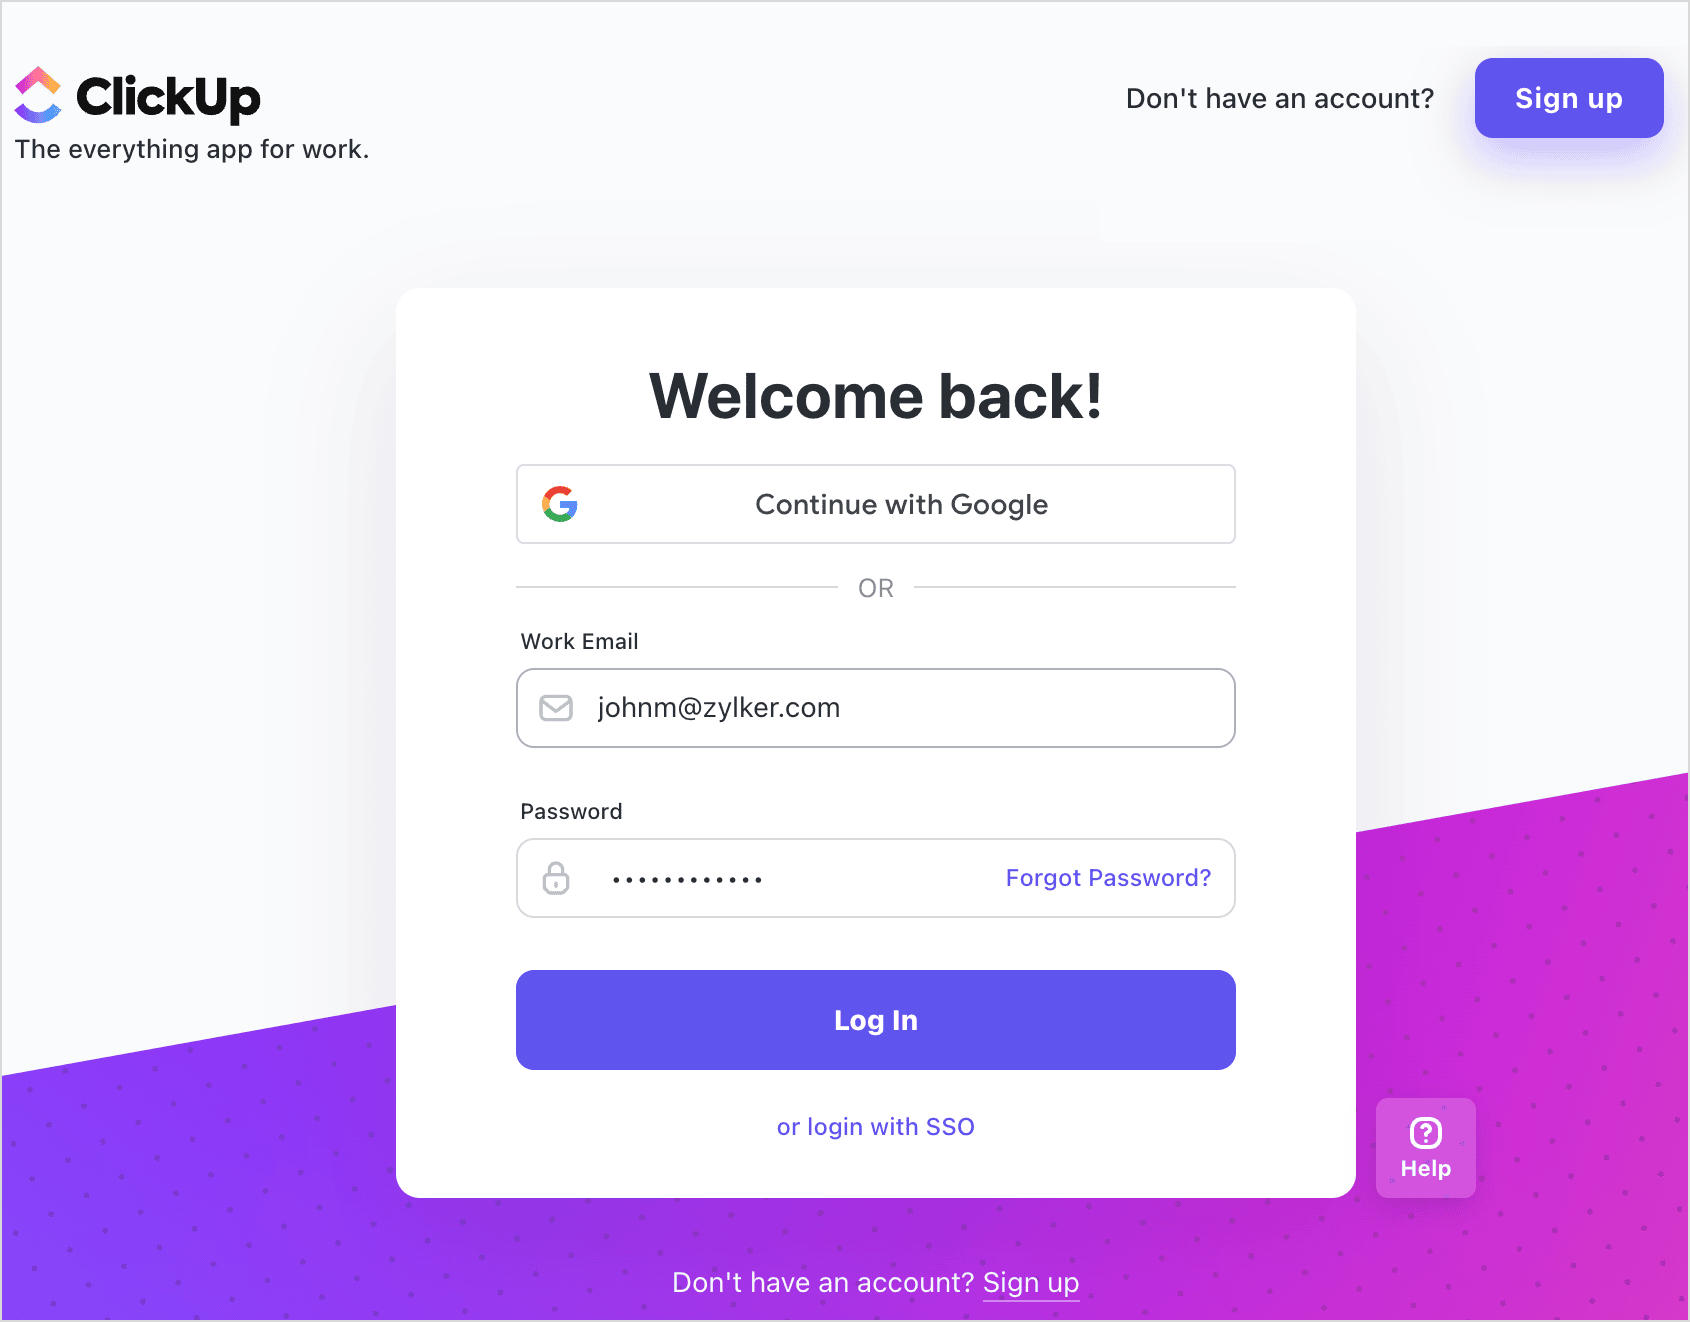
- Sign in to your ClickUp account for Zoho Analytics to verify your identity.
- Choose the ClickUp workspace from which you intent to import the data.
- Select the Spaces, Lists, Modules, and Fields from which you intend to import the data.
- Choose the Data timezone.
- In the How Often section, you can schedule the data to be imported at regular intervals. Refer to the Data Sync frequency section to learn more.
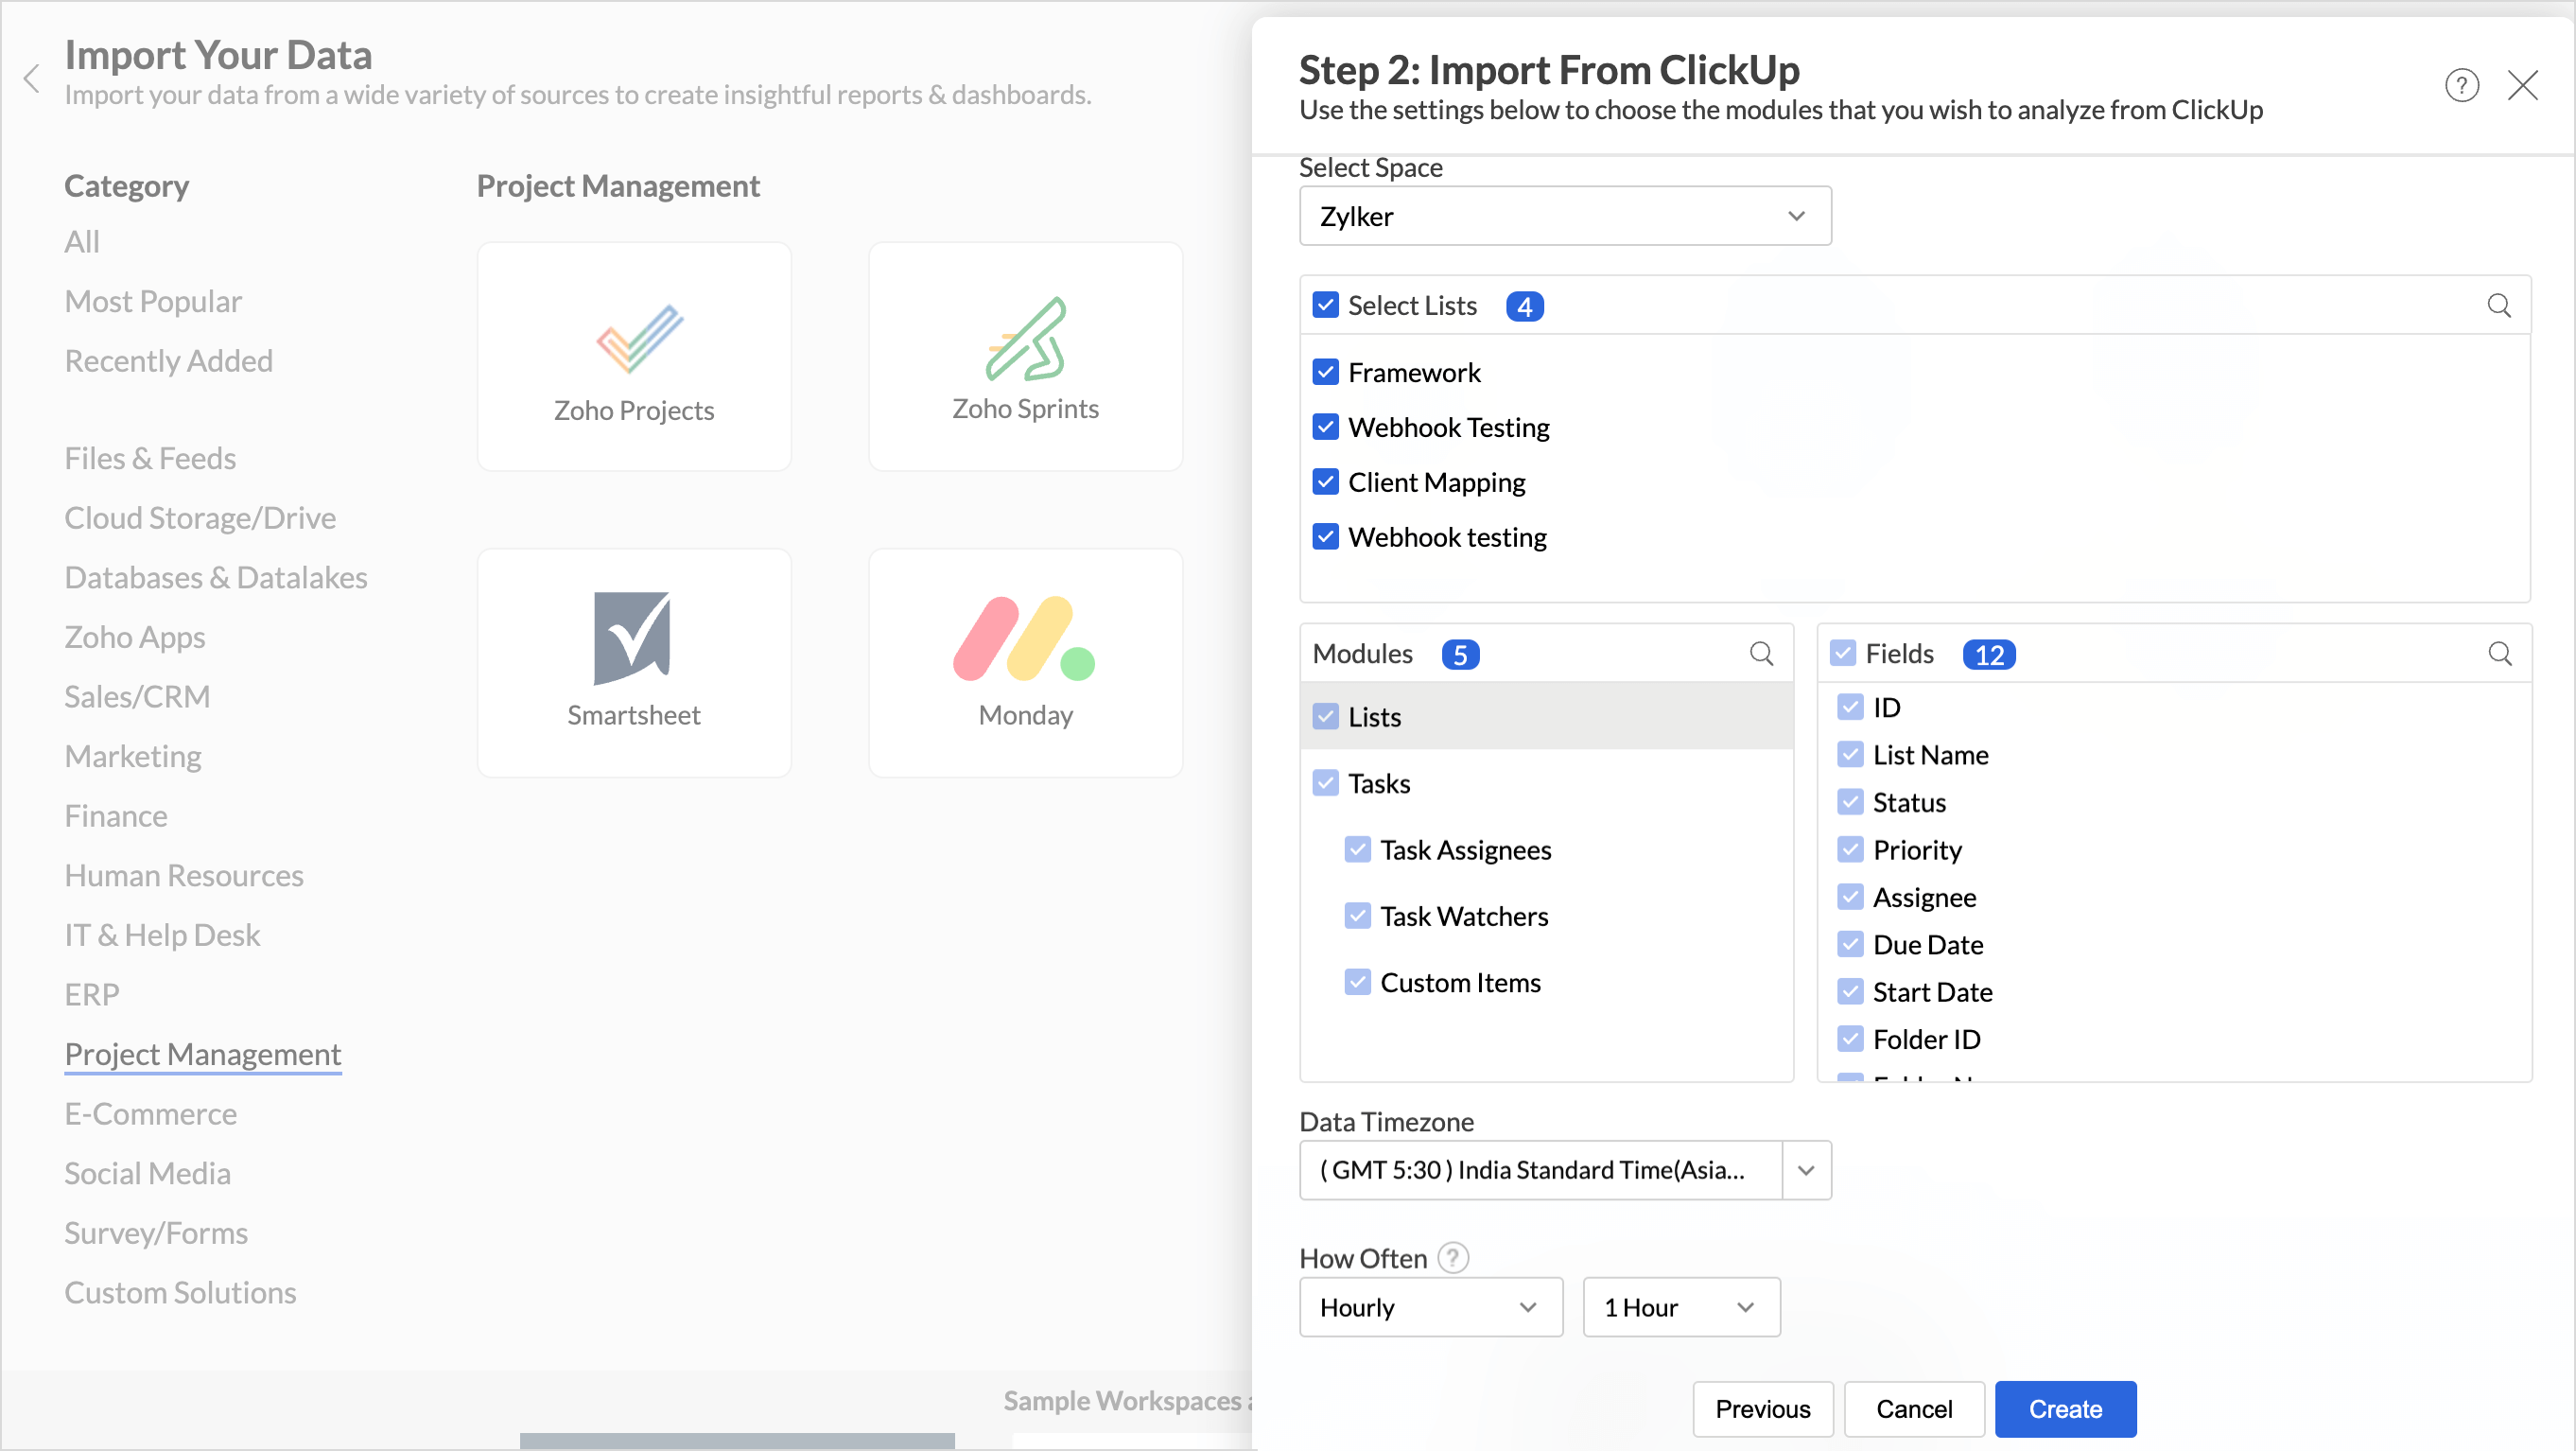
- Click Create.
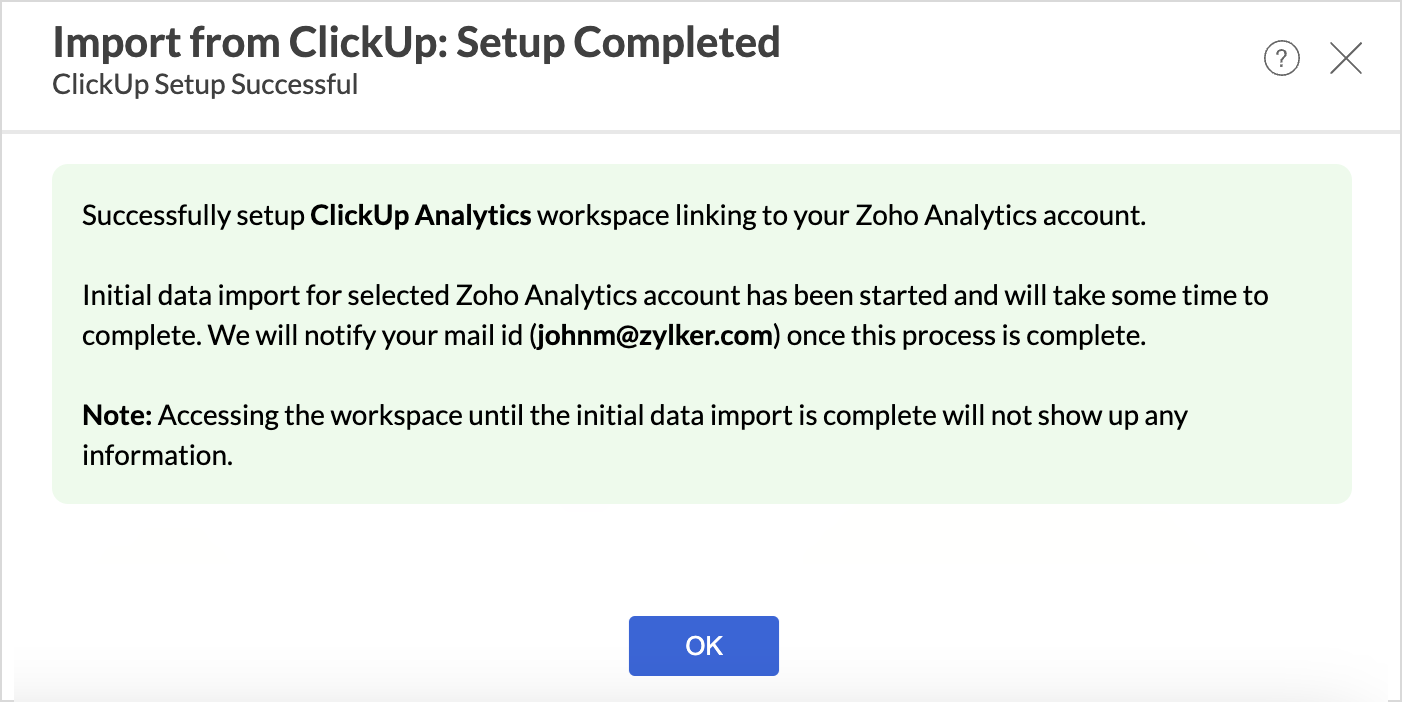
- Data import will be initiated and will take a few minutes based on the data being imported. An email and an in-app notification will be sent once the initial fetch is complete.


Data Sync Frequency
Zoho Analytics offers flexible sync schedules to ensure that your data is always up-to-date for effective analysis. These schedules allow you to automate the process of updating your data, ensuring that your analyses are based on the latest information.
- 1 Hour (Enterprise plan only)
- 3 Hours (Standard plan and above)
- 6 Hours (Standard plan and above)
- 12 Hours (Standard plan and above)
- Every day (Basic Plan and above)
Handling Data Synchronization Failure
Data synchronization can fail,
- If the Data Type of a field is changed in the ClickUp application.
- If the Modules and Fields selected for analysis are deleted in the source application.
- If the user who configured the integration no longer has permission to access the modules.
In any of the above mentioned cases, the data sync will be paused. You will be notified via email and in-app notification with the exact reason for failure along with the solution.
To resolve the sync failure, delete or restructure the views, or restore the specific modules and fields from the source application. Refer to Data Sync failure and solutions article for more details.
Once you have made the changes, click the sync now option to resume the data sync. If the issue persists, contact support@zohoanalytics.com
Manage Data Sources
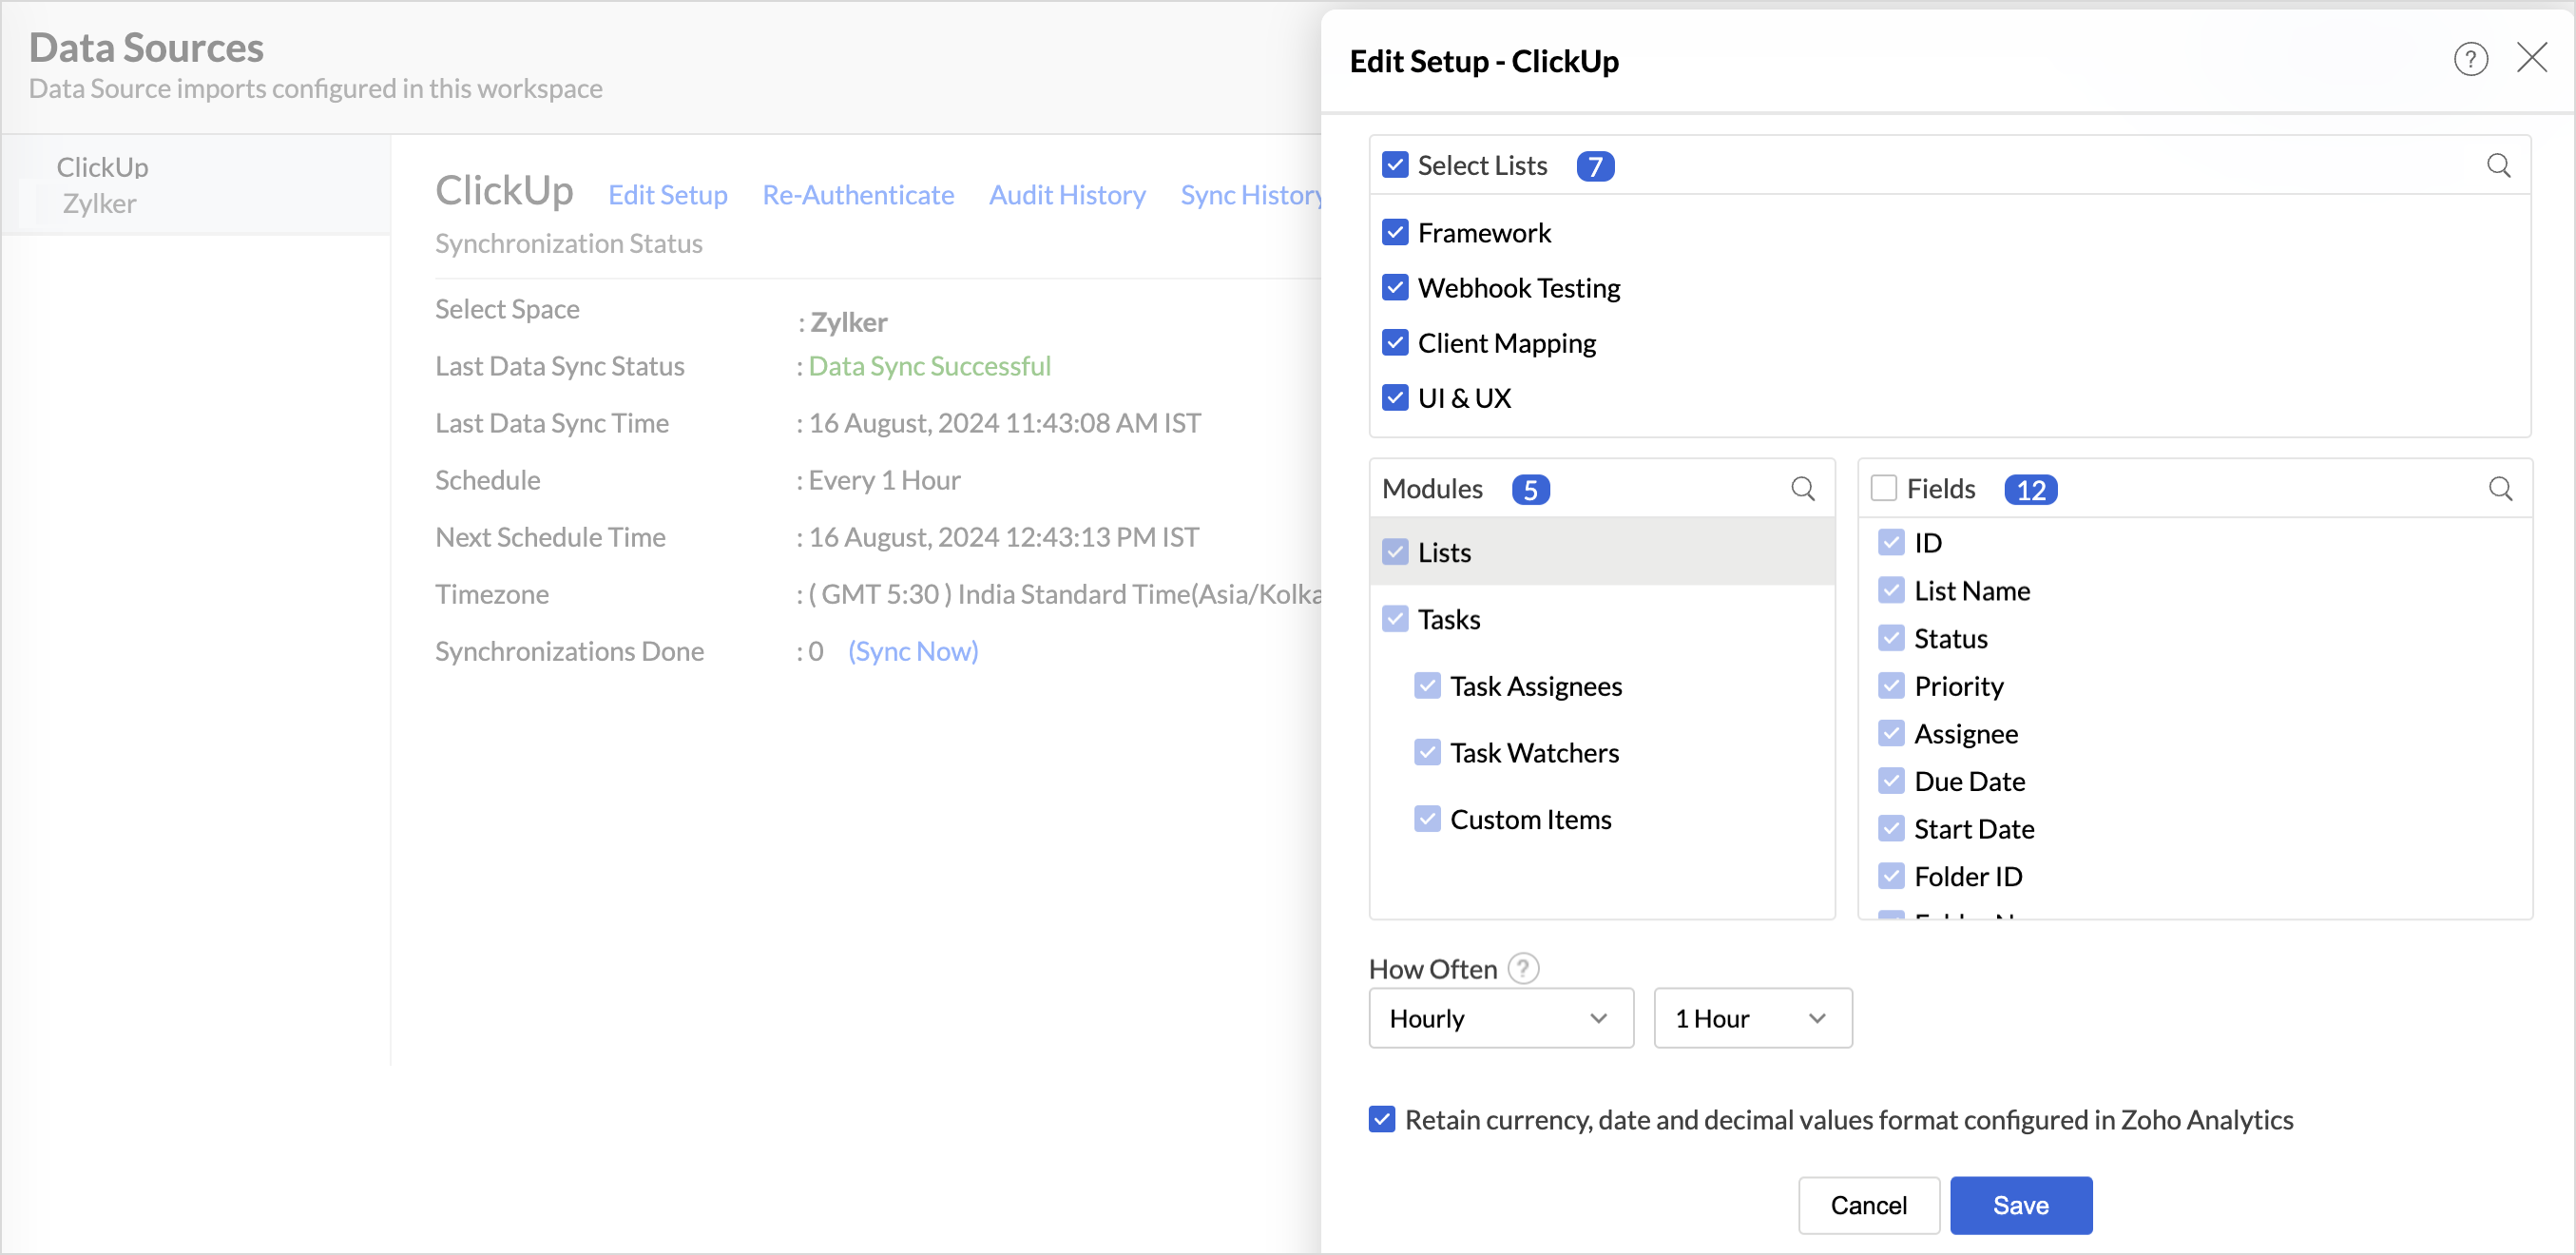
The Data Sources tab provides essential information to monitor and manage the integration setup. It also allows you to edit the settings as needed. Users with administrator privileges will be able to view and modify the connection settings.
Data Source Permalink
The Data Source permalink helps you easily access the data source tab, and this link can be pasted in dashboards to stay informed about the synchronization status.
Edit Setup
The Edit Setup tab allows you to add or delete modules or fields, change the schedule interval, and modify other settings specific to the business application.
To modify the settings,
- Click Data Sources > Edit Setup.
- The Edit Setup - ClickUp dialog will open. Modify the settings as needed and click Save.

Re-Authenticate
Re-authentication will be helpful when the API key or password is changed and also when an admin leaves or is no longer a part of the organization. In this case, the data sync will be paused, and the administrators must re-authenticate to resume the data sync.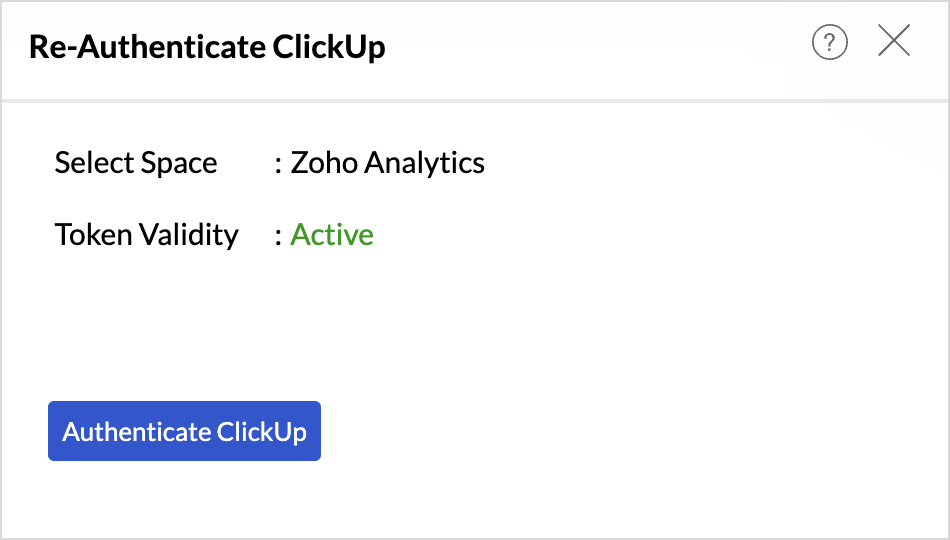
Sync History
The Sync History tab provides details about the data sync for the last 45 days. A successful data sync is marked in green, and a sync failure is marked in red.
To view the sync history,
- Click Data sources > Sync History.
- A calendar with the Sync History of the last 45 days will open. The date when the data sync has happened will be highlighted. Hover to view the number of times the data had been synced on a specific date.
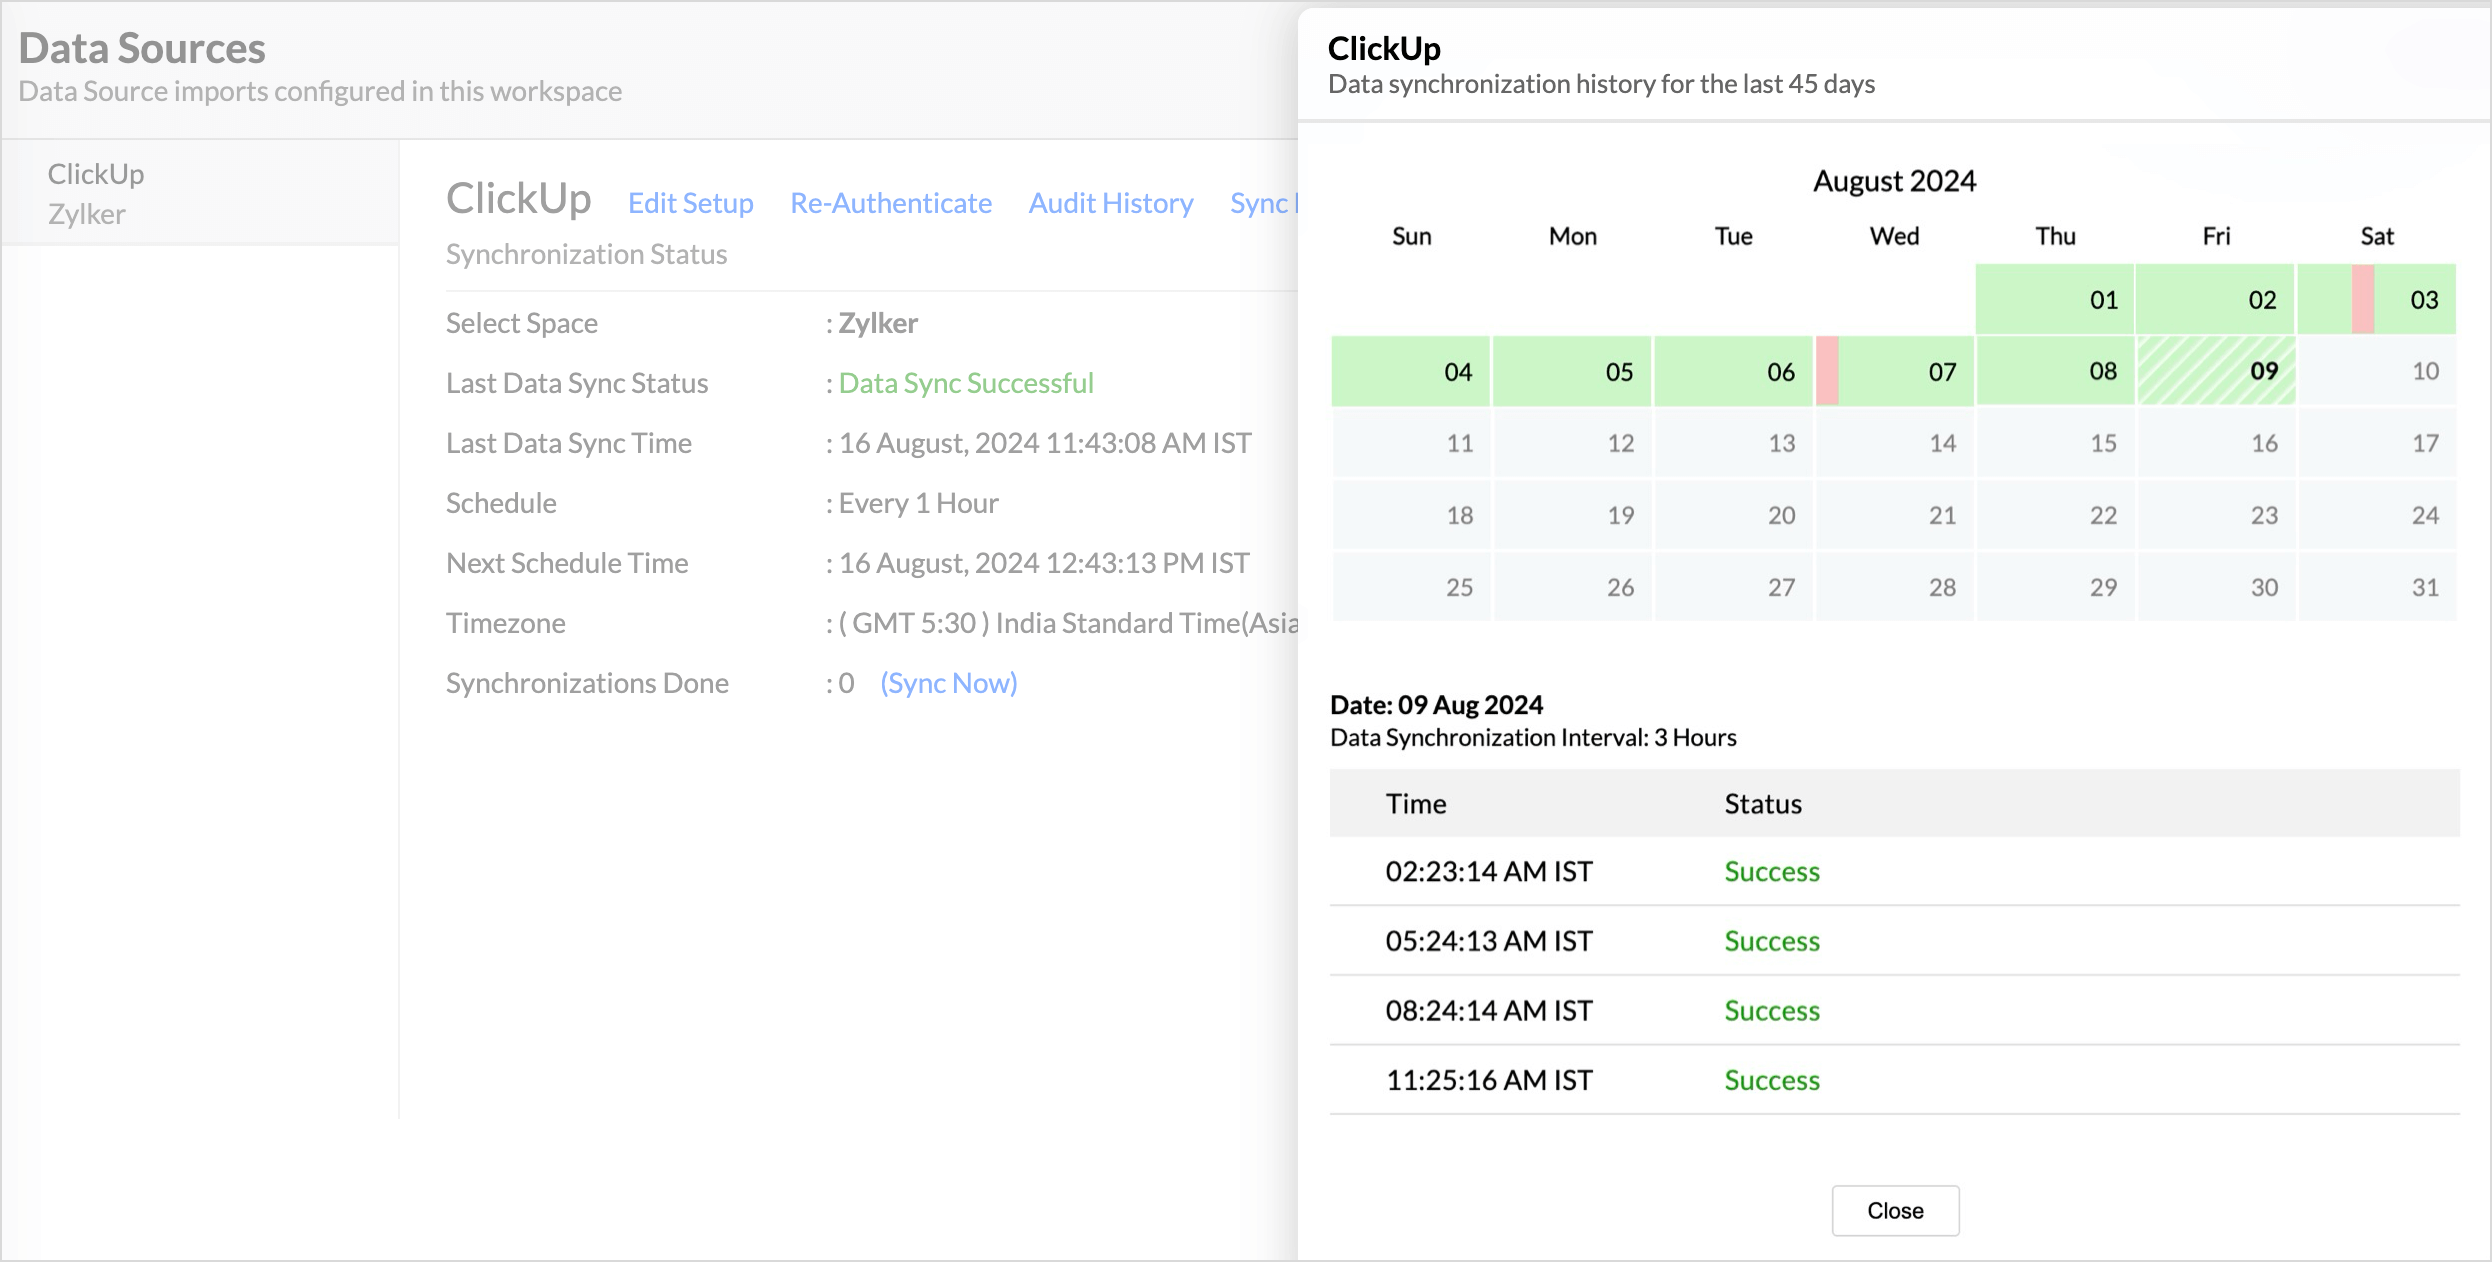
- Click the date to view more details.
- Time - Displays the time when the data is synced.
- Status - Shows whether the sync was a success or a failure.In case of failure, the reason will be displayed. Refer to this page to learn how to resolve the issue and avoid further failure.

Audit History
Zoho Analytics logs all the user activities and system events within the ClickUp workspace. The following actions that are logged in Zoho Analytics,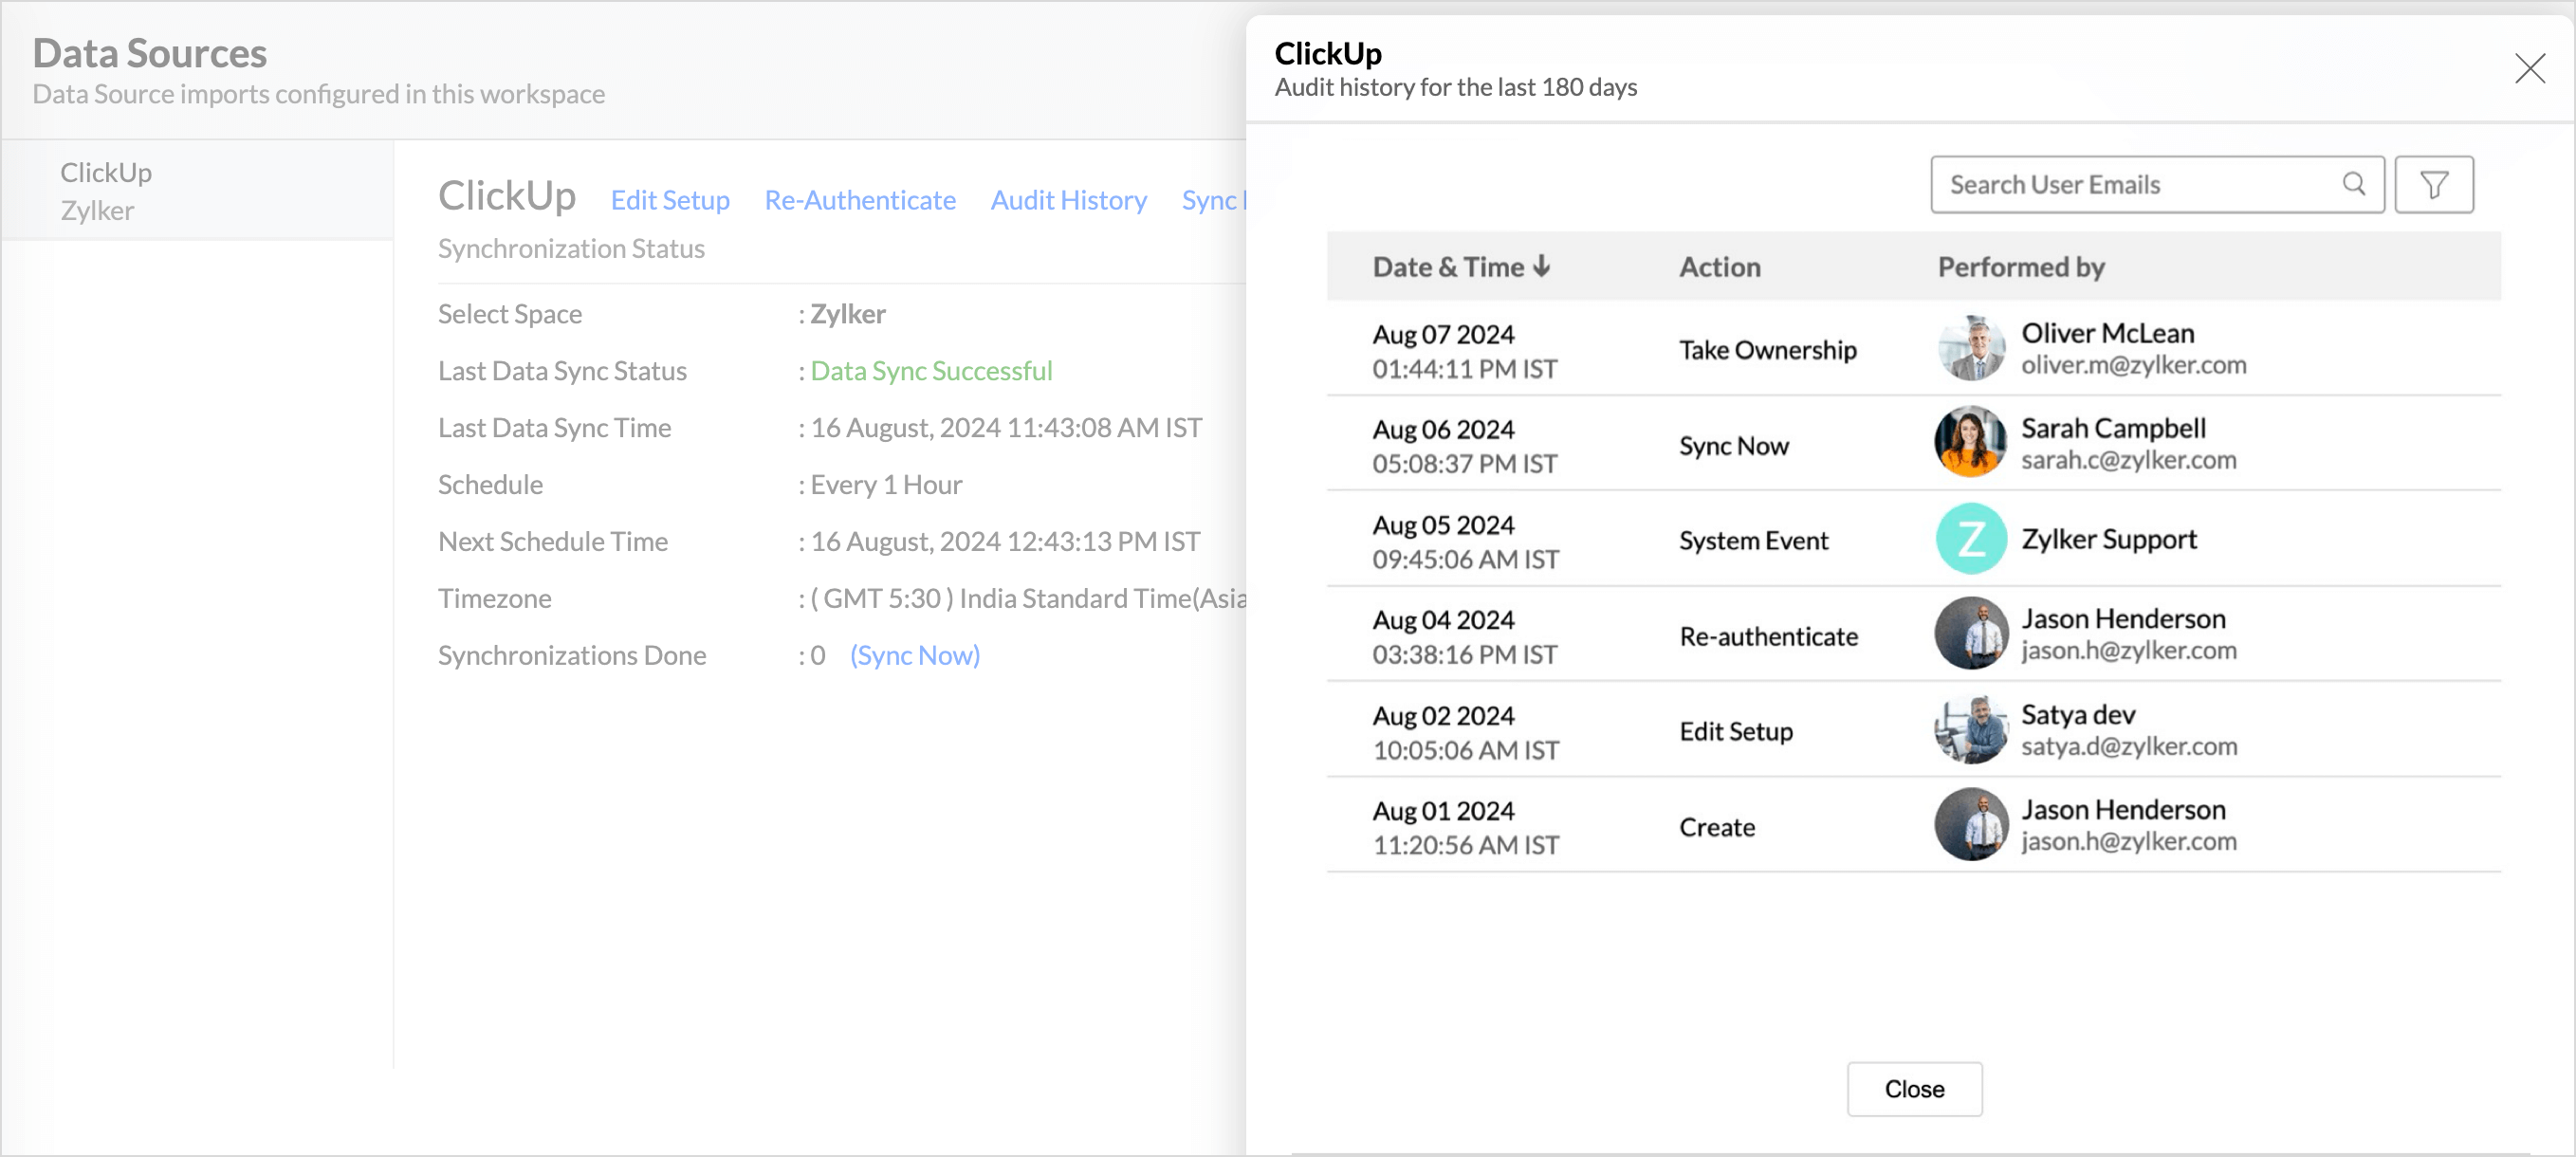
- User Action: Create, Modules Added, Modules Removed, Fields Added, Fields Removed, Schedule Change and Entities Modified, Delete, Take Ownership, Re-authenticate, Sync Now, Retry.
- System Action: Plan upgrade or downgrade.
Remove Data Source
Zoho Analytics allows you to remove the ClickUp integration if needed. Removing the integration will suspend further data synchronization. The data tables and the reports will be available.
Click the Settings icon in the Data Sources tab, and select Remove Data Source from the drop-down menu.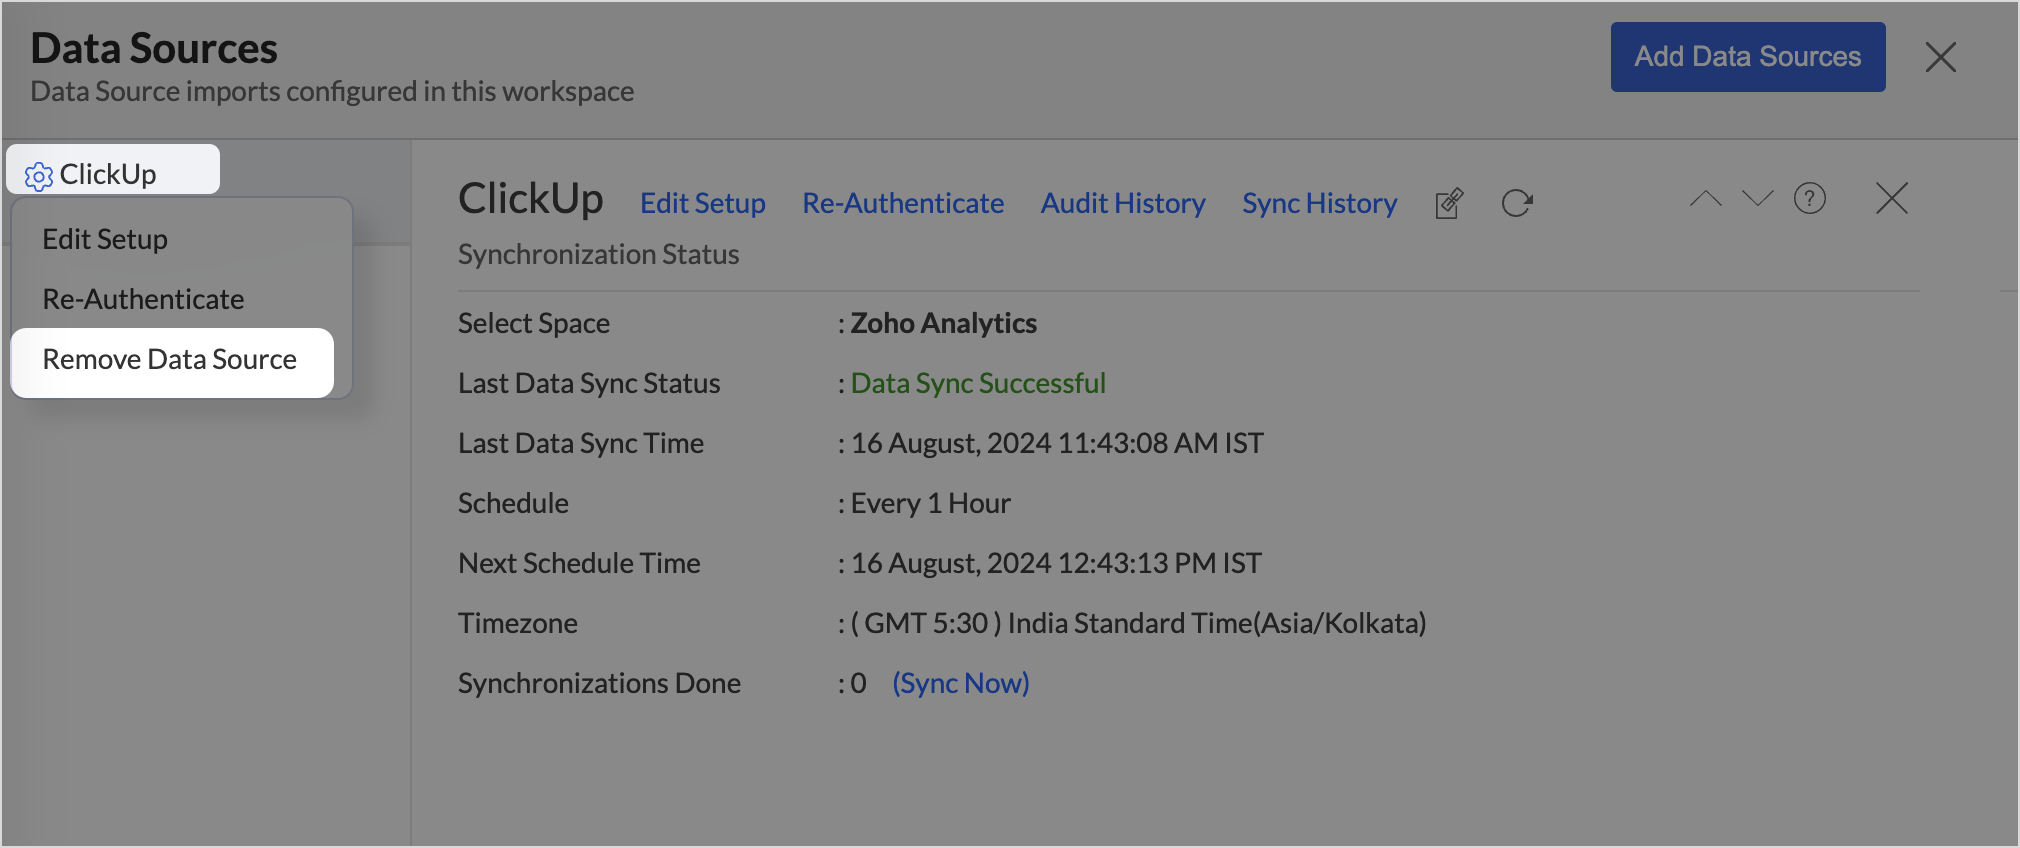
Data Modeling & Preparation
Zoho Analytics allows you to combine data from various sources such as Files, Feeds, Databases, and business applications for in-depth analysis. Query Tables allow you to combine data from different tables to create reports. The SQL Query Suggester helps to build complex queries.
Zoho Analytics auto identifies similar columns and provides suggestions for lookup while importing. Click here to learn more about joining tables.
Data Visualization
Zoho Analytics offers a wide range of visualization types to conduct your analysis. Refer to the Creating Reports article to learn more. The below table lists the range of visualizations supported in Zoho Analytics.
| Visualization | Types |
Bar | Stacked bar, Histogram, Horizontal bar |
Stacked Bar | Horizontal Stacked bar, 100% vertical and horizontal stacked bar |
Area | Area with markers, Smooth Area, Smooth area with Markers |
Line and Bar Combination chart | Bar with Line, Bar with Bubble, Bar with Scatter, Bar with Area, Area with Bubble, Line with Bubble and Custom Combination |
Bubble Chart | Bubble Pie, Packed Bubble, Word Cloud |
Stacked Area | Stacked area with markers, Smooth stacked area, Smooth stacked area with markers |
Map | Heat Map, Map Scatter, Map Bubble, Map Pie, Map Bubble Pie, Map Filled, Geo Heat Map |
Pie | Pie, Ring, Semi Pie, Semi Ring |
Tree map | Standard Tree Map |
| Sankey | Standard sankey chart and Alluvial chart |
Sunburst | Standard sunburst chart |
Race Chart | Racing bar, Racing line and Racing bubble |
| Conversion Bar Chart | Standard conversion bar |
| Sparkline chart | Bar, line and area |
Doughnut | Default View |
Matrix View | Pivot table |
Tabular | Summary and Tabular view |
Dashboards and KPI widgets | Single Numeric Widget, Dial Chart Widget Bullet, Chart Widget |
Sharing and Collaboration
- Use fine-grained permission control over your shared data and reports, while collaborating with your colleagues & friends.
- Efficiently collaborate with your users by setting up real-time commenting on a shared view.
- Publish reports for wider consumption. Embed reports/dashboards within your websites, web applications, and blogs.
- Export, email, and print reports in a variety of formats.
- Use Zoho Analytics mobile apps (optimized for both IOS and Android platform) and access data, reports, and dashboards on the go.
Help & Support
We offer 24x5 technical support (Monday to Friday). In case if you need our assistance kindly do mail us your questions to support@zohoanalytics.com.
You can also reach out to us on our toll-free numbers.
United States: +1 (888) 900 9646
United Kingdom: +44 (20) 35647890
Australia: +61-2-80662898
India: +91 44 6965 6060