


Announcing Zoho Analytics 6.0 (Beta)
We are delighted to open up the next major version, Zoho Analytics 6.0 Beta! The new version comes packed with a wide range of functionalities for all persona, namely business users, data analysts, data engineers, and data scientists. Zoho Analytics team has meticulously developed these functionalities with a focus on current and future business needs, incorporating valuable user & market feedback.

New capabilities in Zoho Analytics 6.0 Beta includes more data connectors, new visualizations, new interactions, advanced analytical models ,the ability to build custom ML models, and 60+ features.
On this page
- Data Connectors & Data Management
- Visual Analytics
- Advanced Data Analytics
- Build your ML Models with AutoML & Code Studio
- Data Storytelling
- More Enhancements
1. Data Connectors & Data Management
New Connectors
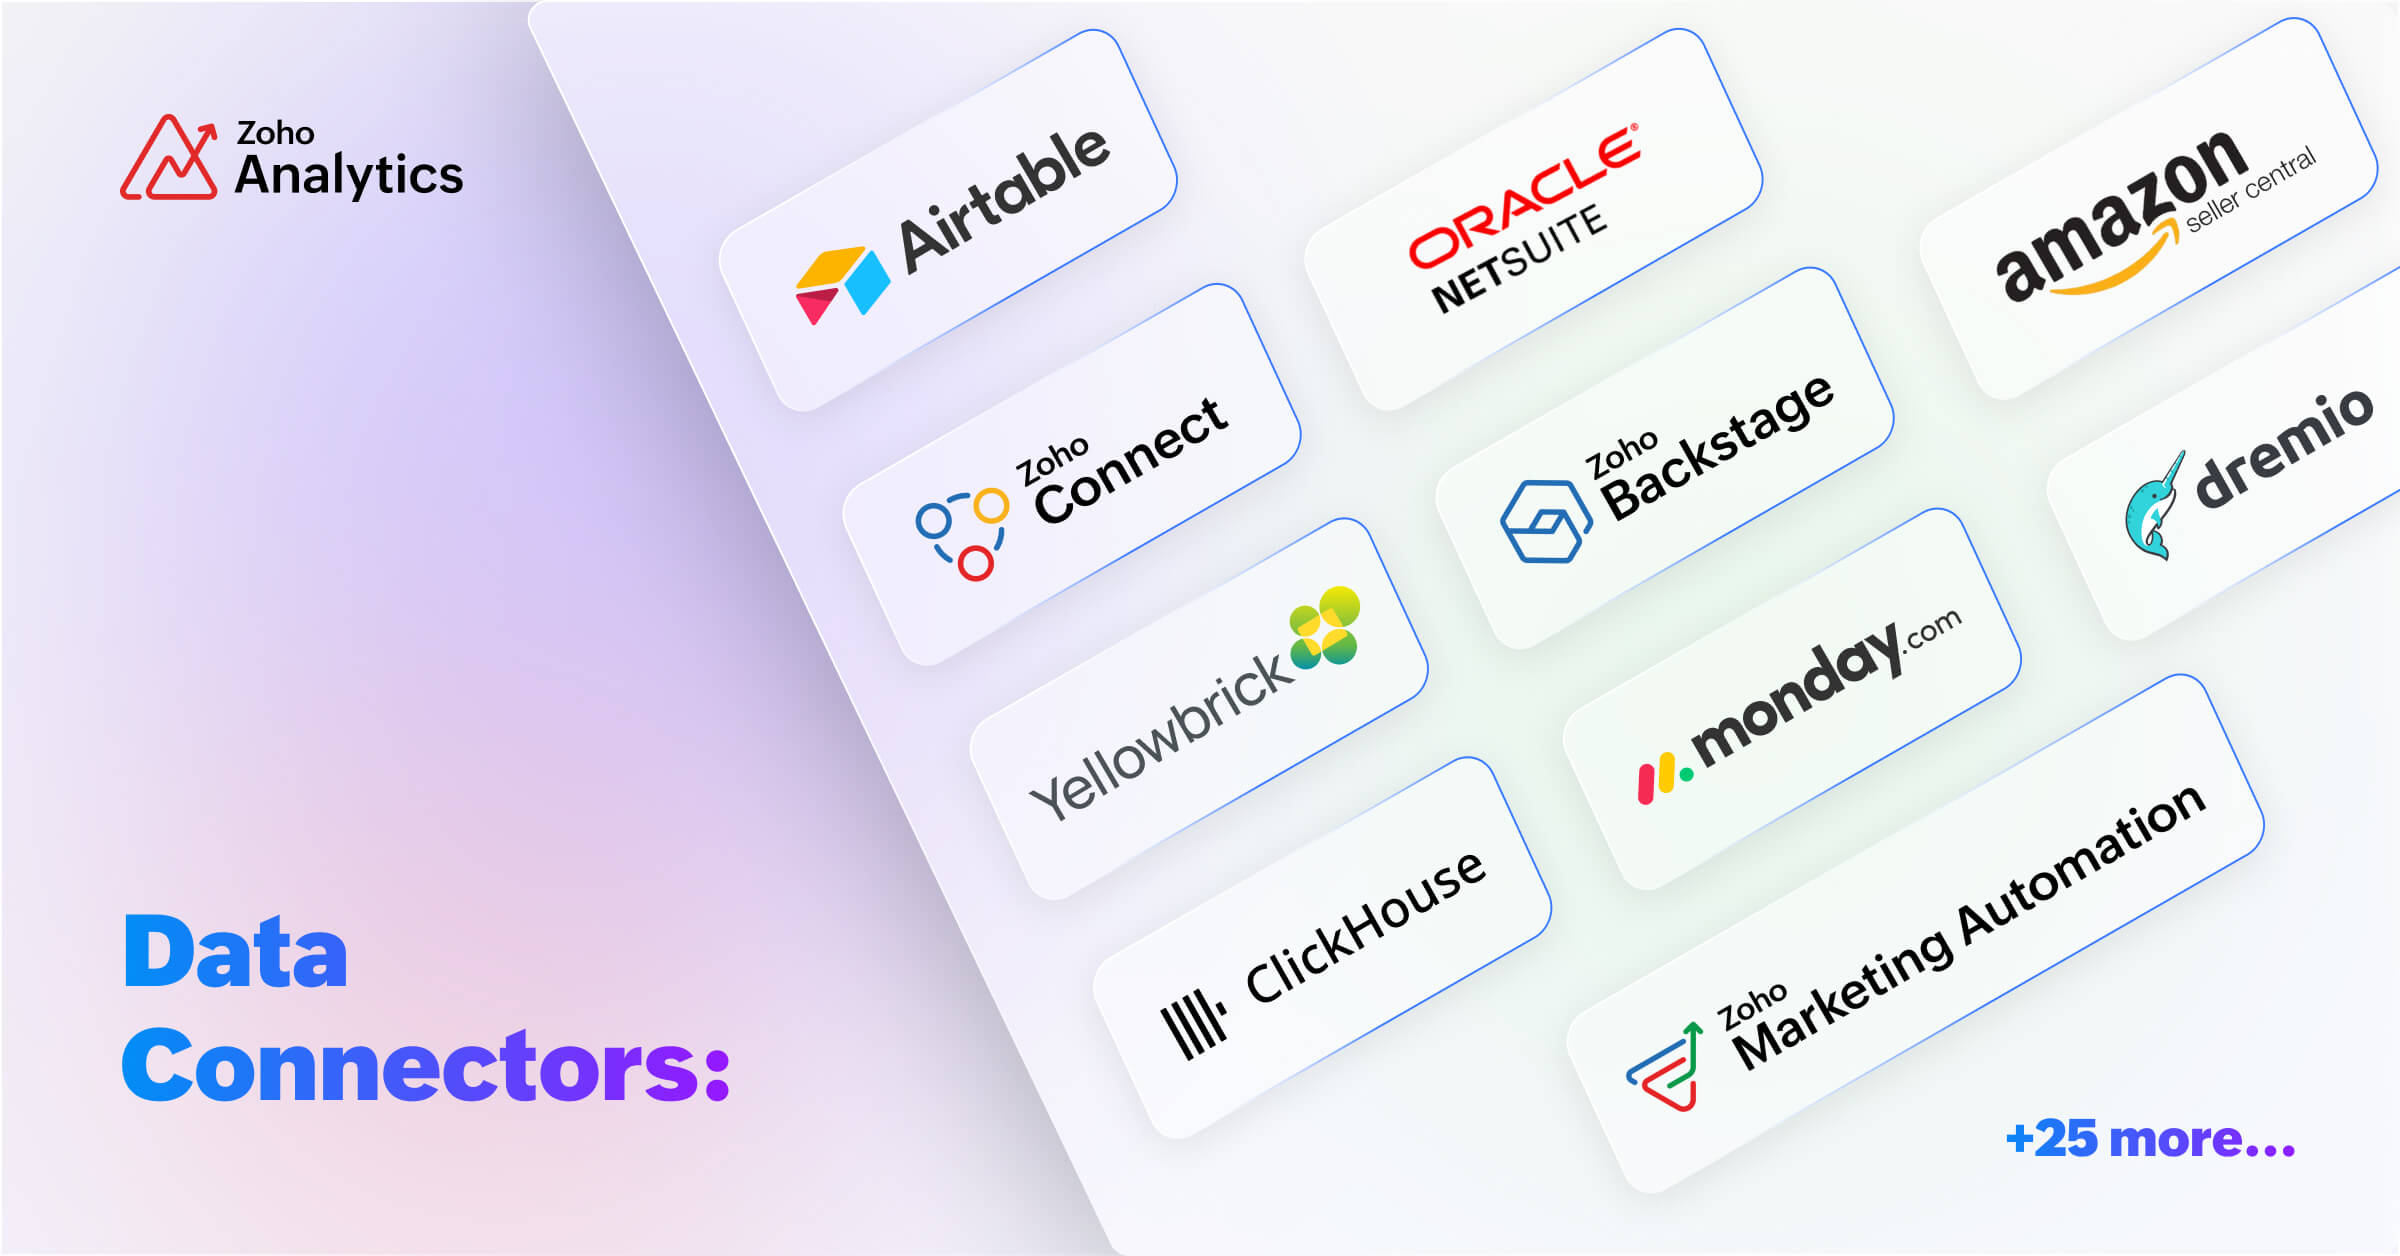
We are expanding our already available 500+ data connectors with 25+ new connectors for big data platforms and business applications that includes Yellowbricks, ClickHouse, Dremio, Zoho Connect, Zoho Marketing Automation, Zoho Backstage, Amazon Seller Central, Airtable and many more.
Also, managing data has now become easier with the following features -- Audit history, Sync history, and Import roll back. These capabilities are available for all data sources in Zoho Analytics.
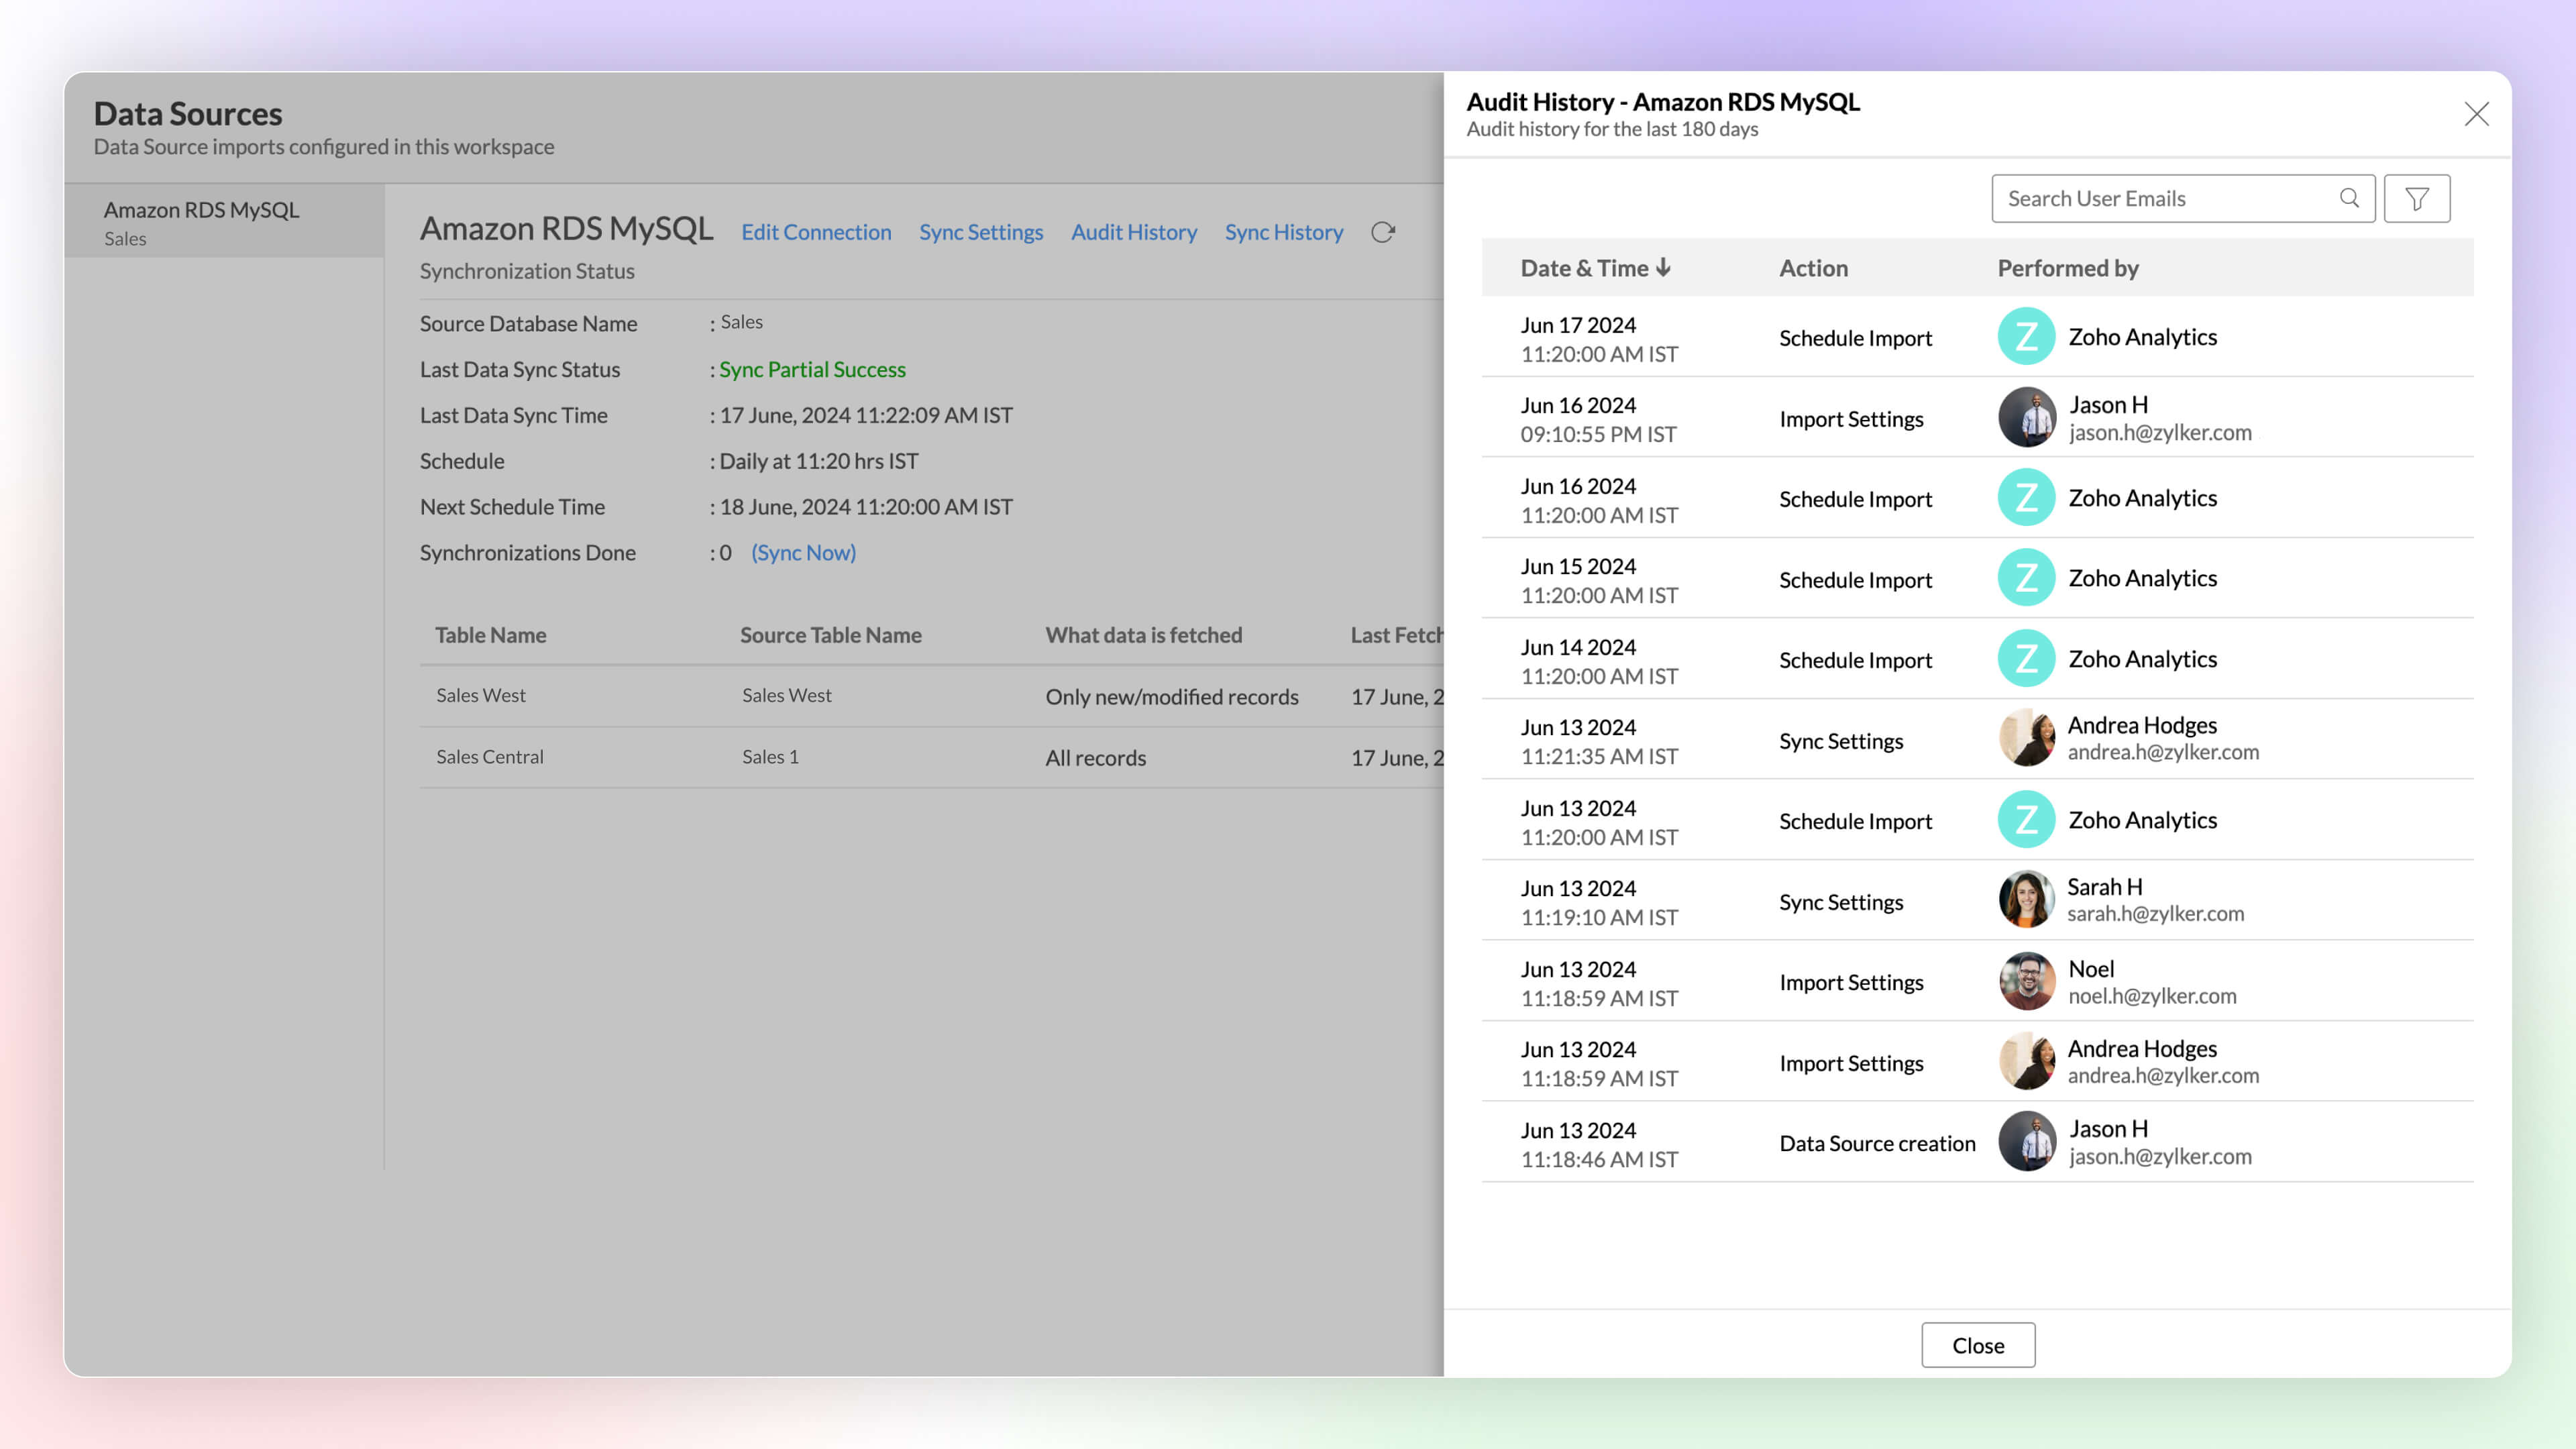
Audit History
Audit logs are crucial for maintaining security and troubleshooting issues. They provide a comprehensive record of user and system actions, including details of the time when the action occurred and information about the administrator who performed the action.
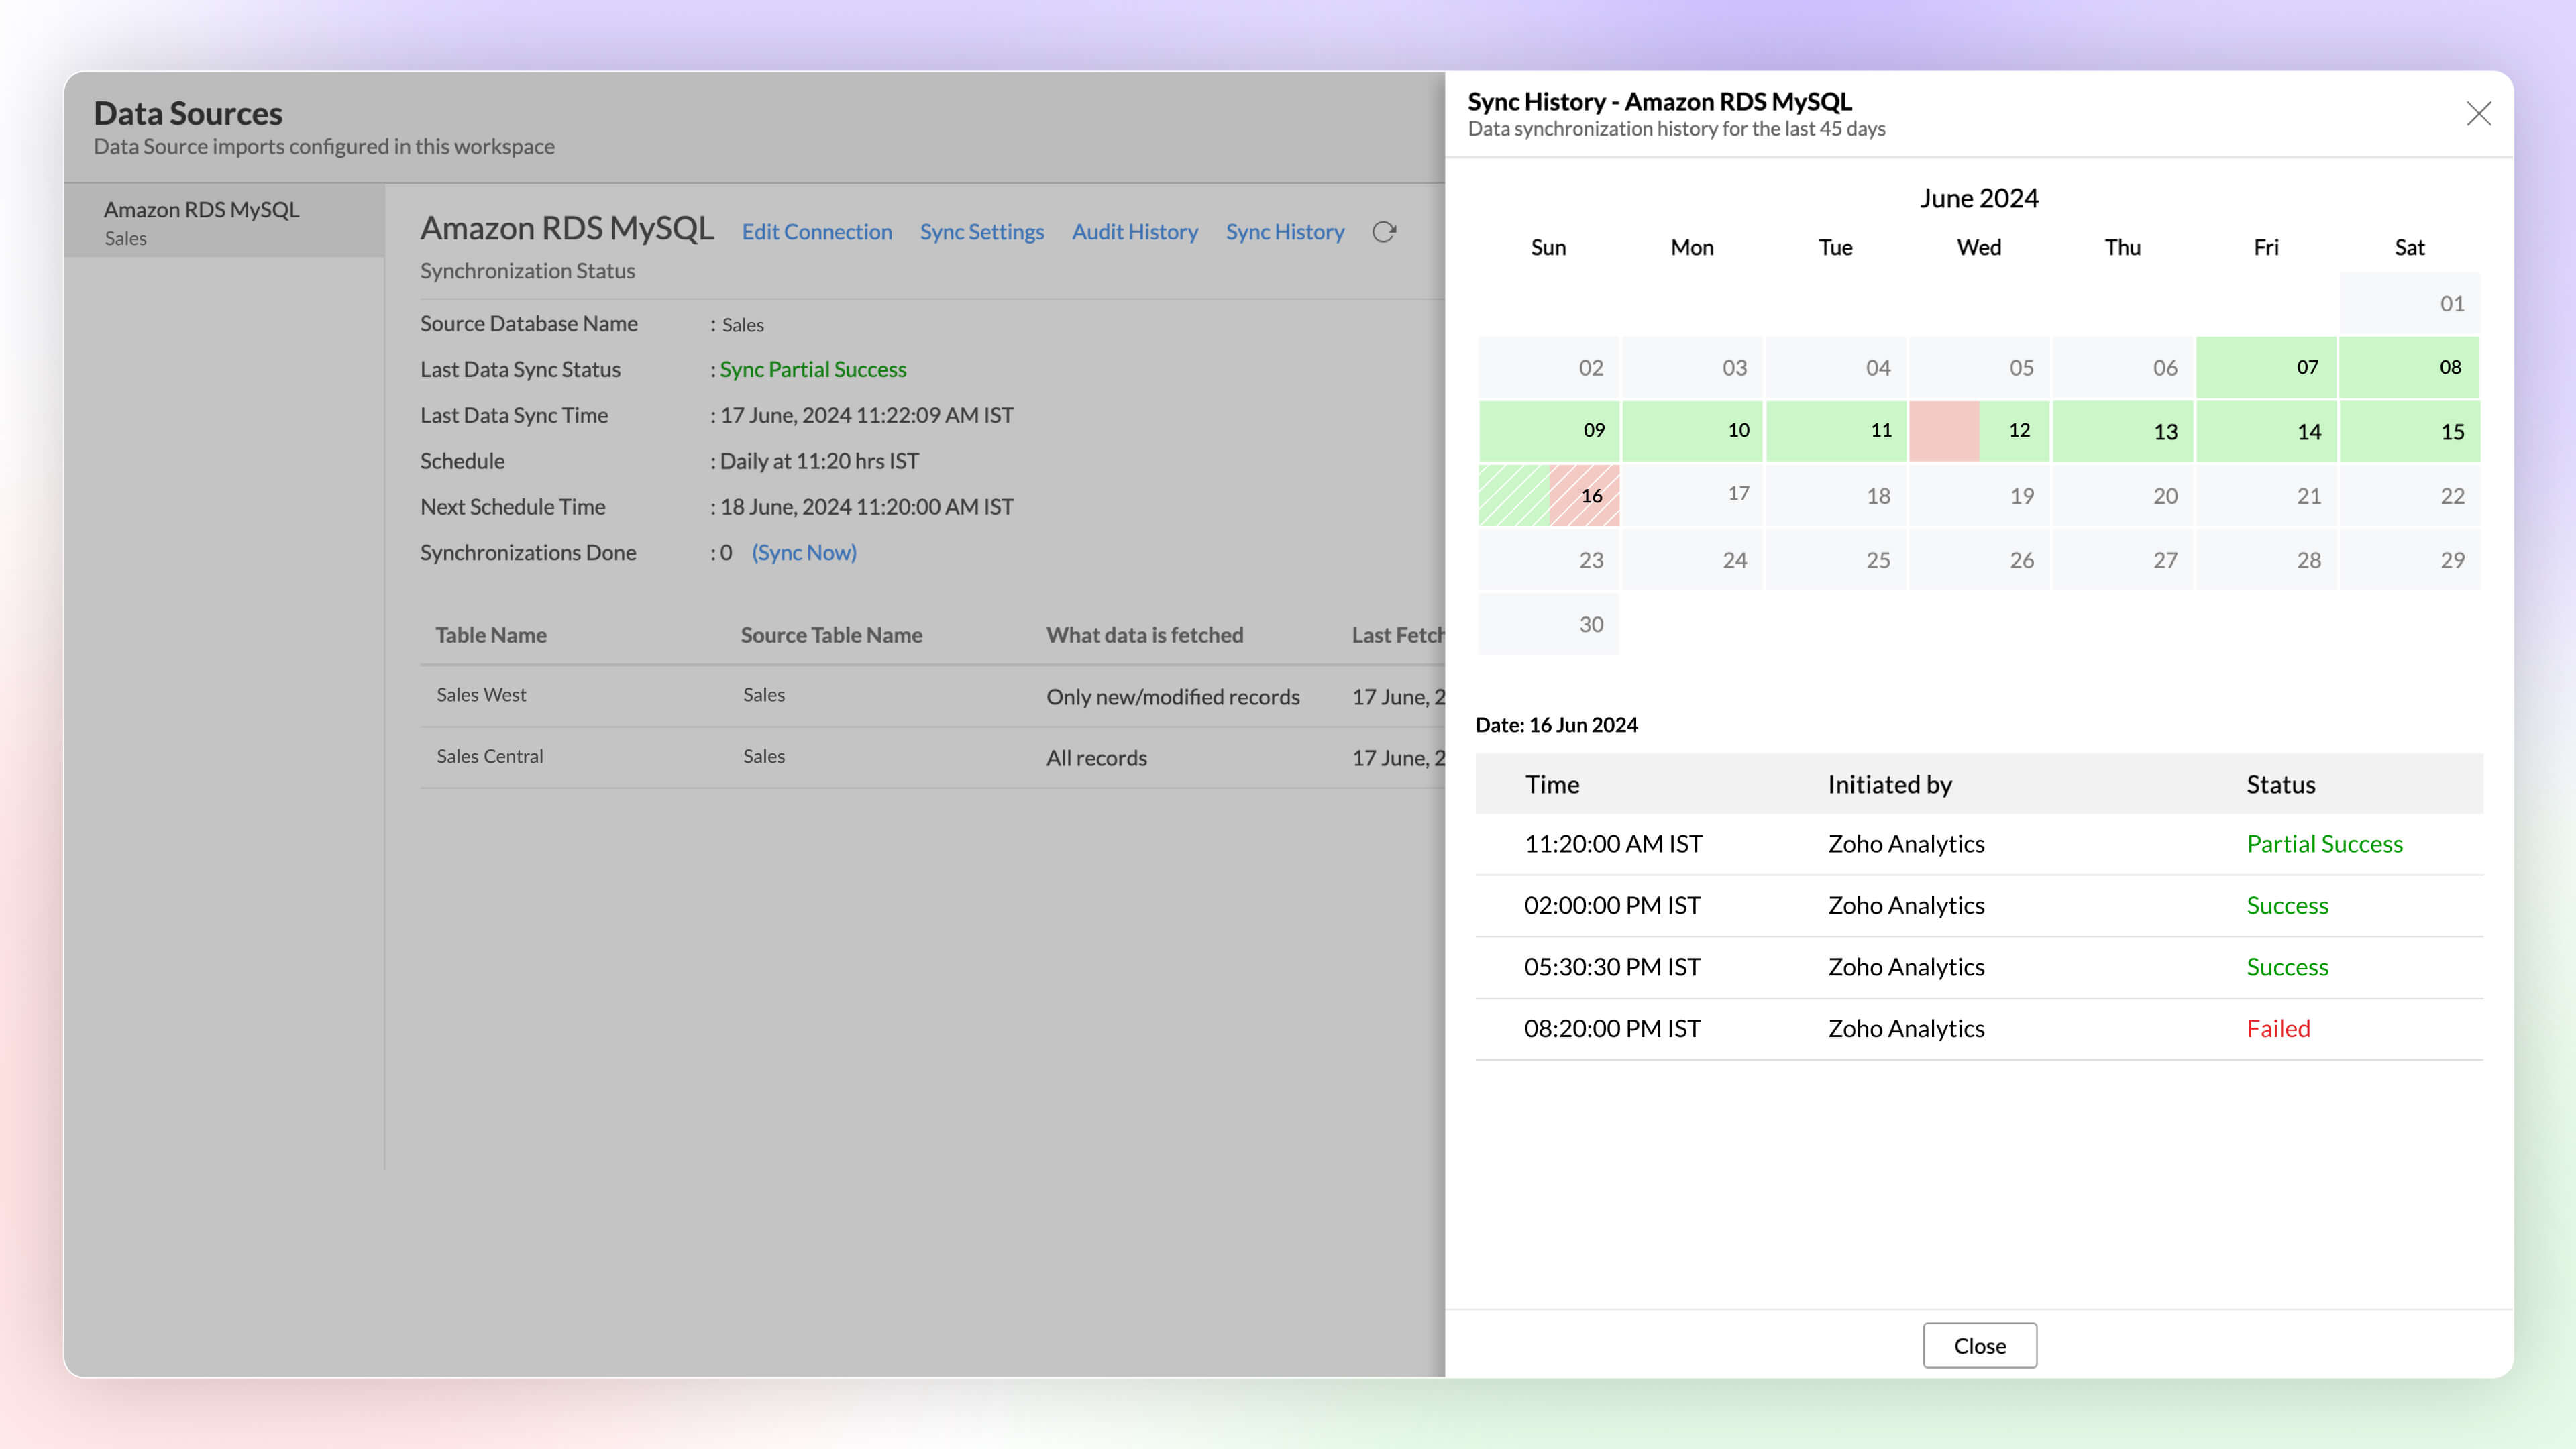
Sync History
Sync history provides a detailed record of data synchronization activities, making it easy for the administrators to track the status of each data sync. The sync operations are color-coded for immediate recognition. Successful data syncs are indicated in green, and failed data syncs are marked in red with the reasons for failure along with the necessary action to be taken.
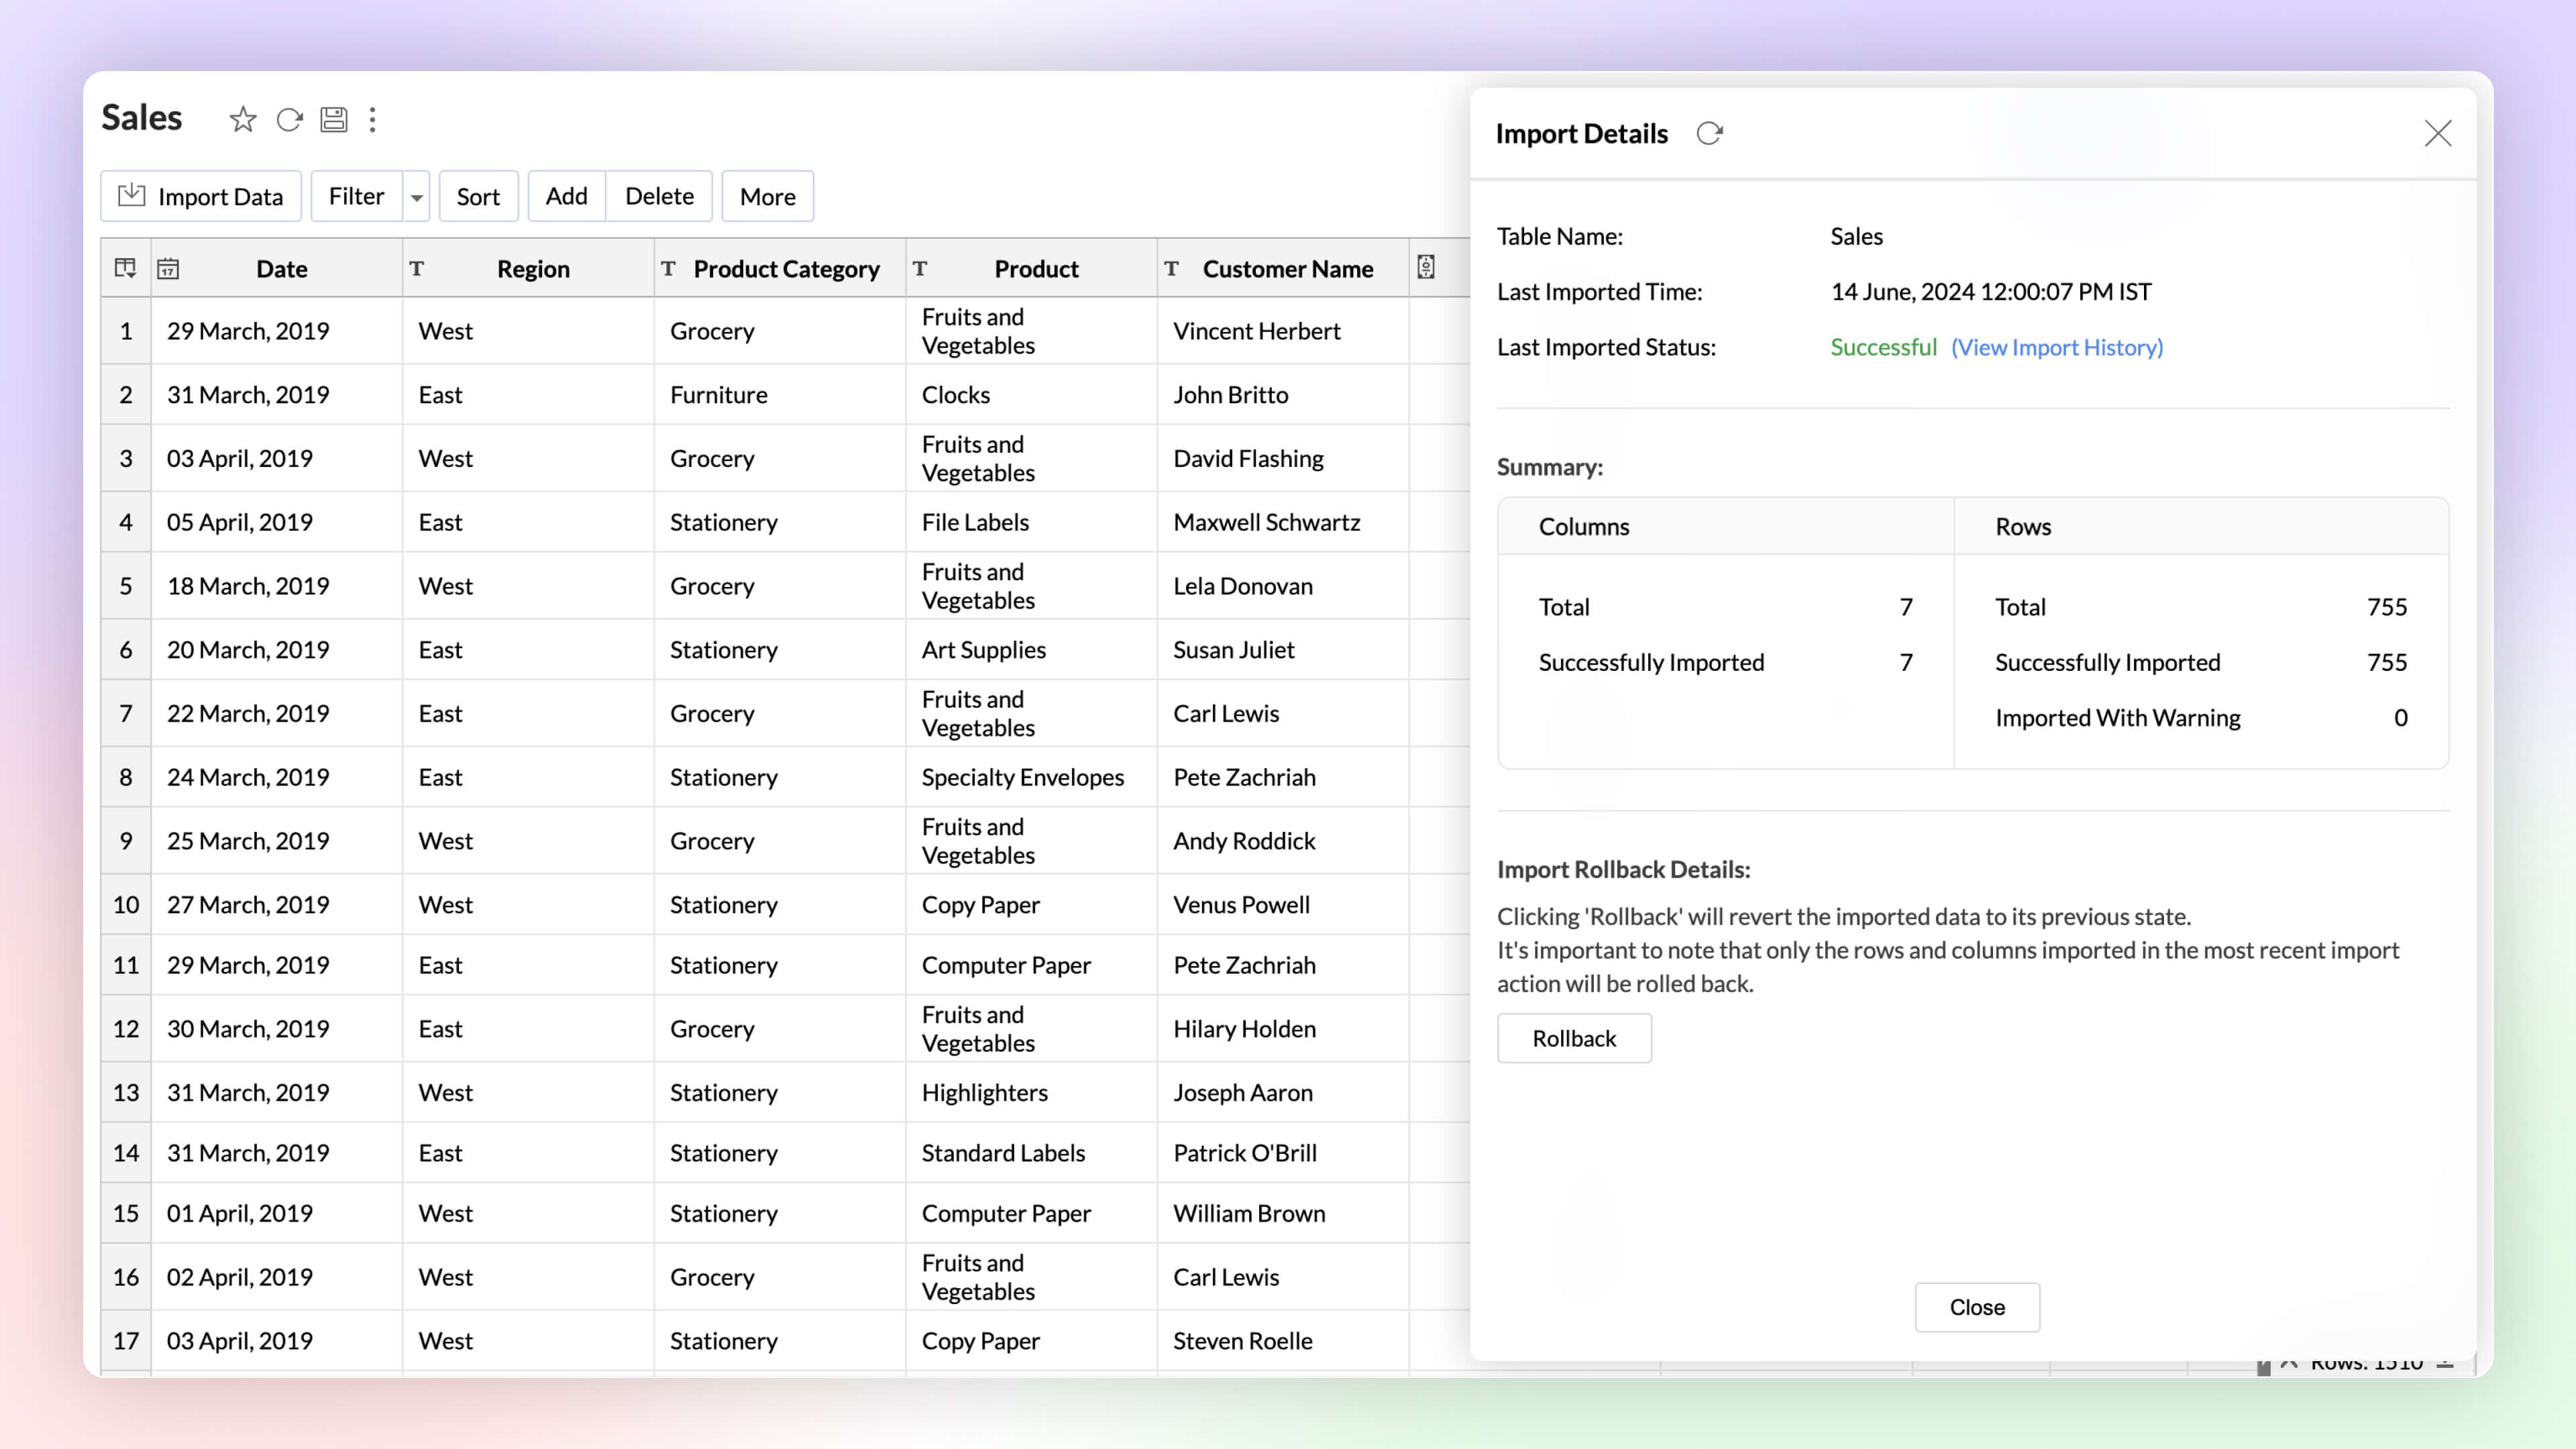
Import Rollback Enterprise Plan
Automated imports can sometimes have errors and inconsistencies in data, and this can affect the data quality and the results. The import rollback capability reverts the current data import version to its previous version without affecting the existing data flow and analysis, ensuring data integrity.
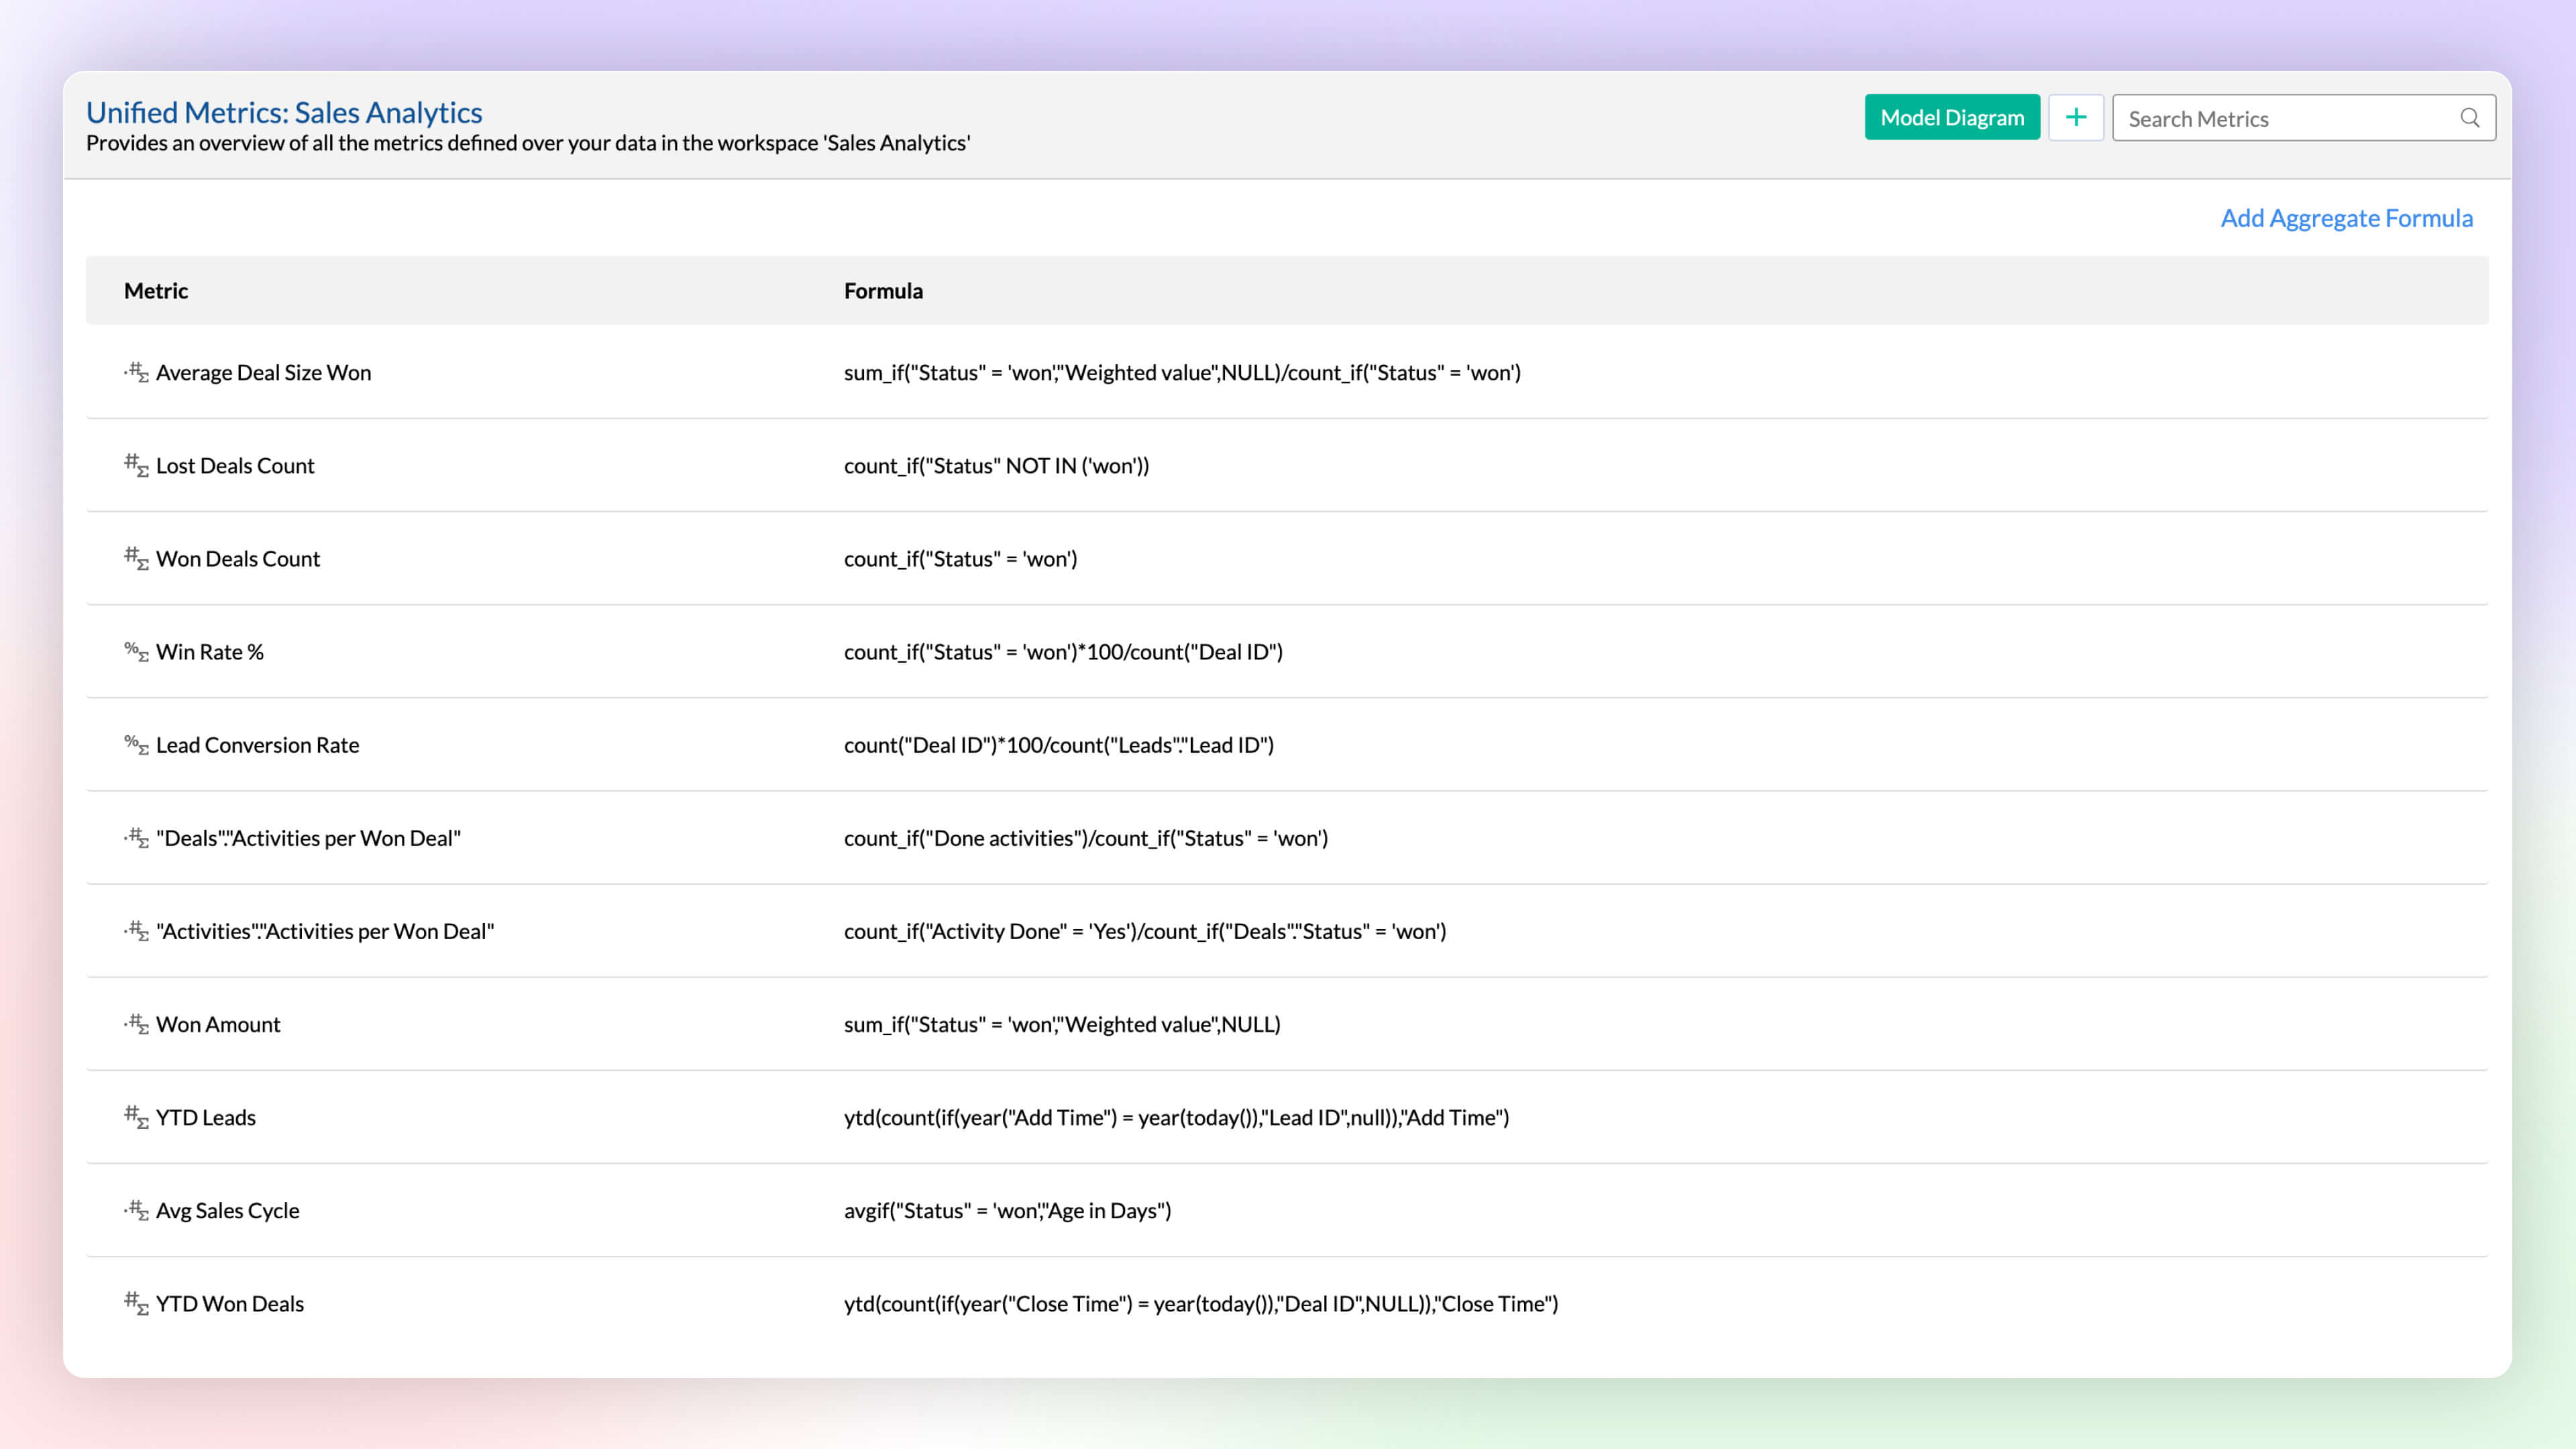
Unified Metrics
Workspace will have data imported from varied sources, and each data source or table will have different metrics (aggregates) computed for analysis. A unified metrics consolidates all the metrics used across the workspace, helps in standardization, promotes usage, and avoids duplication.
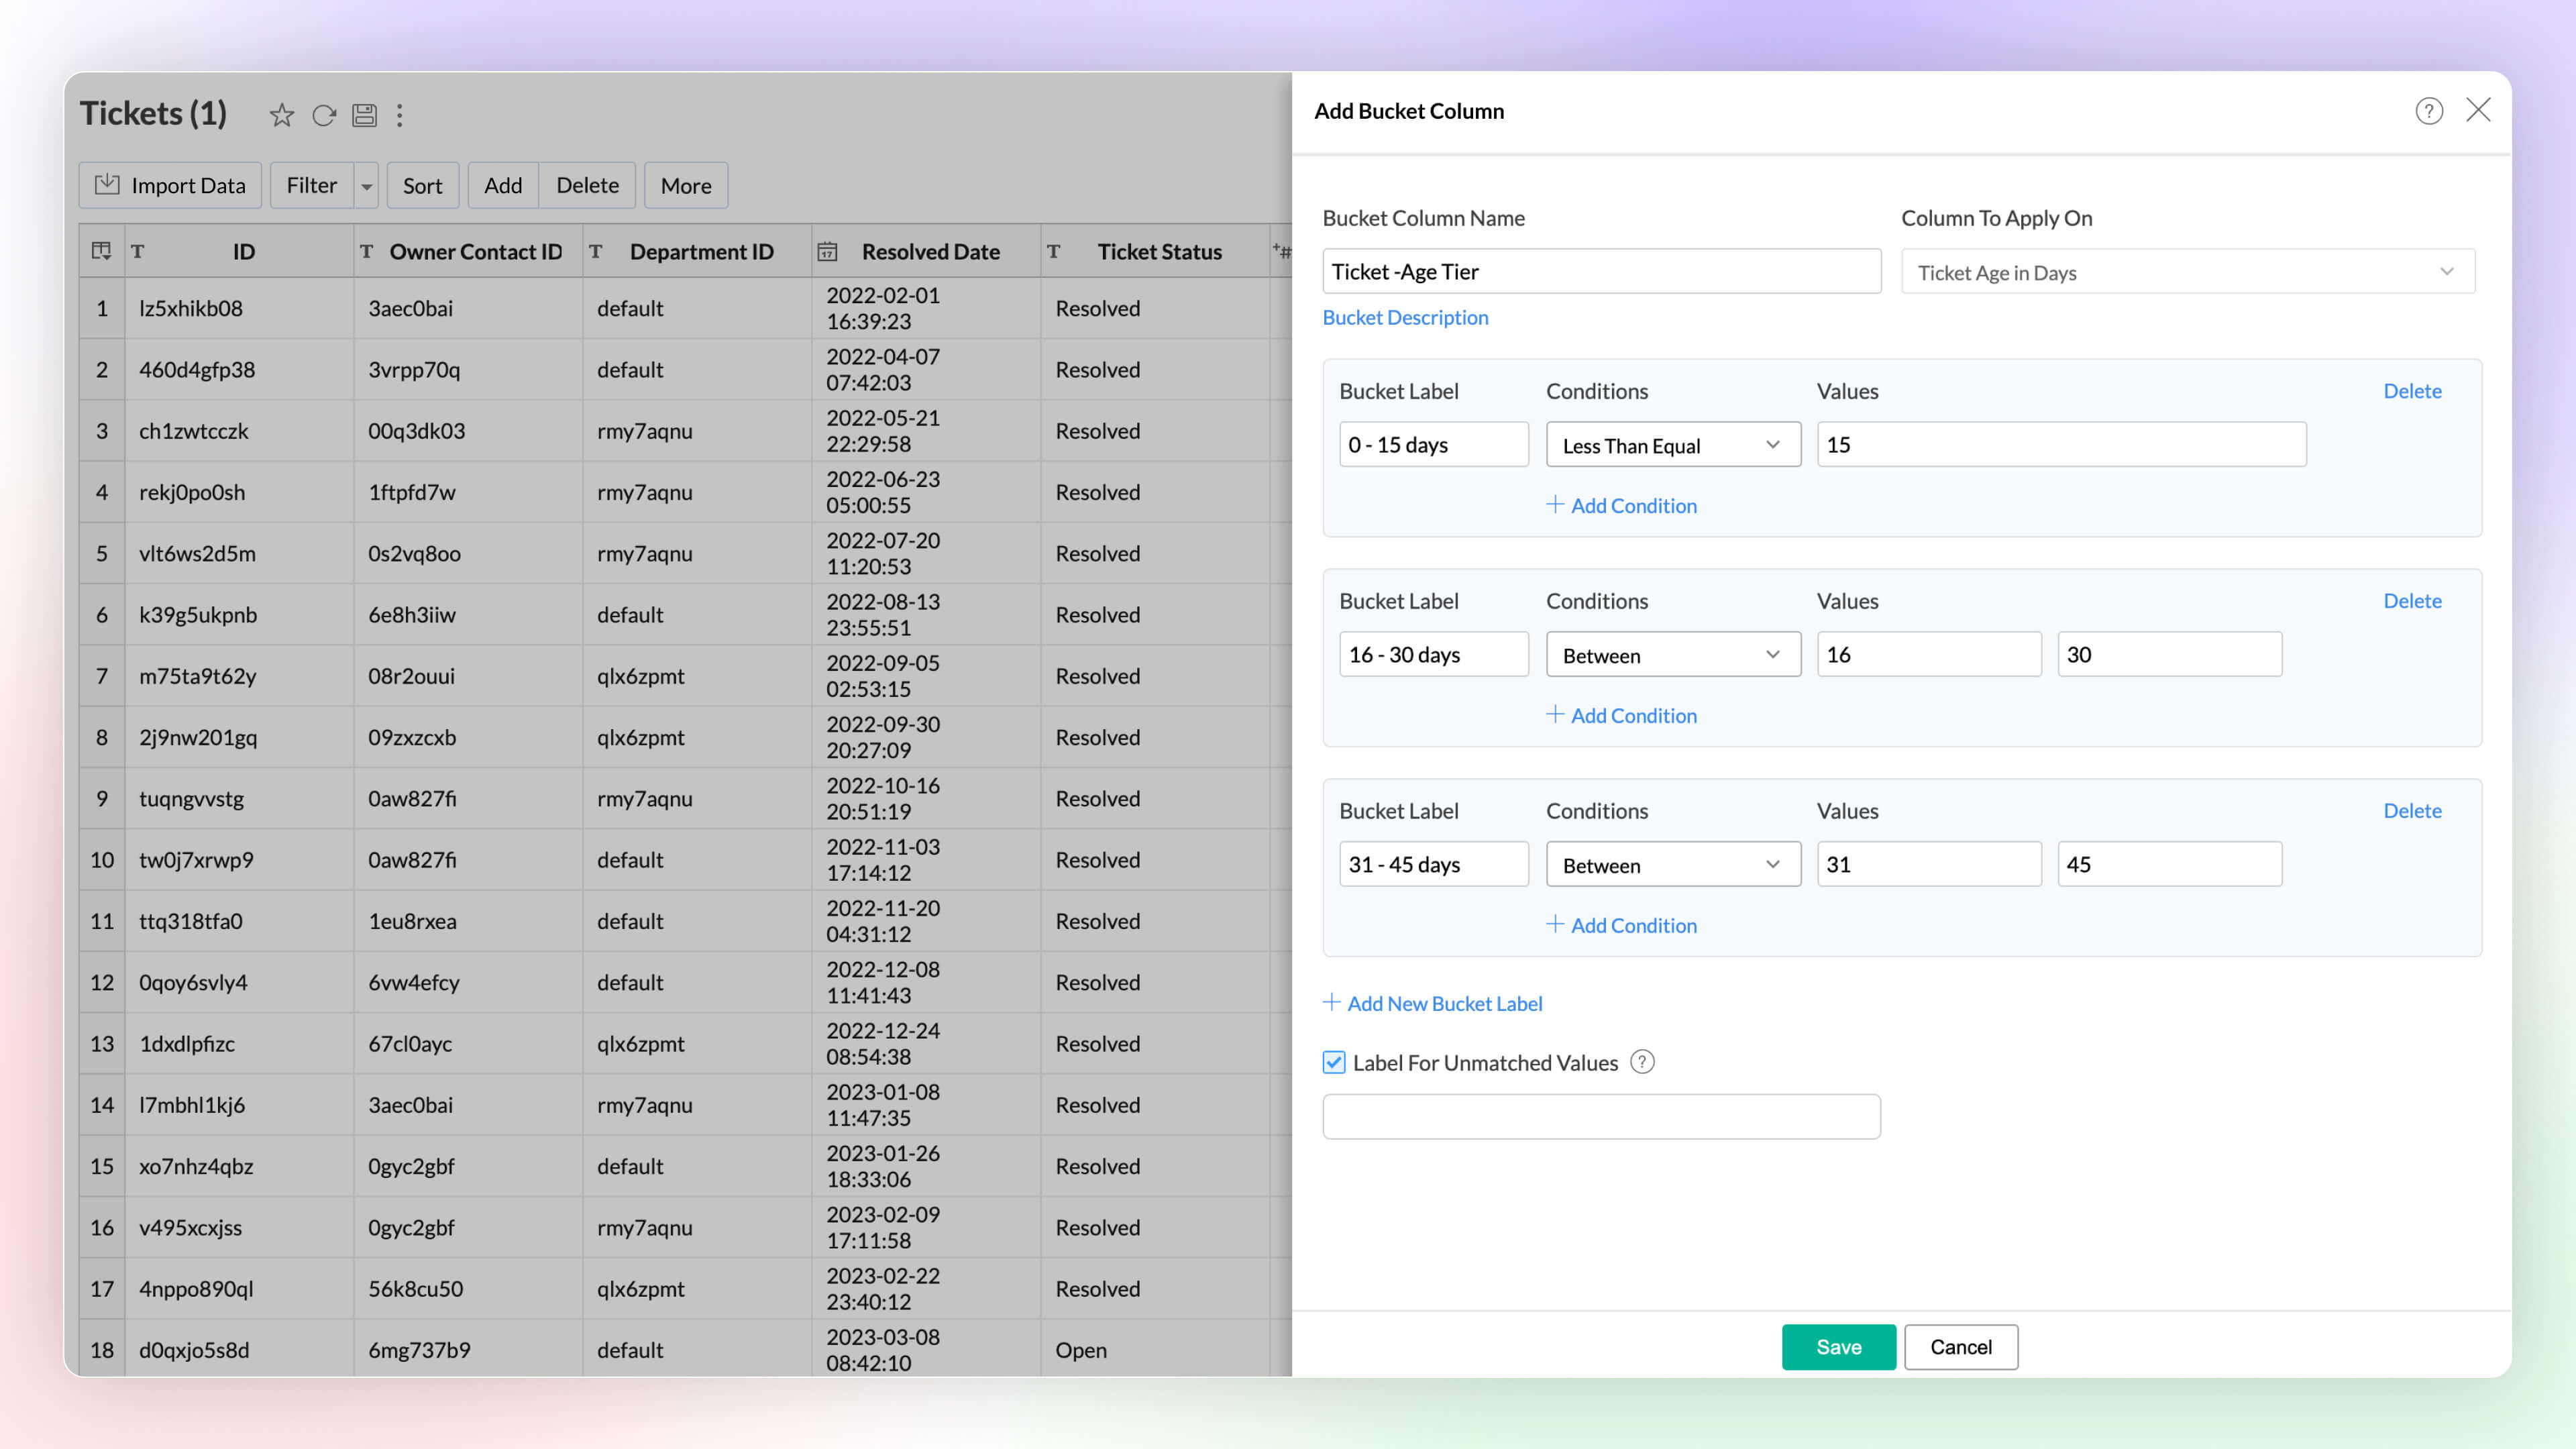
Data Bucketing
Categorize or group data points easily with the Bucket Columns options in Zoho Analytics. (Until now, users had to write formulas to achieve this; now, it is available as an inbuilt option.) Bucketing reduces the number of distinct values (cardinality). It facilitates the transformation of numerical data into different categorical bins and makes data analysis easier.
2. Visual Analytics
Zoho Analytics supports 7+ new chart types (on top of 50+ existing ones) with extensive customization options to enhance the presentation and interpretation of the data.
- Sankey charts are best suited for visualizing the flow of any process, as they clearly capture the movement of data from one point to another. It helps understand the movement of events through interconnected lines.
- Racing charts are animated views that are best suited for visualizing the changes in the data over a period of time where the relative ranking of categories is important. They highlight and help comprehend the fluctuations and progression in the data. These types of charts grab the user's attention instantly, providing an immersive experience and helping craft a compelling story about the data.
- Spark lines are compact charts that show the trends and variations in the data without taking up much space. They are widely used alongside pivot tables and help grasp trends and allow quick comparison of metrics across different fields. Zoho Analytics supports three variations that includes line chart, area chart, and bar chart.
- Geo Map Layering, add multiple data layers to the geo map to visualize various dimensions of information. This feature includes interactive options for enhanced data exploration.
- Sunburst charts represent hierarchical data through a series of rings, or concentric circles. Each ring corresponds to a level in the hierarchy. The central or innermost circle represents the root node, or the top-level category. Moving outwards, each subsequent ring represents a subcategory, where the outermost ring is the leaf node. The size of each arc in the ring is proportional to the value of the data.
- Conversion bar charts show the connected stages of a process and the gradual decrease in data as it moves through different stages of the process. Each stage is represented by a bar, with a step or stair case pattern indicating the shift in values (along with conversion percentage) at each stage.
- Tree Map is a visualization composed of differently-sized rectangles that represent your data values. This is beneficial when you want to depict the part to whole relationship among various categories.


Zia Suggestions
Now, with the new Zia Suggestions, you can effortlessly receive insightful chart recommendations while you are in the creation process. Zia suggests a variety of charts suggestions tailored to your data, allowing you to preview and apply them seamlessly with just a click.
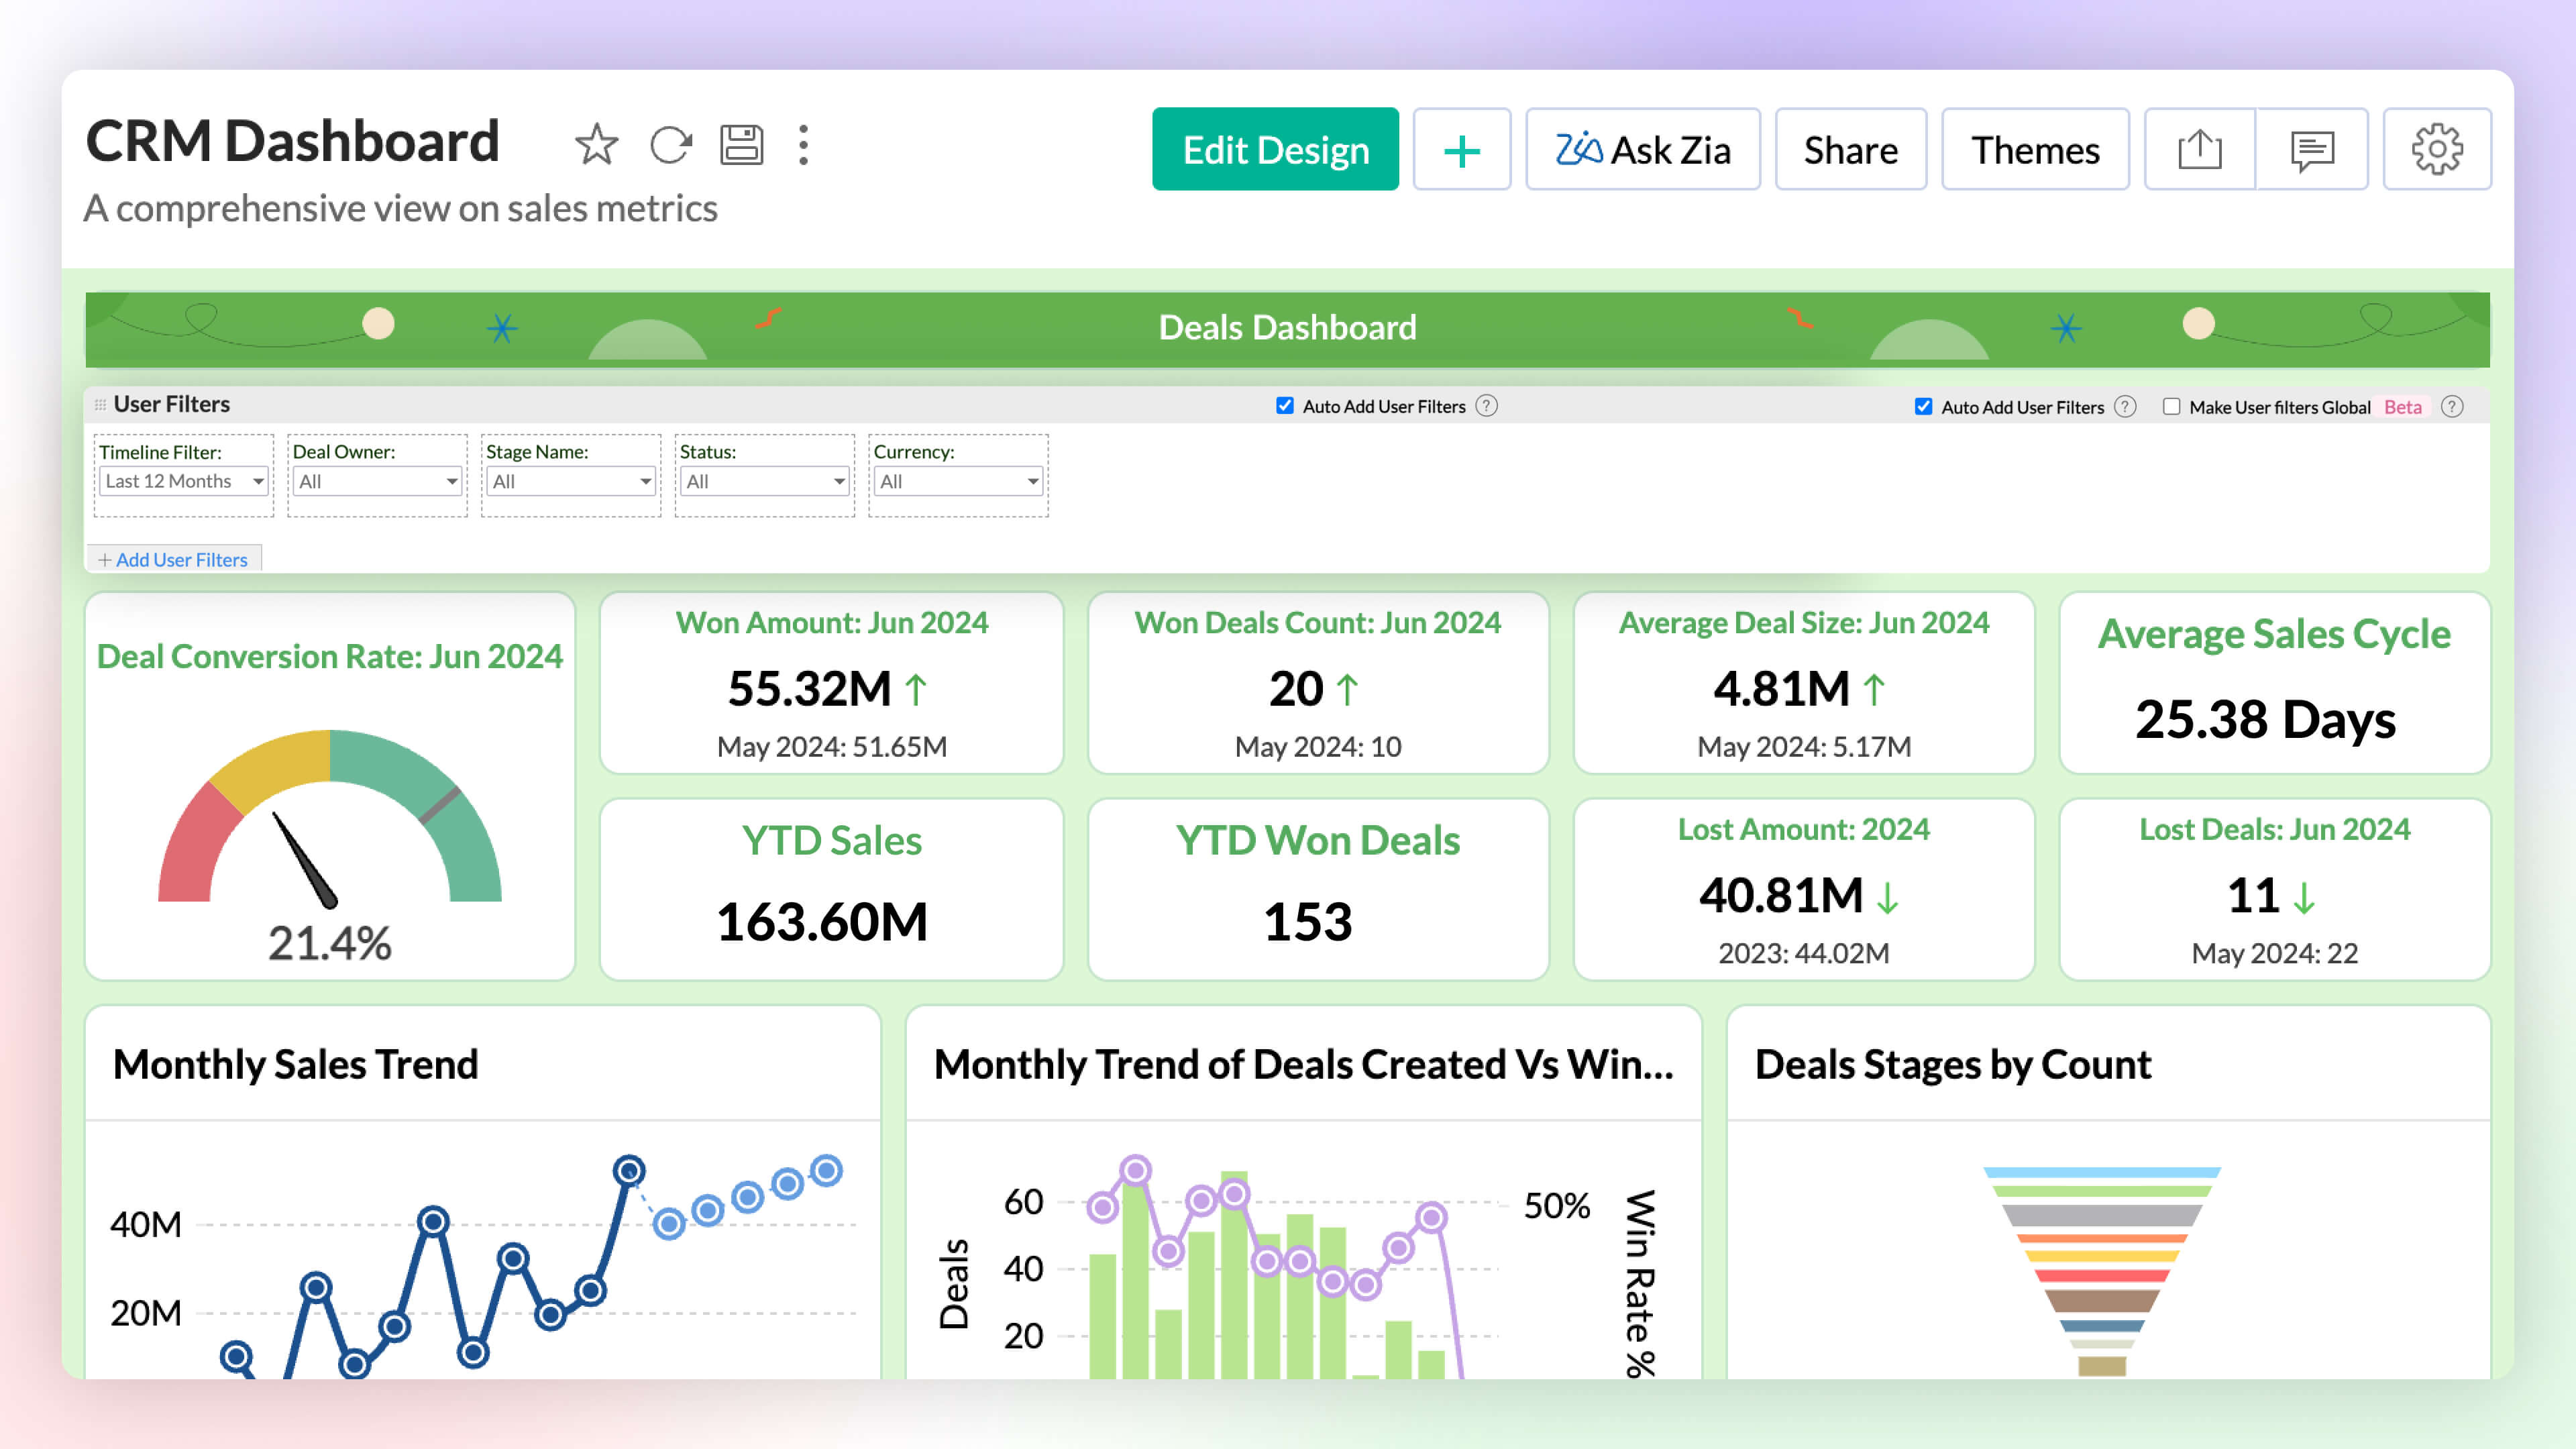
Global User Filter in Dashboards
You can now have a common user filter across all tabs in the dashboard. Global user filter gets applied across all reports in all tabs of the dashboard.
3. Advanced Data Analytics
Zoho Analytics now supports two more advanced data analytics methods: Anomaly Detection and Cluster Analysis.
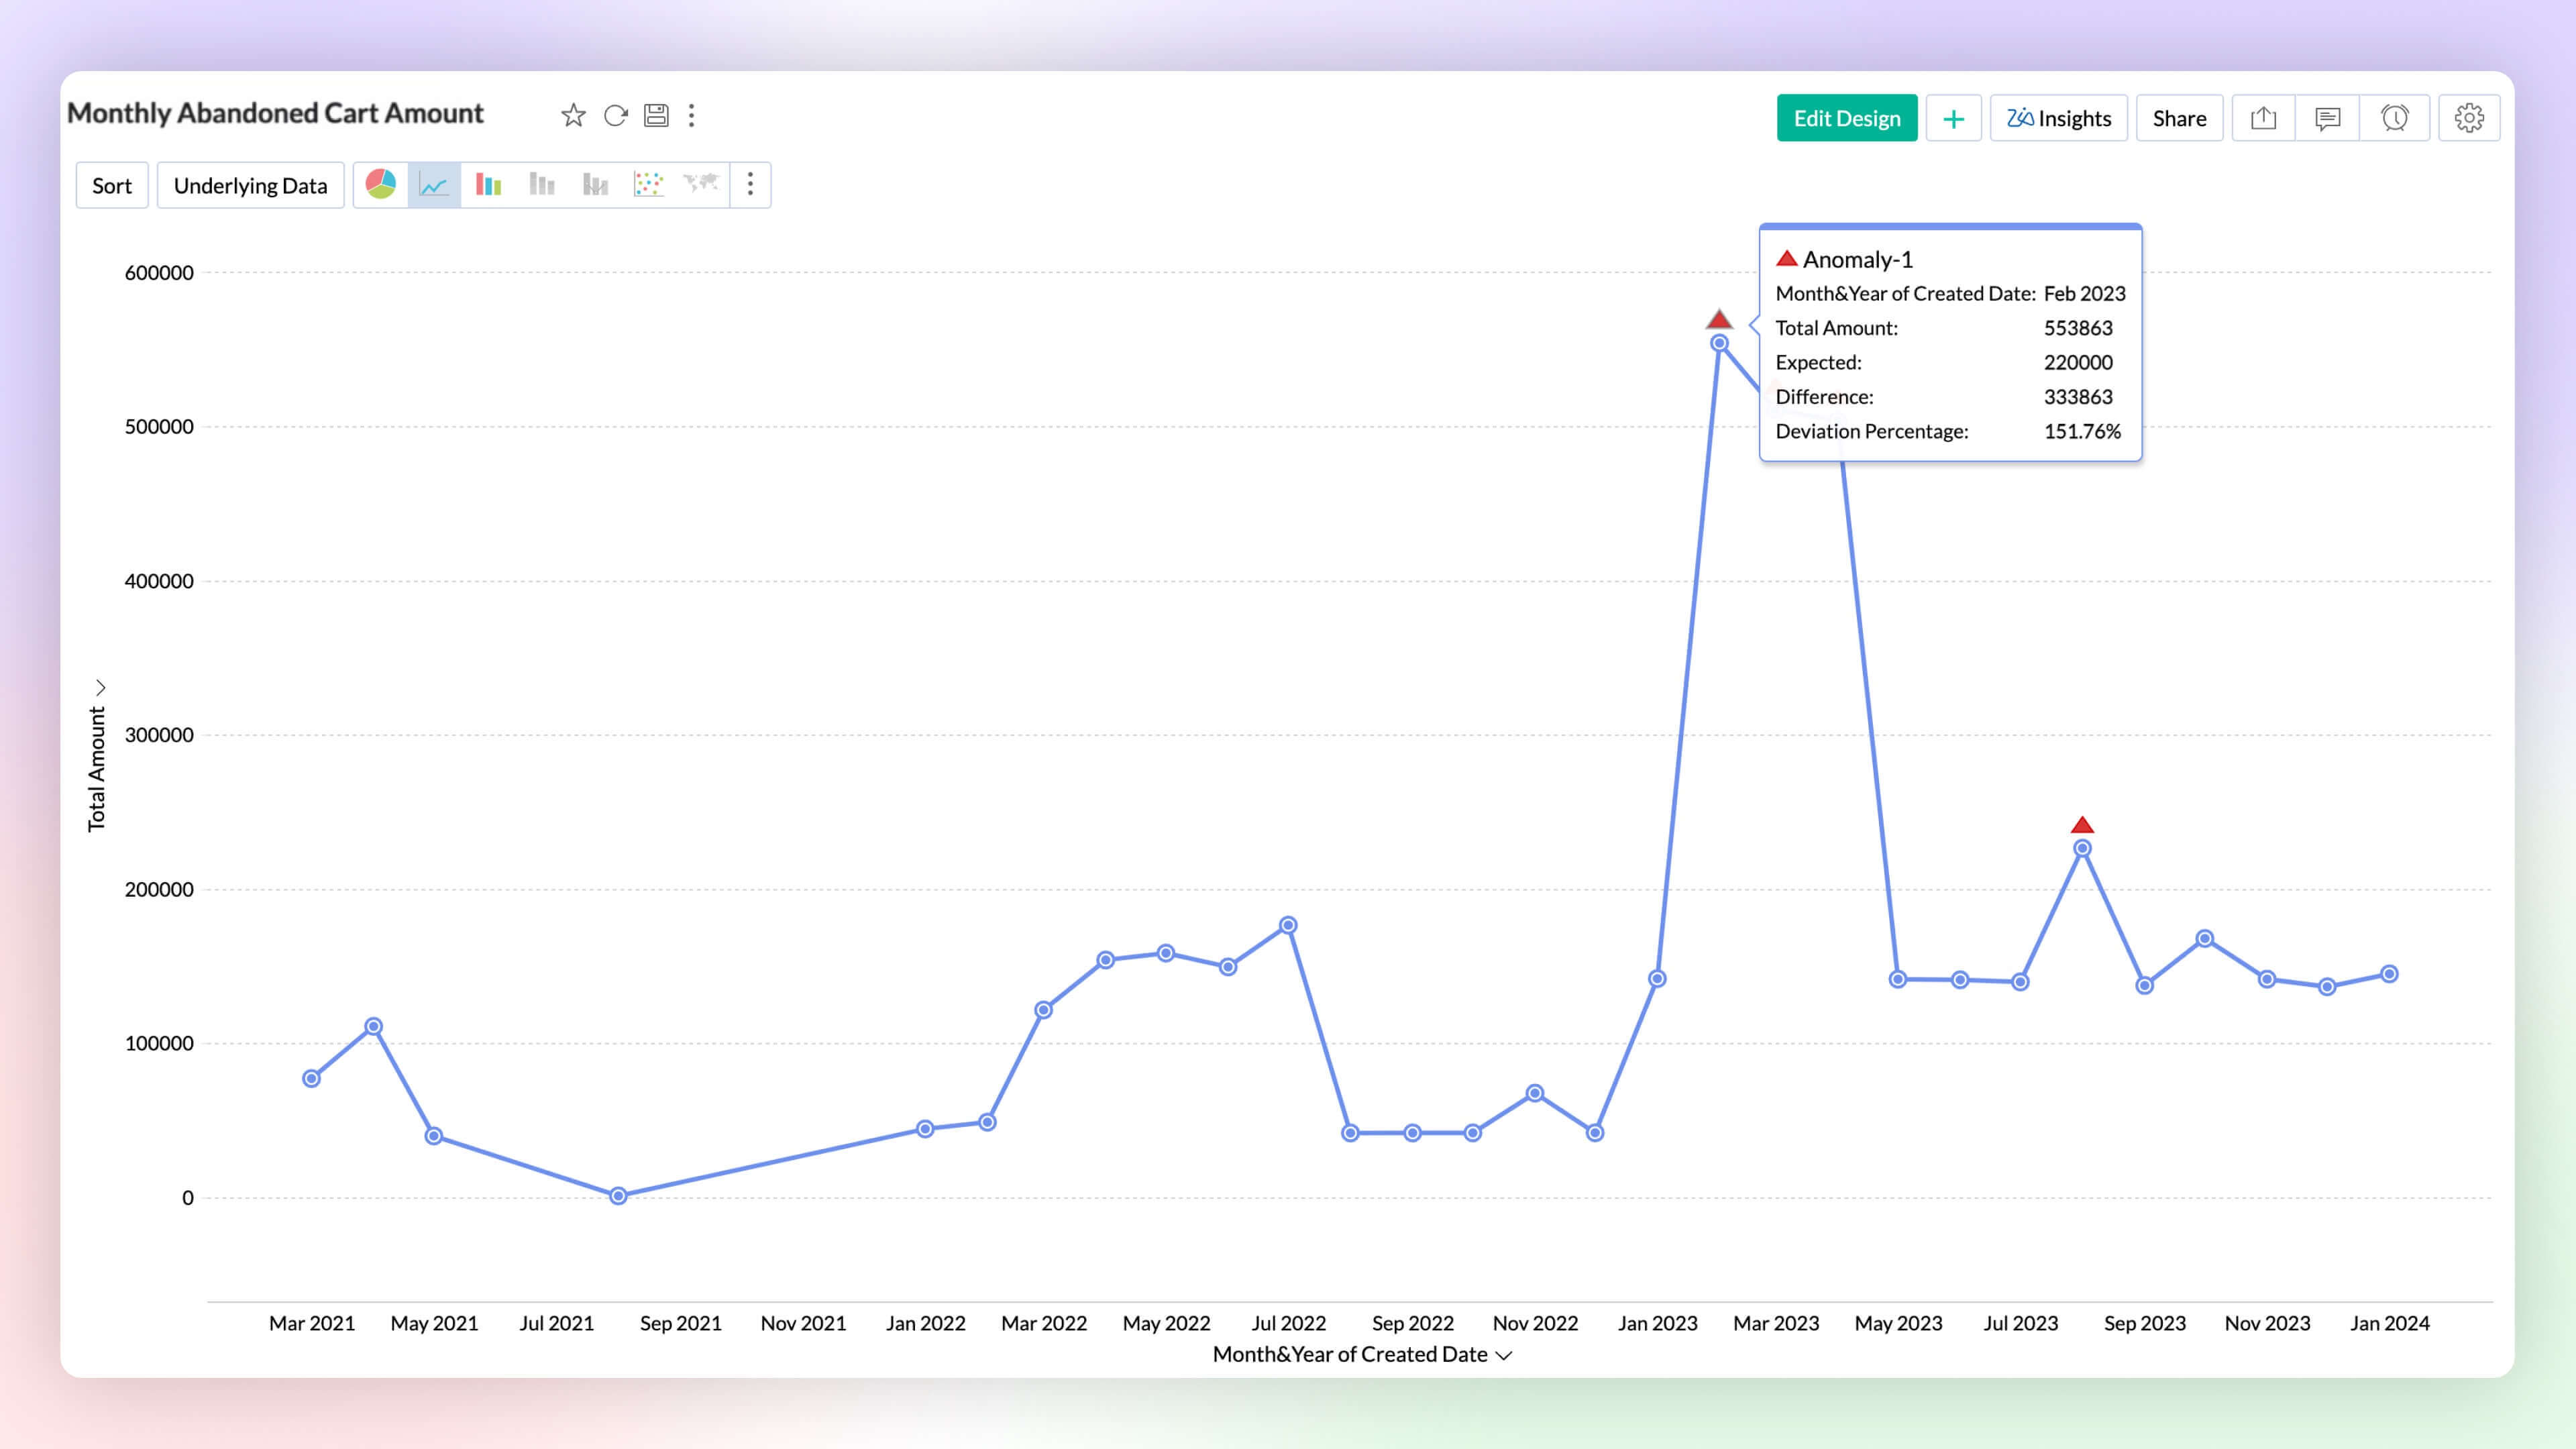
Anomaly DetectionEnterprise Plan
Anomaly detection helps you to flag outliers in your data or metrics easily. You can now create charts which highlight anomalous points visually for your attention and action. Zoho Analytics deploys robust ML algorithms and various statistical models for detecting outliers.
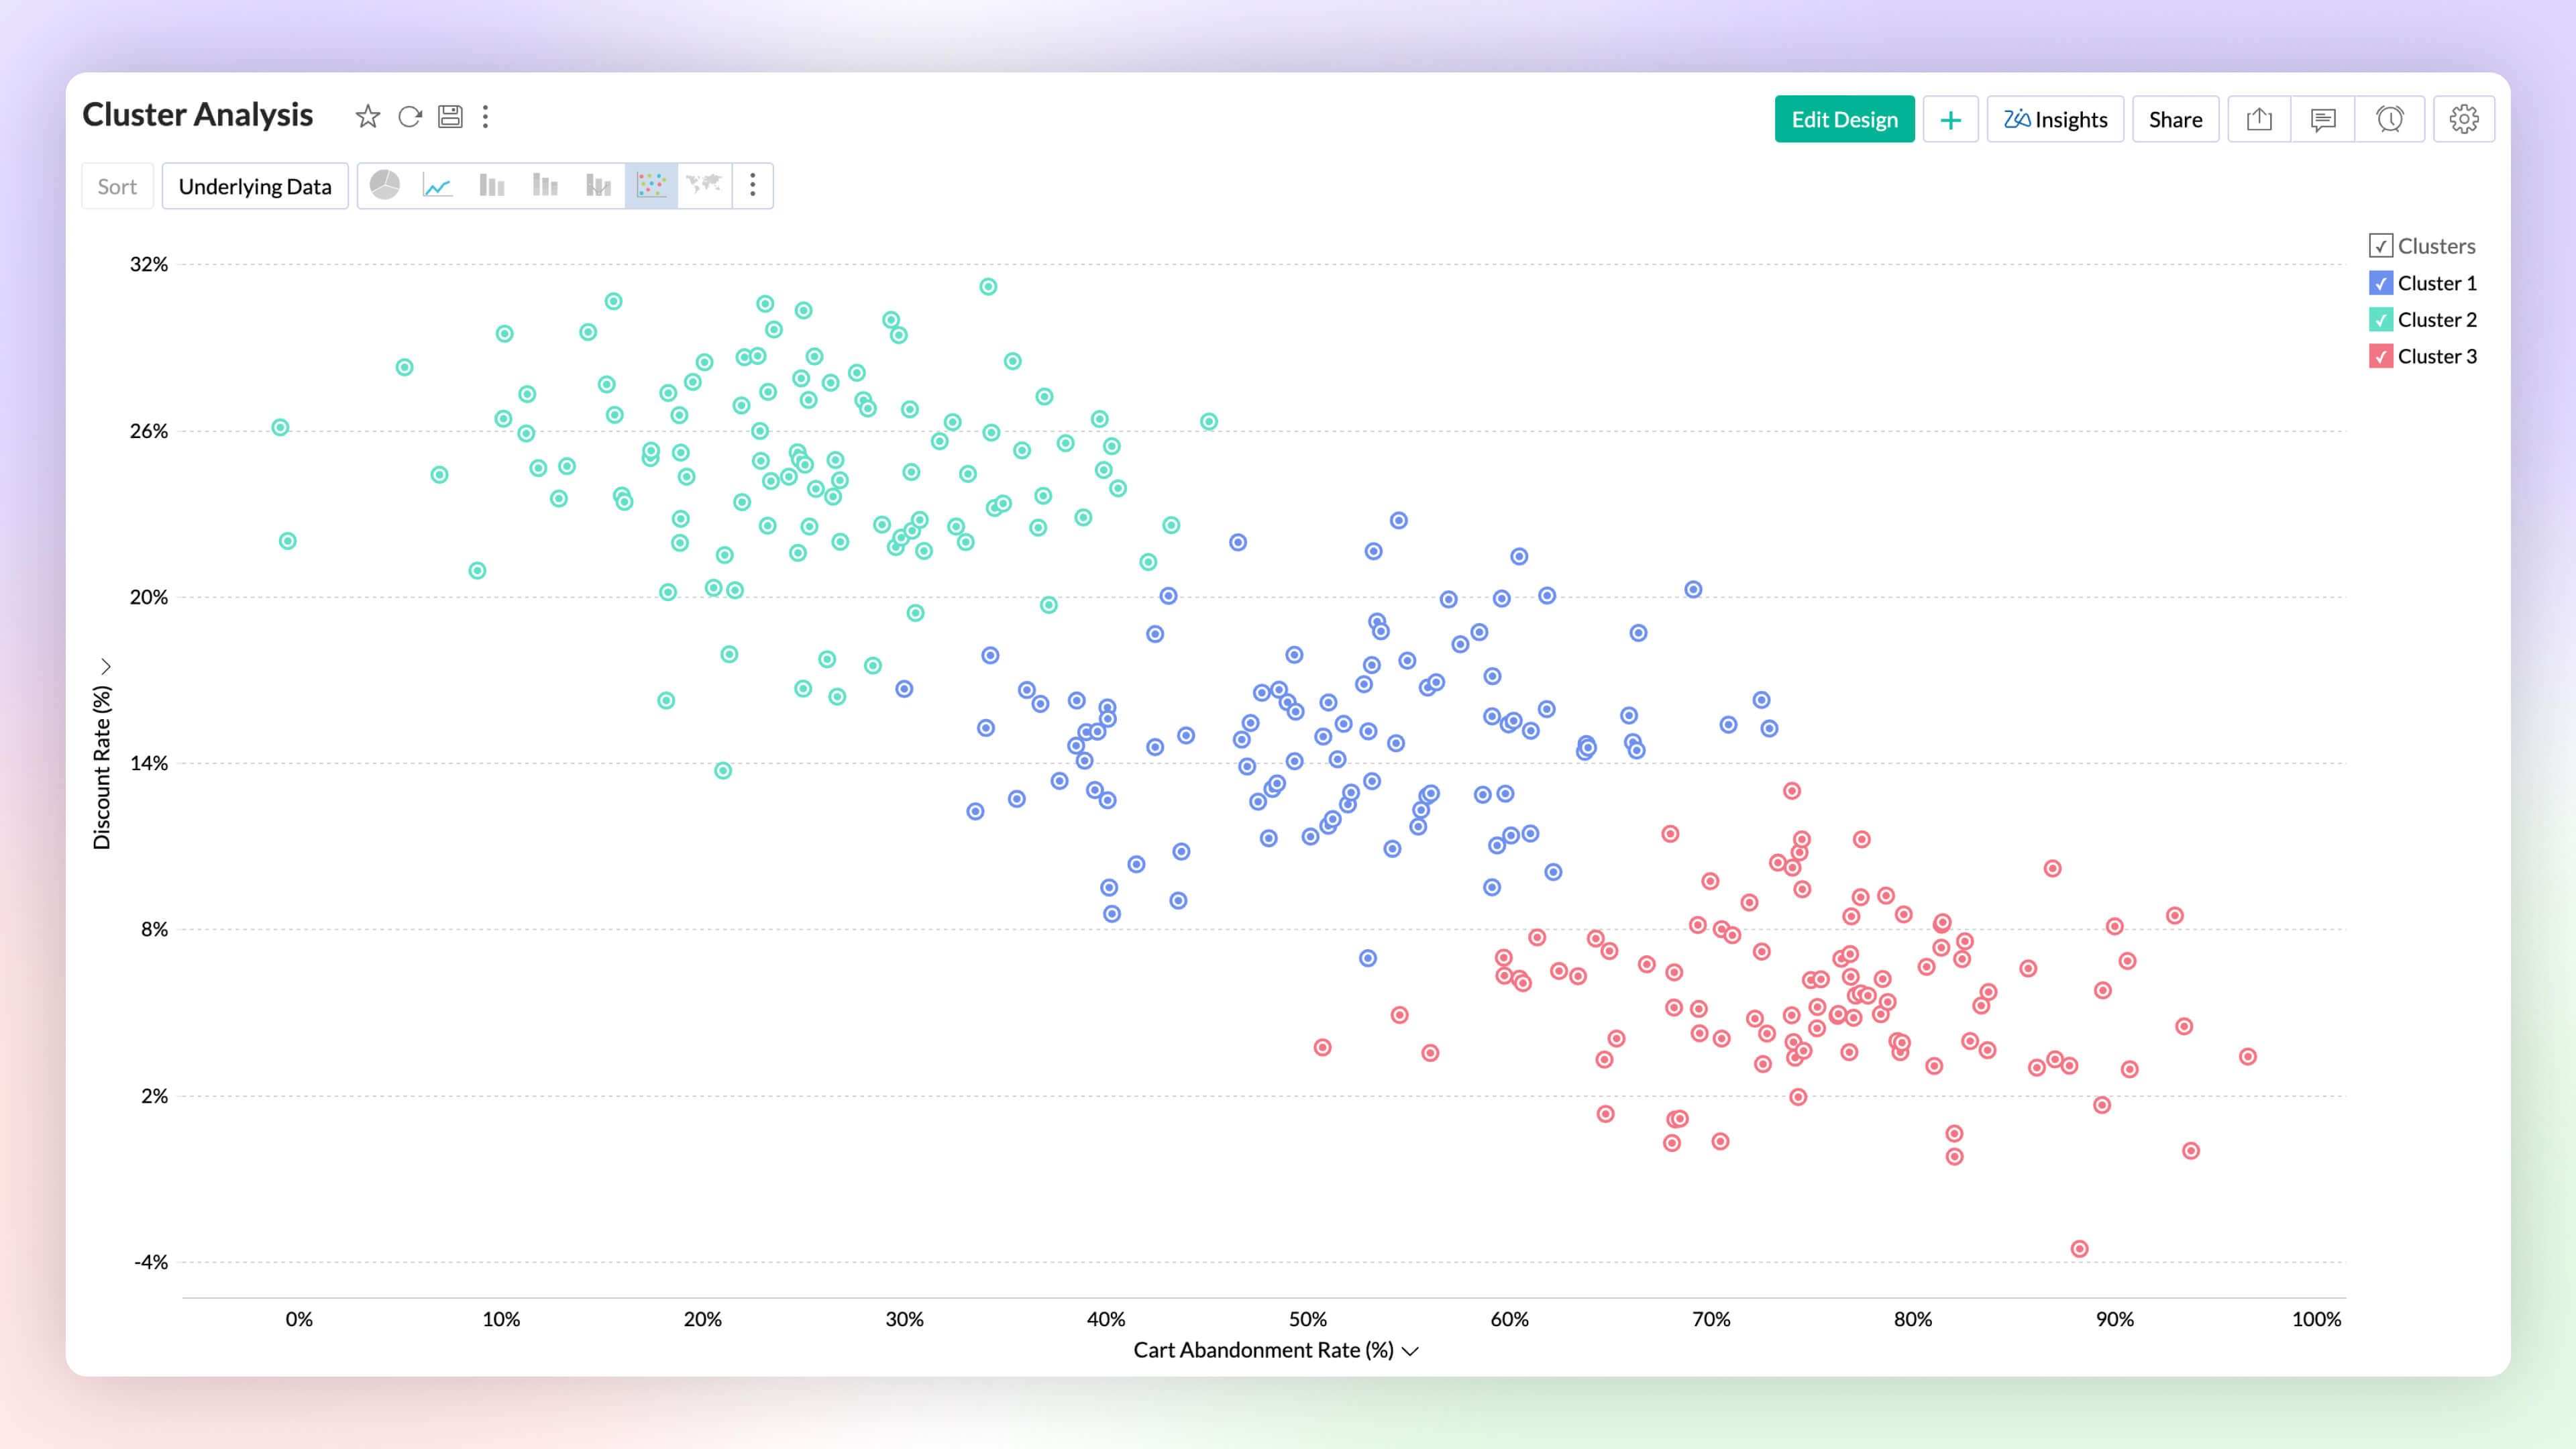
Cluster Analysis Enterprise Plan
Cluster analysis groups similar data points together based on certain factors or conditions. Each cluster contains data points that are more similar to each other than to those in other clusters, reducing the complexity of the data. Zoho Analytics deploys K-means, K-modes and K-prototypes algorithms for clustering the data points.
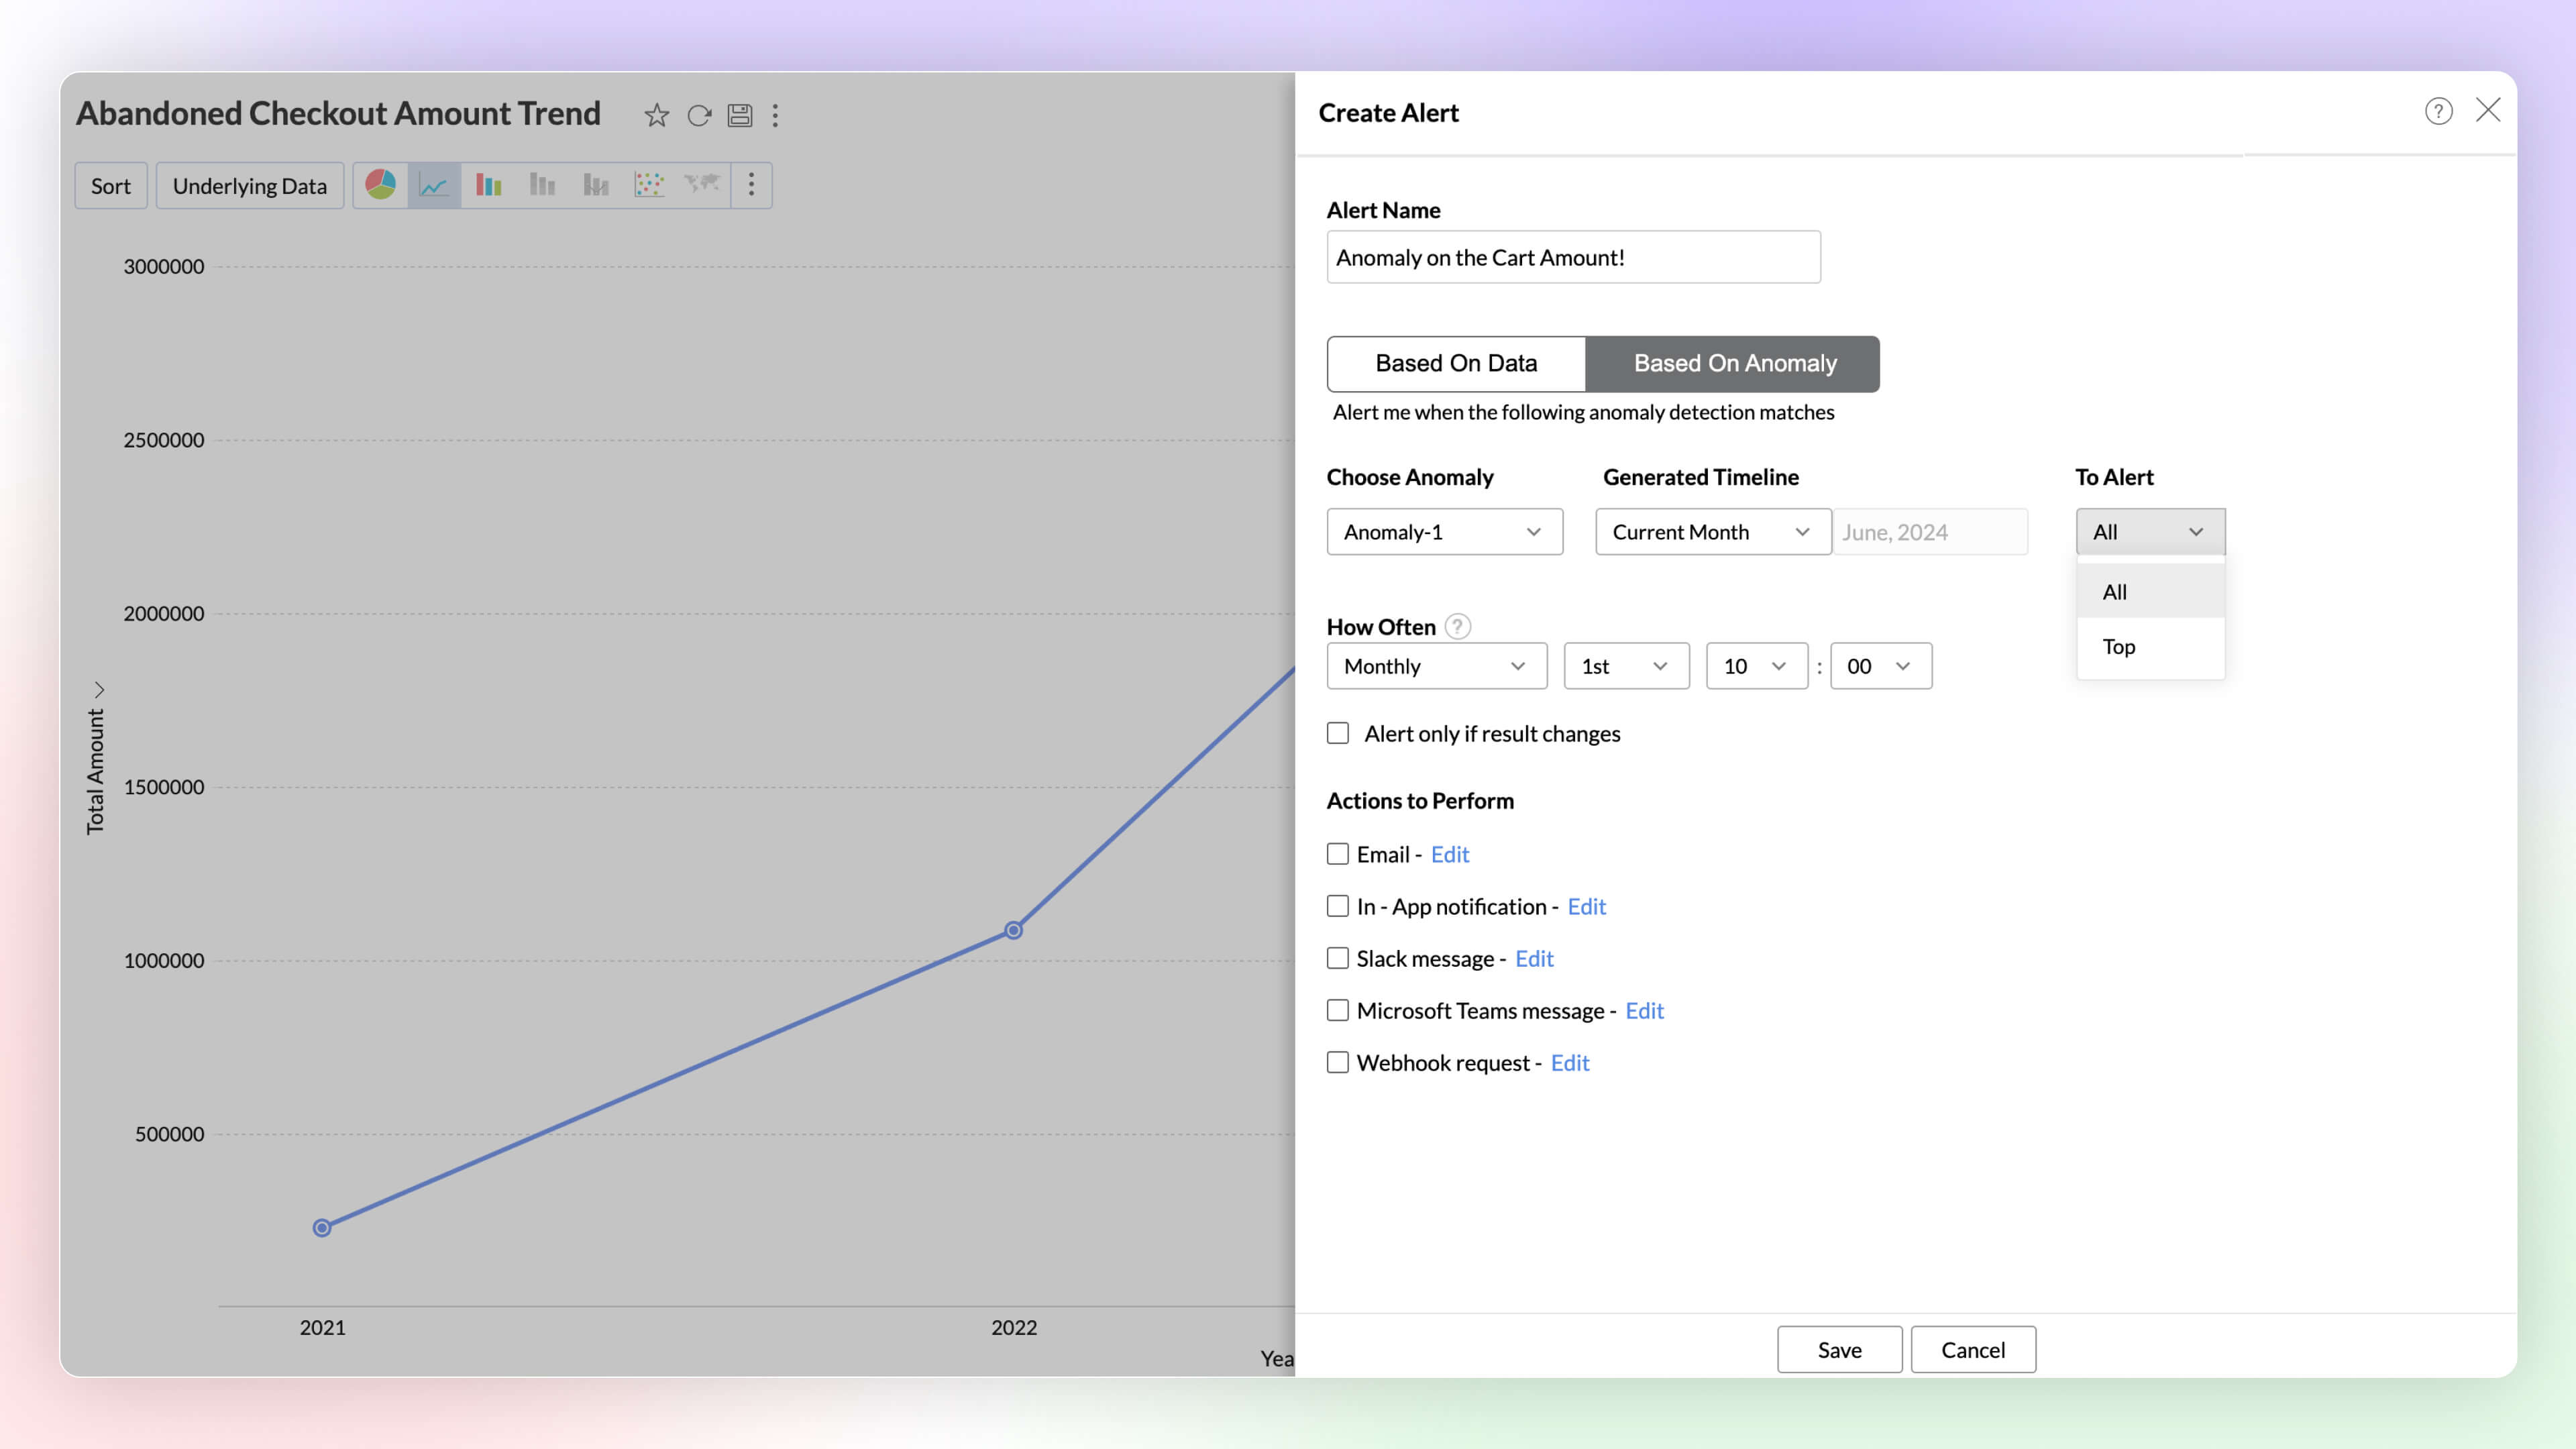
Alerts Based on Threshold and Anomalies
Set data alerts based on thresholds and anomalies to ensure timely identification of vital change in the key business metrics and potential issues.
Ask Zia Bot in Microsoft Teams
Combine the generative AI capabilities of Zoho Analytics' Ask Zia with Microsoft Teams. Get answers to your data queries, access key business insights quickly, predict future trends, and build reports right from within Microsoft Teams with Ask Zia bot.
4. Build your ML Models with AutoML & Code Studio
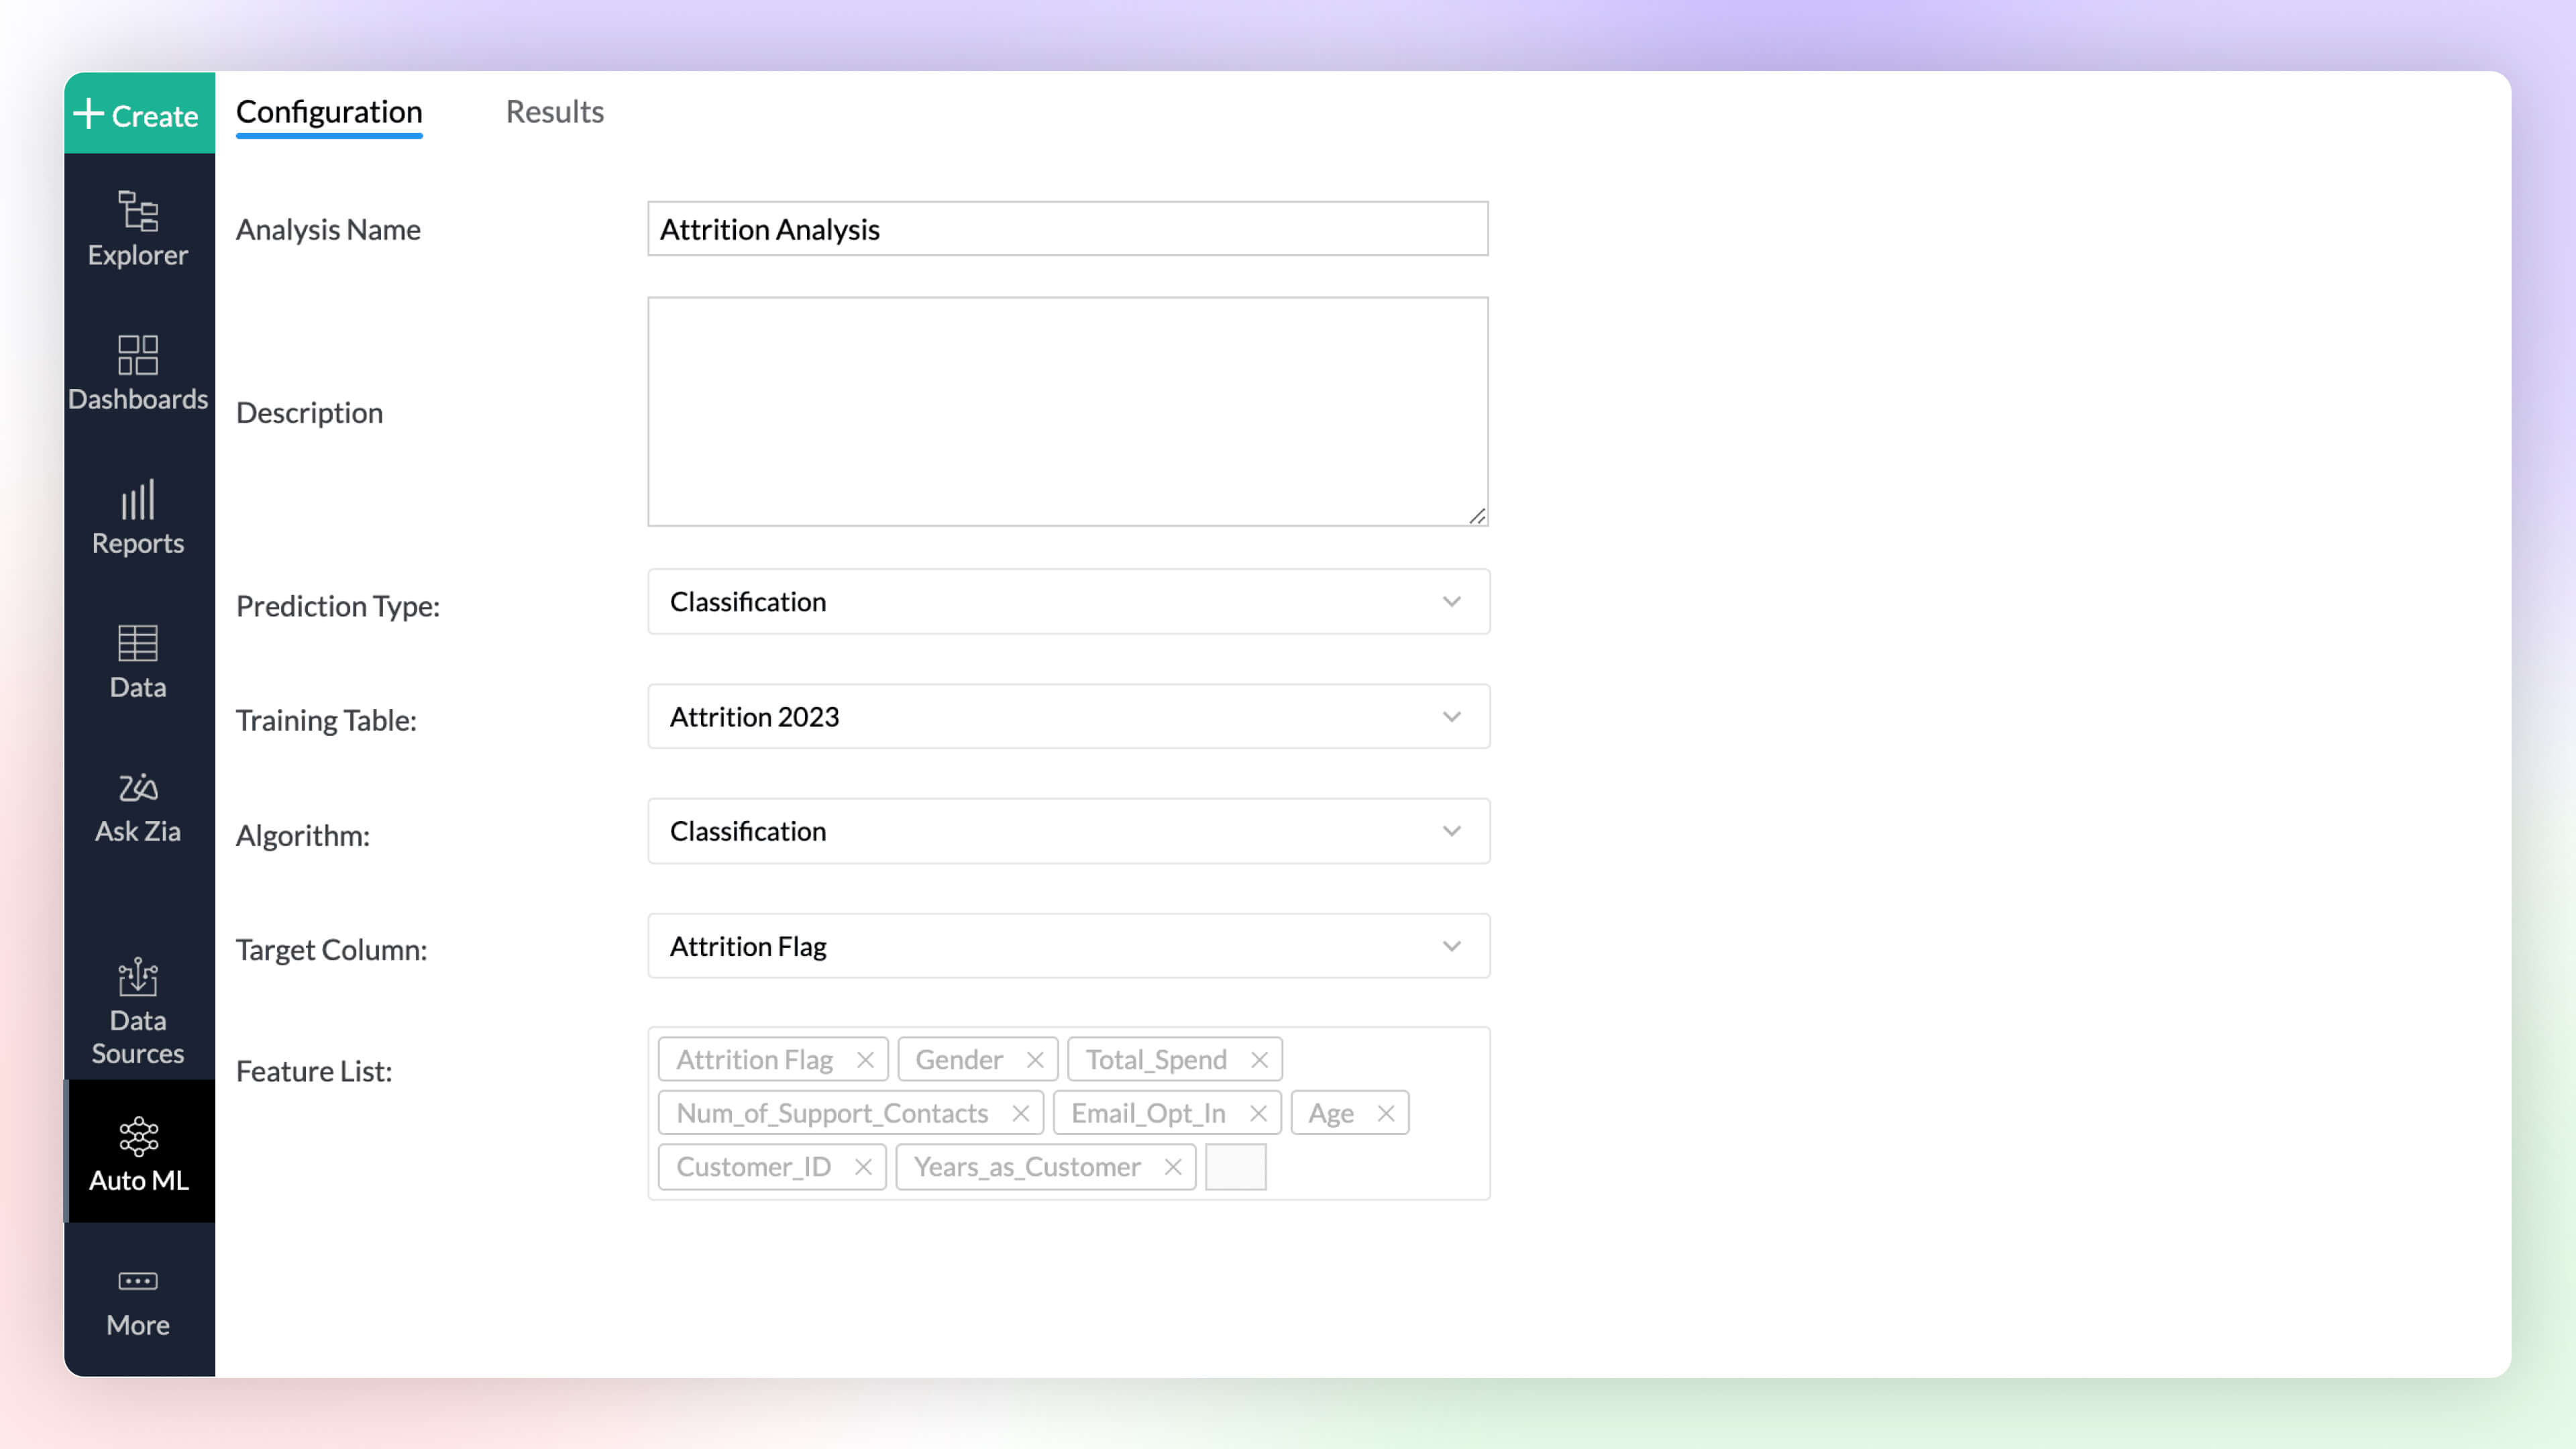
AutoMLEnterprise Plan
Automated machine learning provides a code-free (low-code/no-code) experience to train, verify, and build custom machine learning models with high efficiency. The simple and user-friendly design makes it possible for people with varied data-level expertise to create ML models easily for their custom needs.
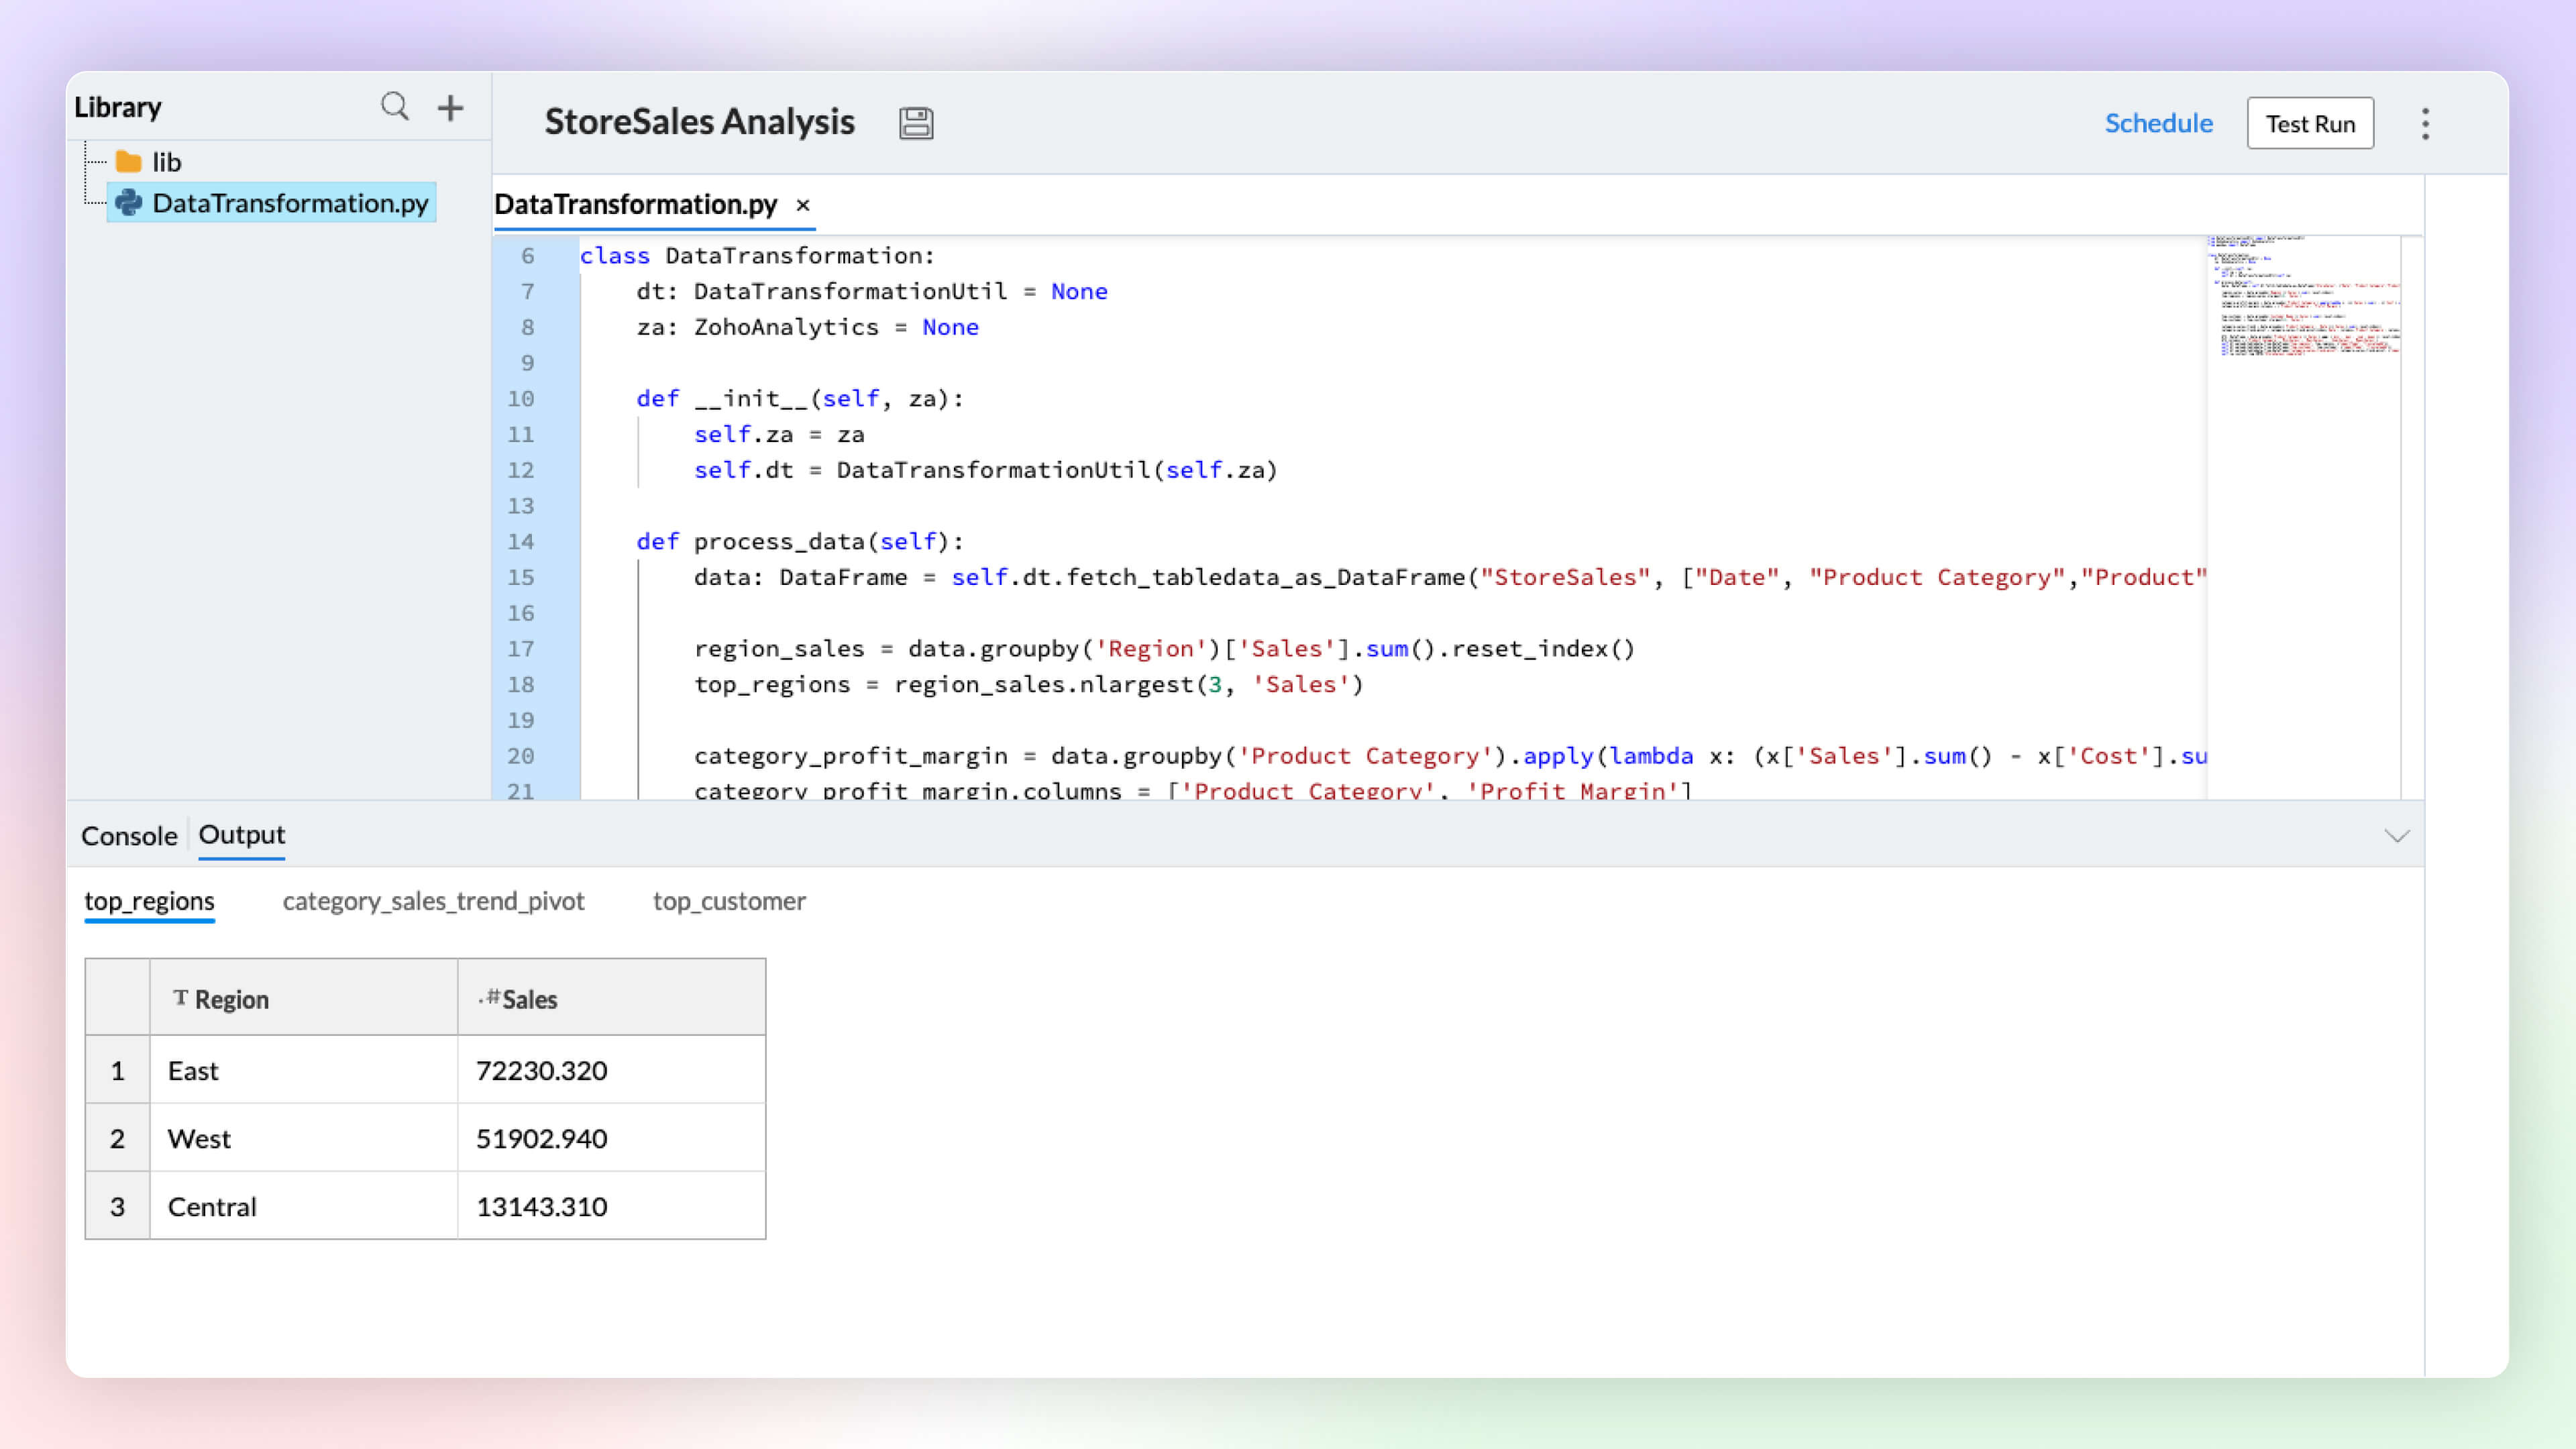
Code Studio Enterprise Plan
Python Code Studio enables you to build/import custom logic and ML models for your specific data preparation, transformation, enrichment, and analytical modeling needs.
5. Data Storytelling
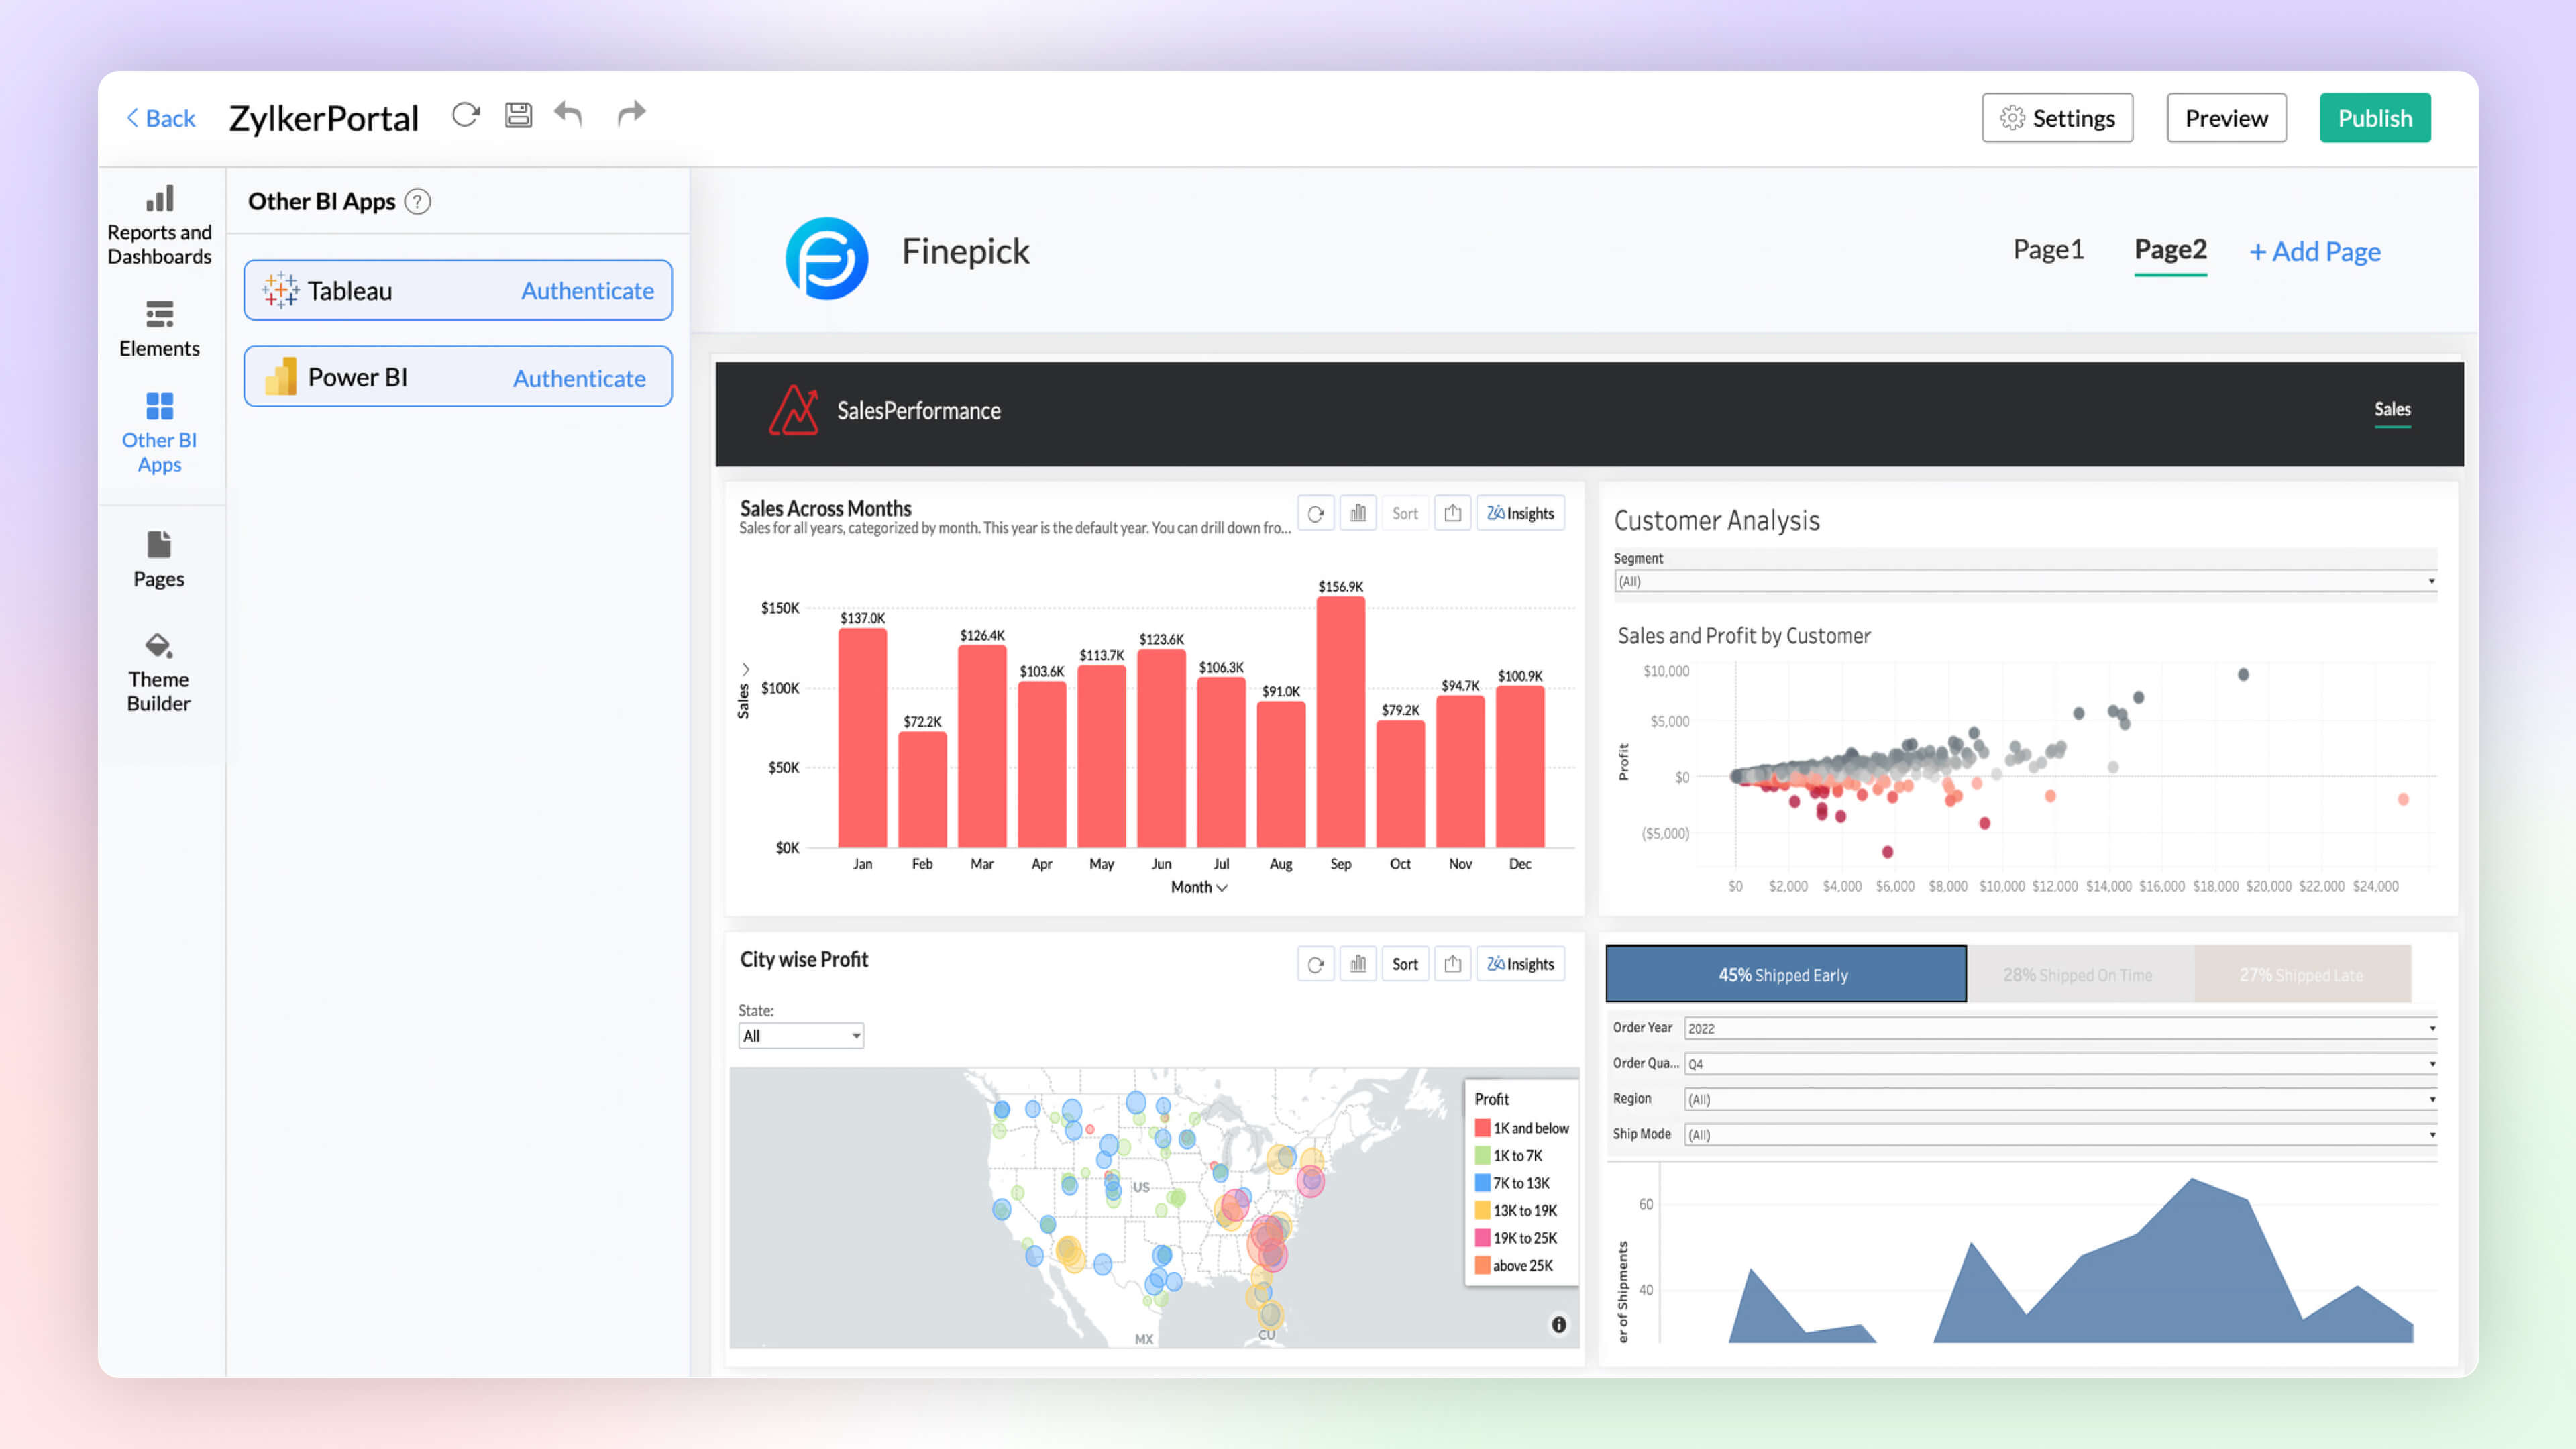
BI Fabric
Create unified BI portals for your organization's business needs. Collate reports from other BI applications like Tableau and Power BI. Having a unified portal improves collaboration, promotes centralized accessibility, and makes it easy for C-level executives to make robust business decisions.
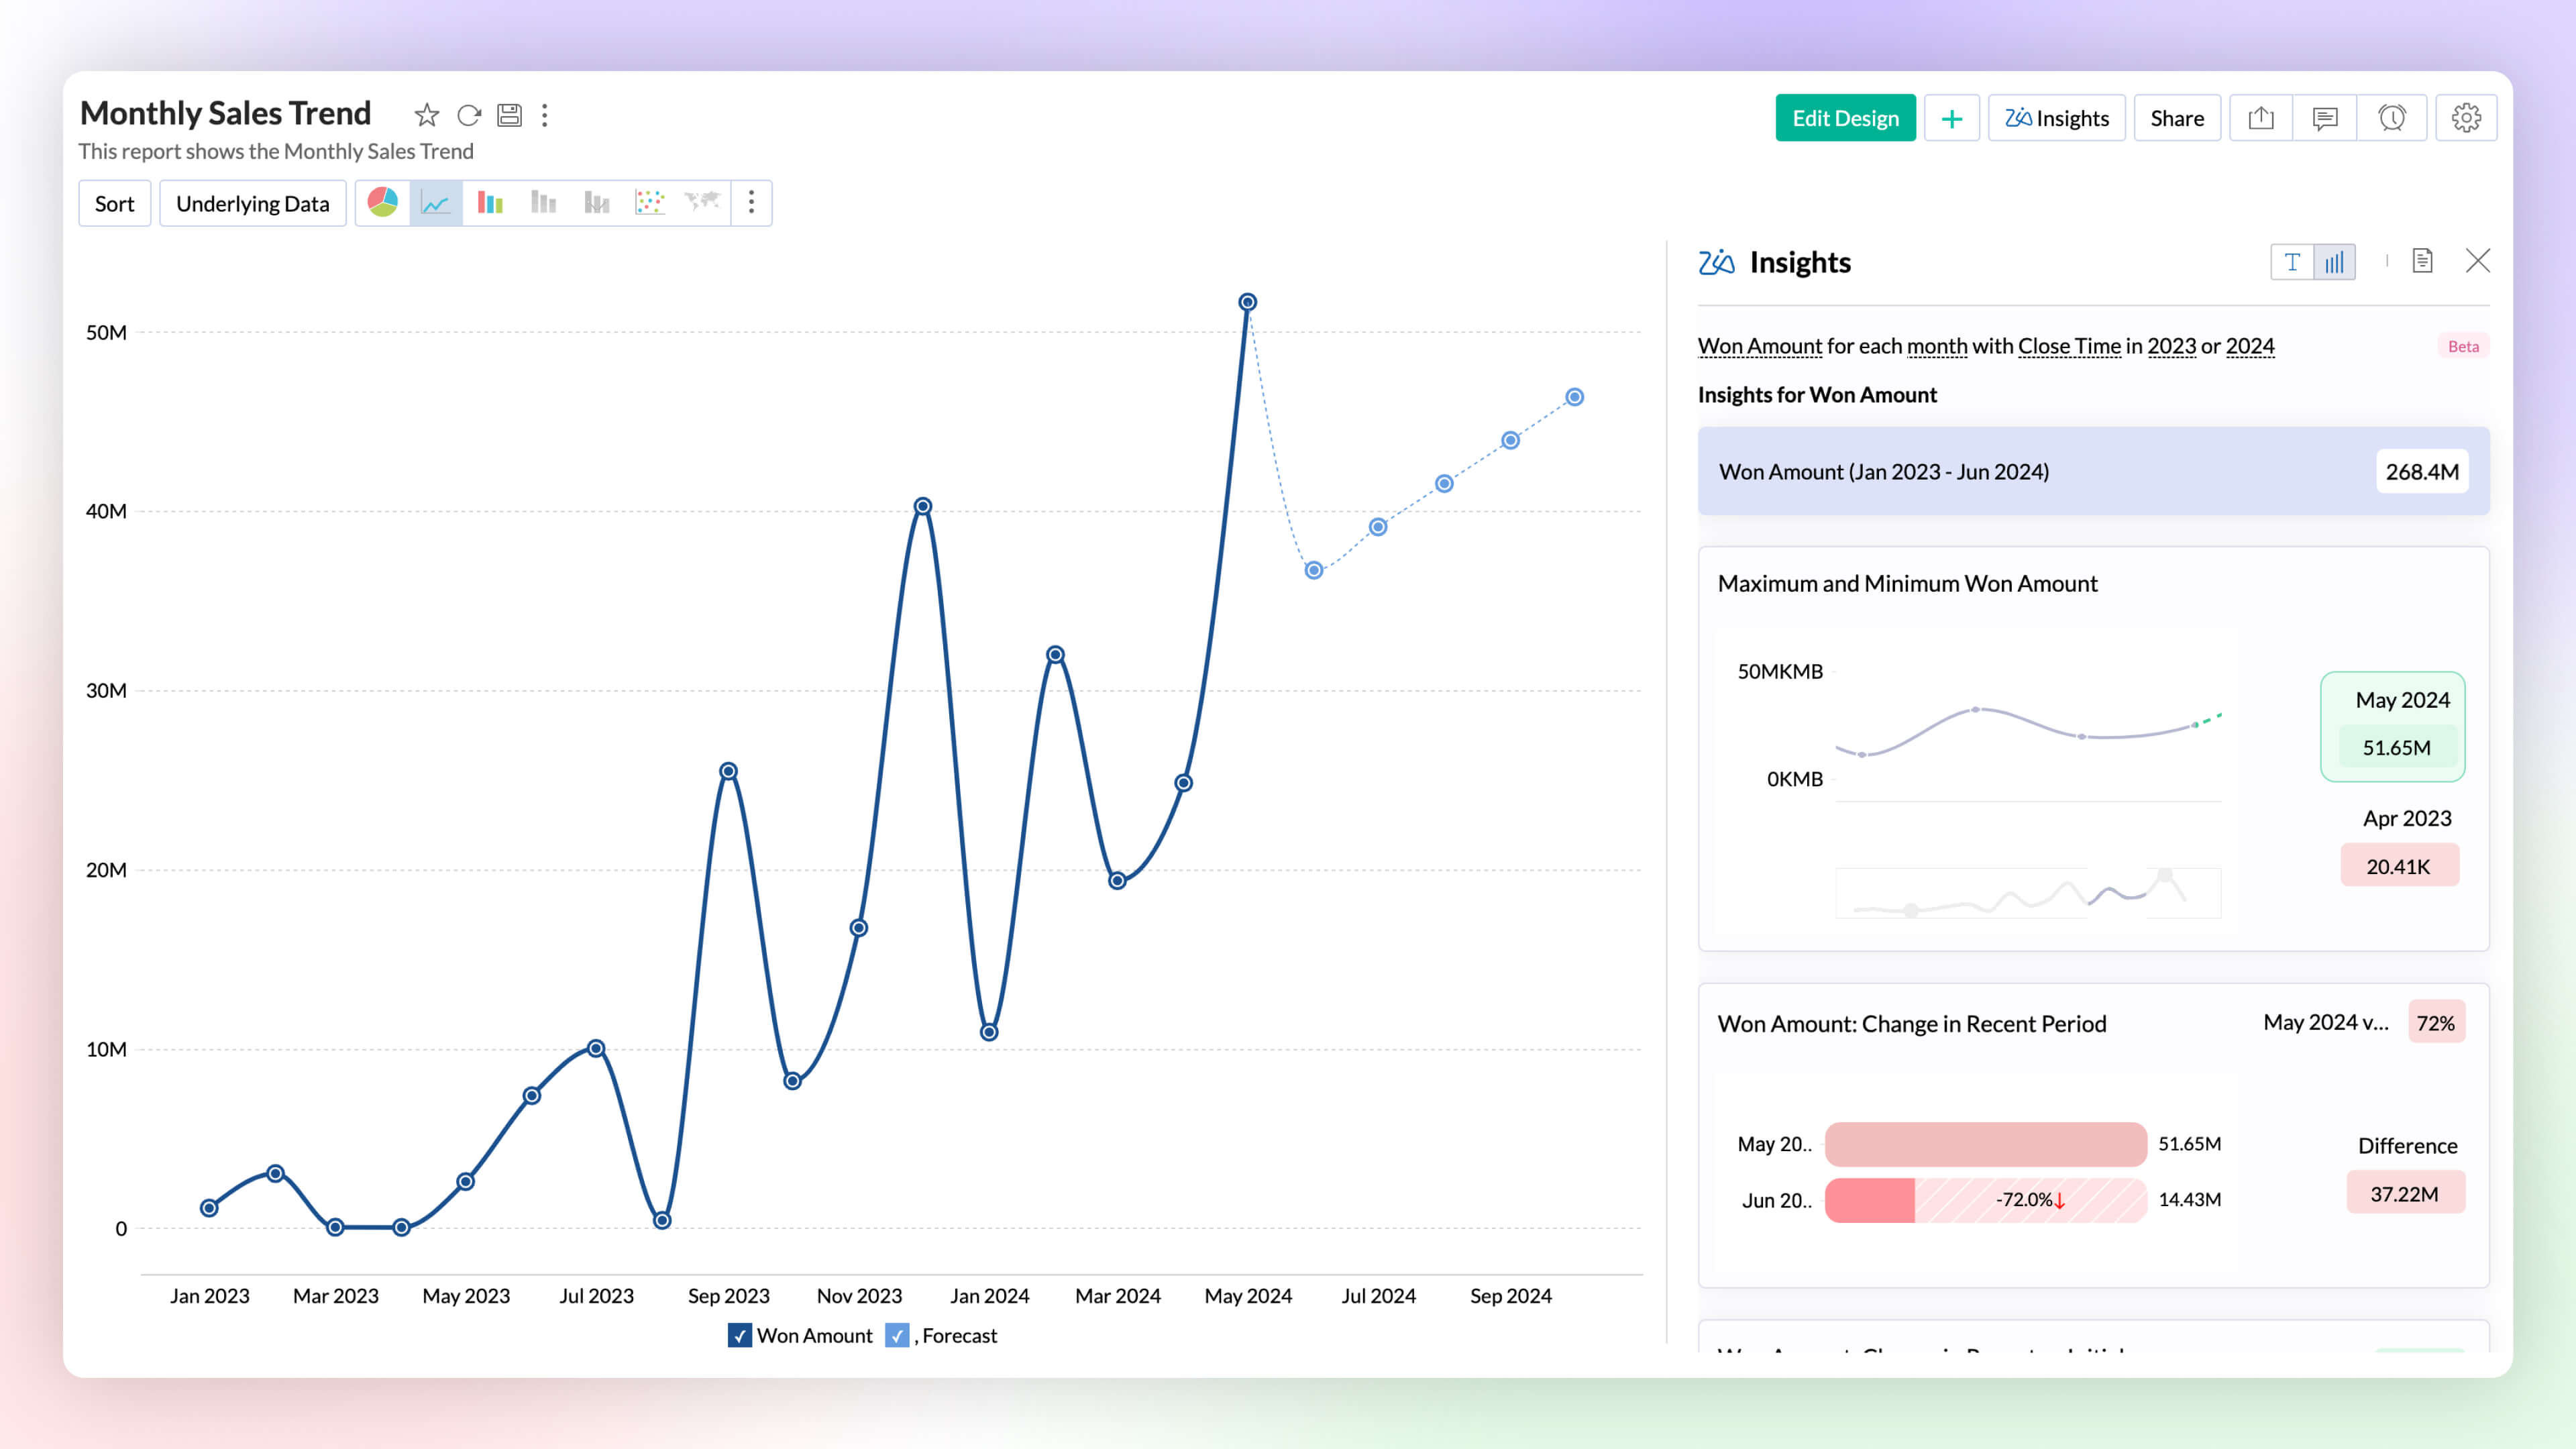
Visual Zia Insights
Zia Insights now provides visual narratives! Visuals help process information far more efficiently than lengthy text descriptions. These visuals facilitate multi-dimensional interpretations like comparison, contribution, distribution, trends and proportions.
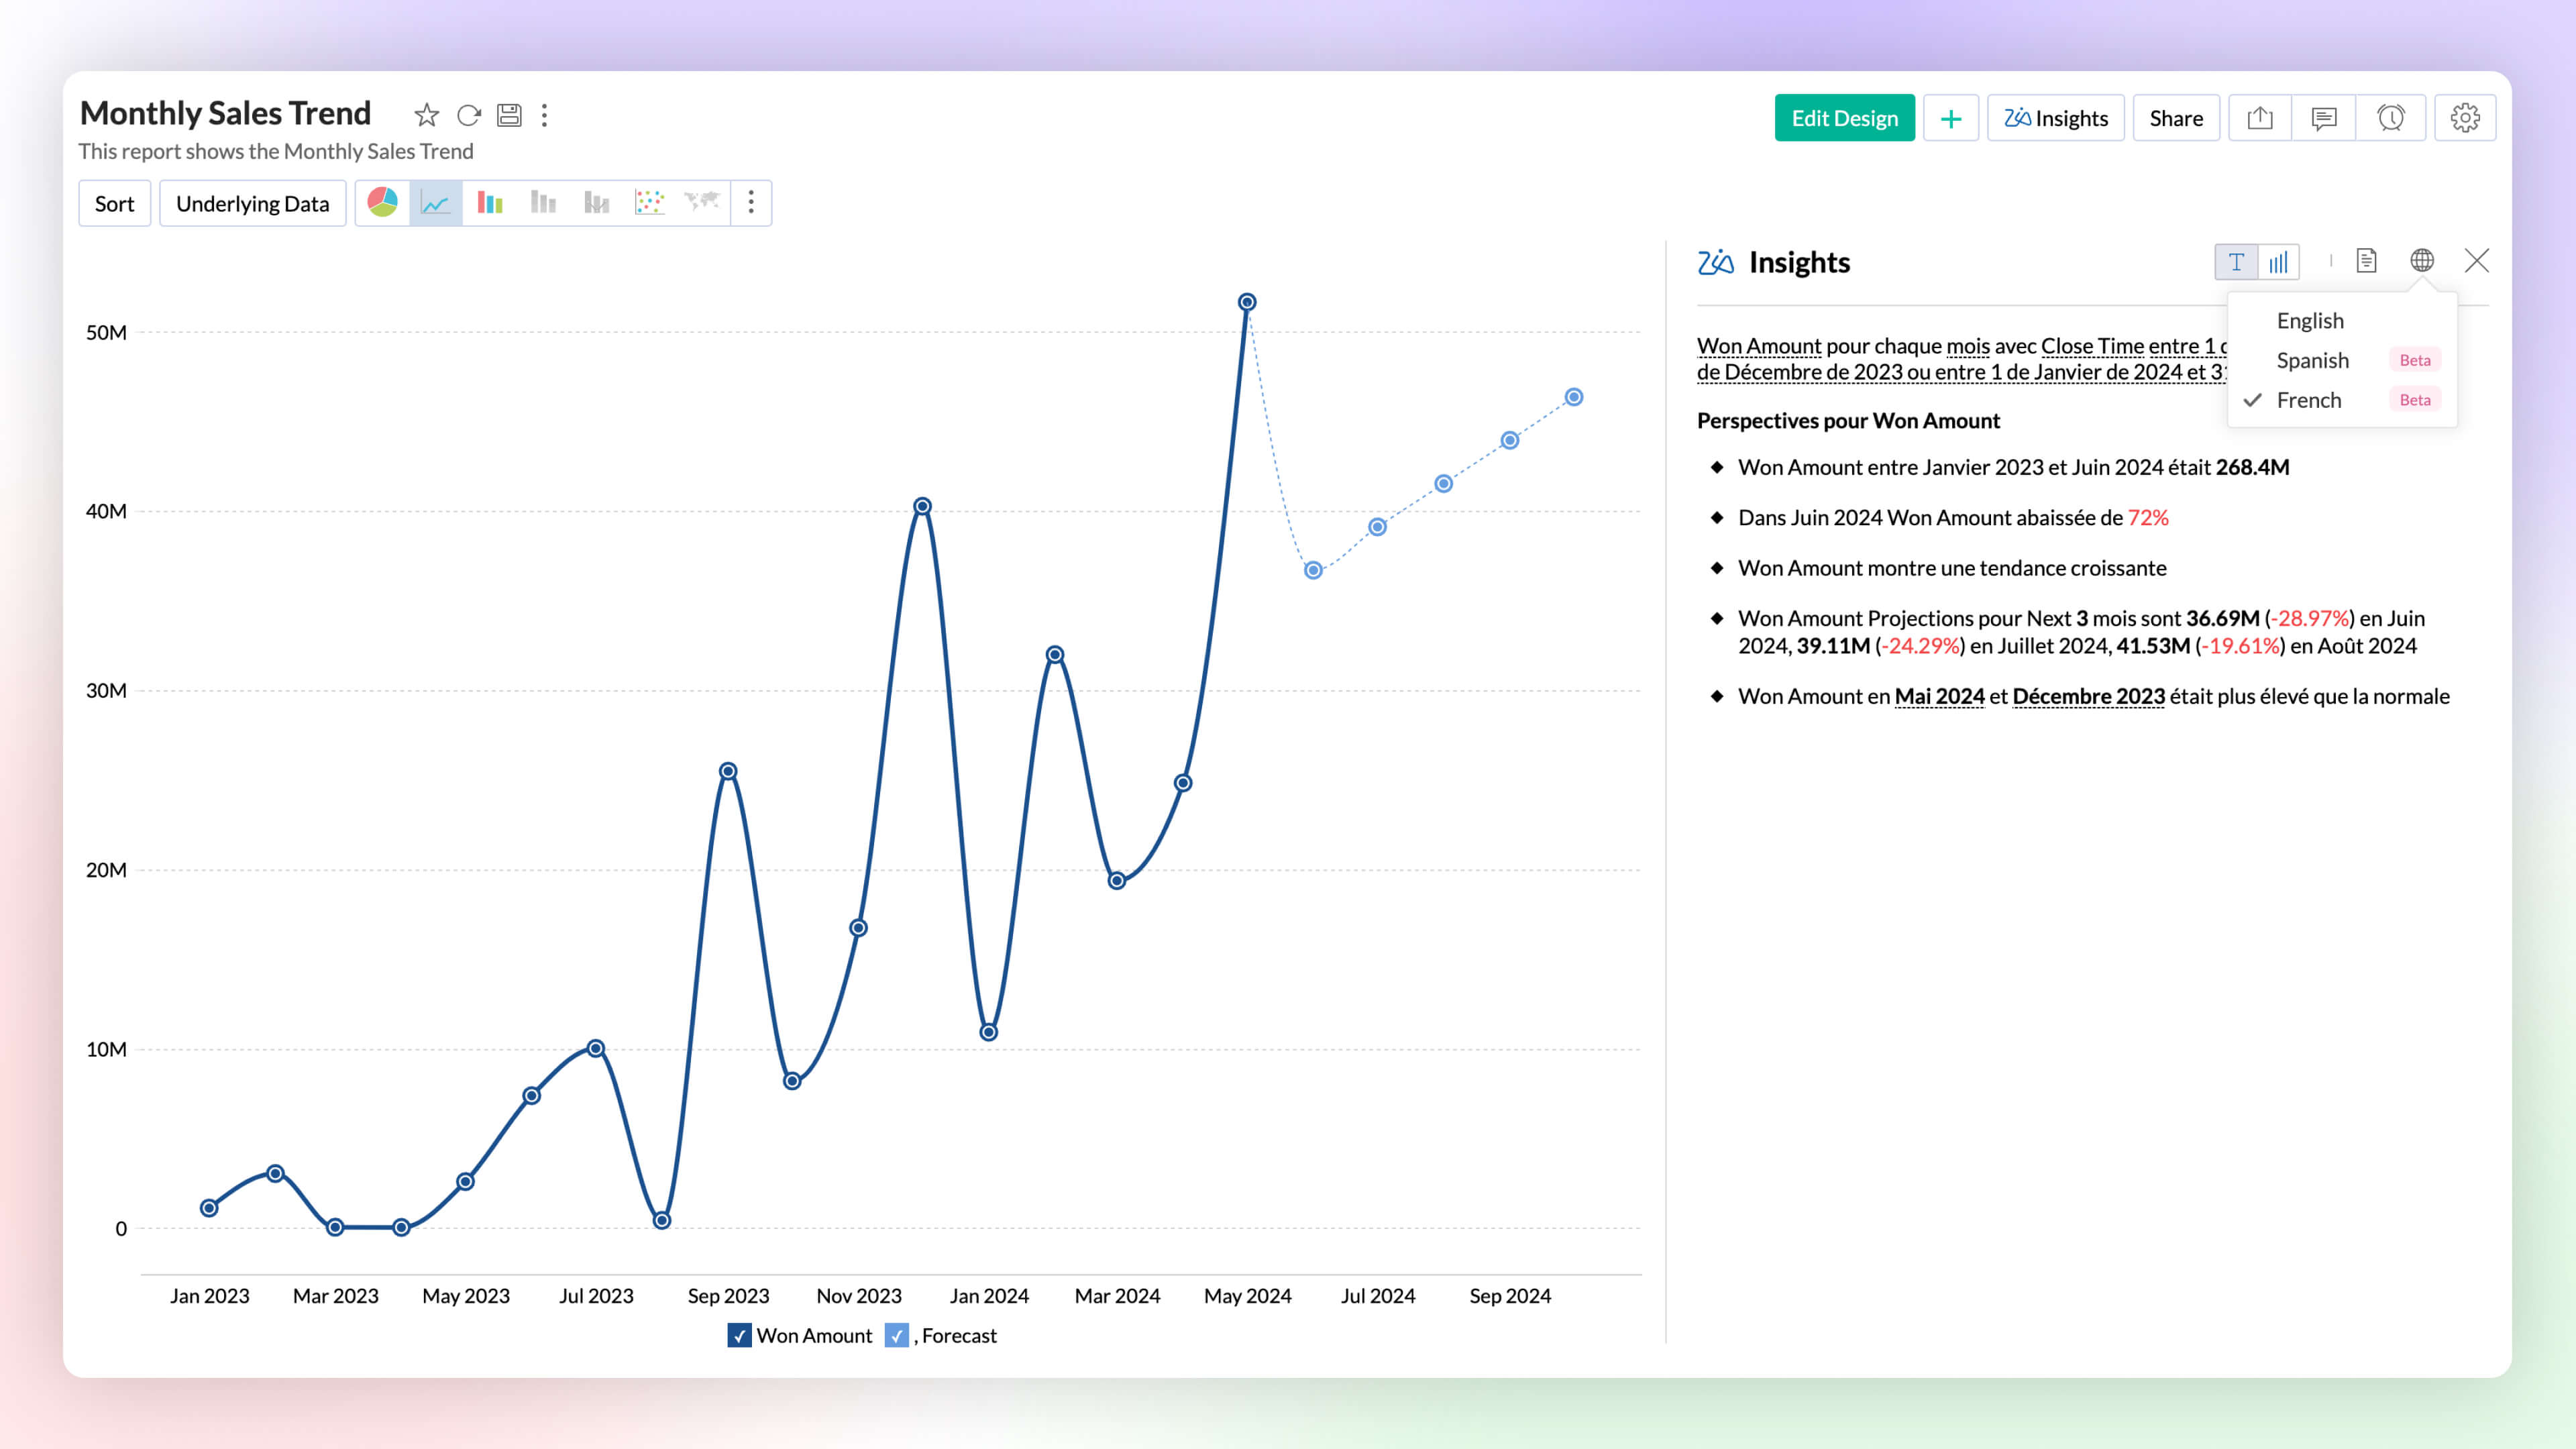
Zia Insights -Multilingual Support
Zia Insights is now available in French and Spanish. Users can choose their preferred language when accessing Zia Insights for a specific report.
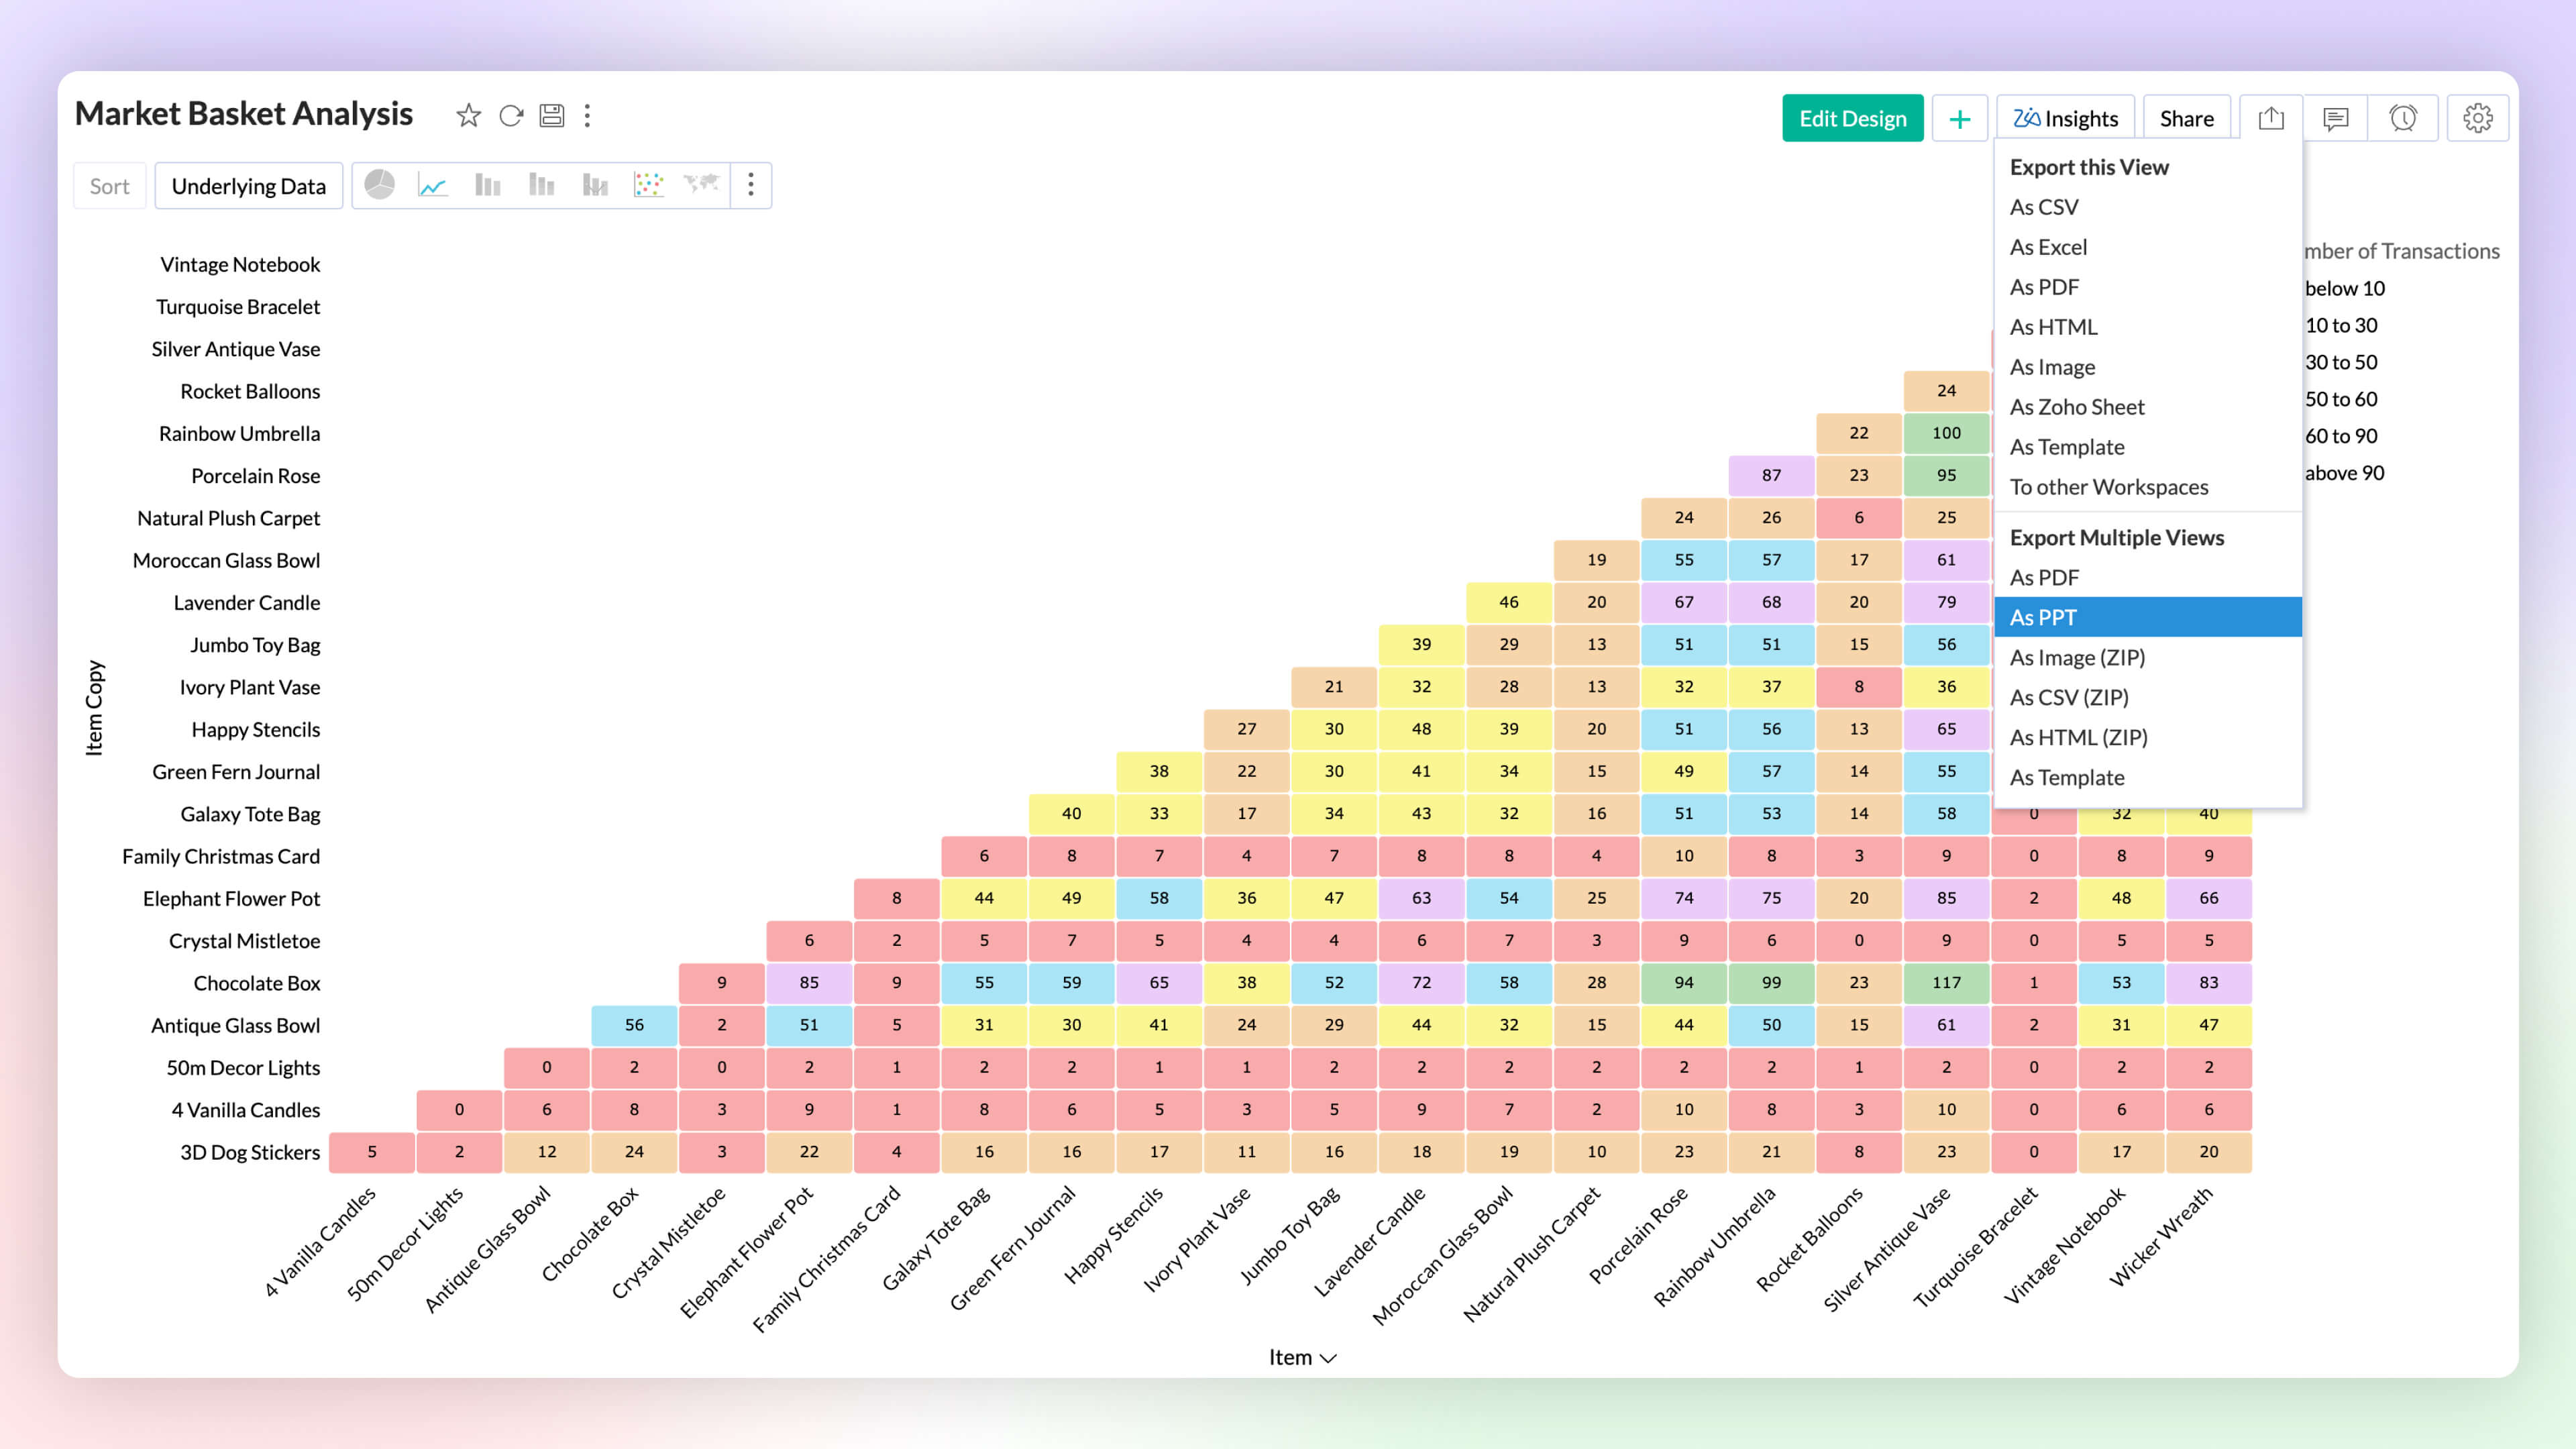
Export as PPT
Export multiple views as a Microsoft PowerPoint presentation. Enhance security by protecting the file with a password.
6. More enhancements
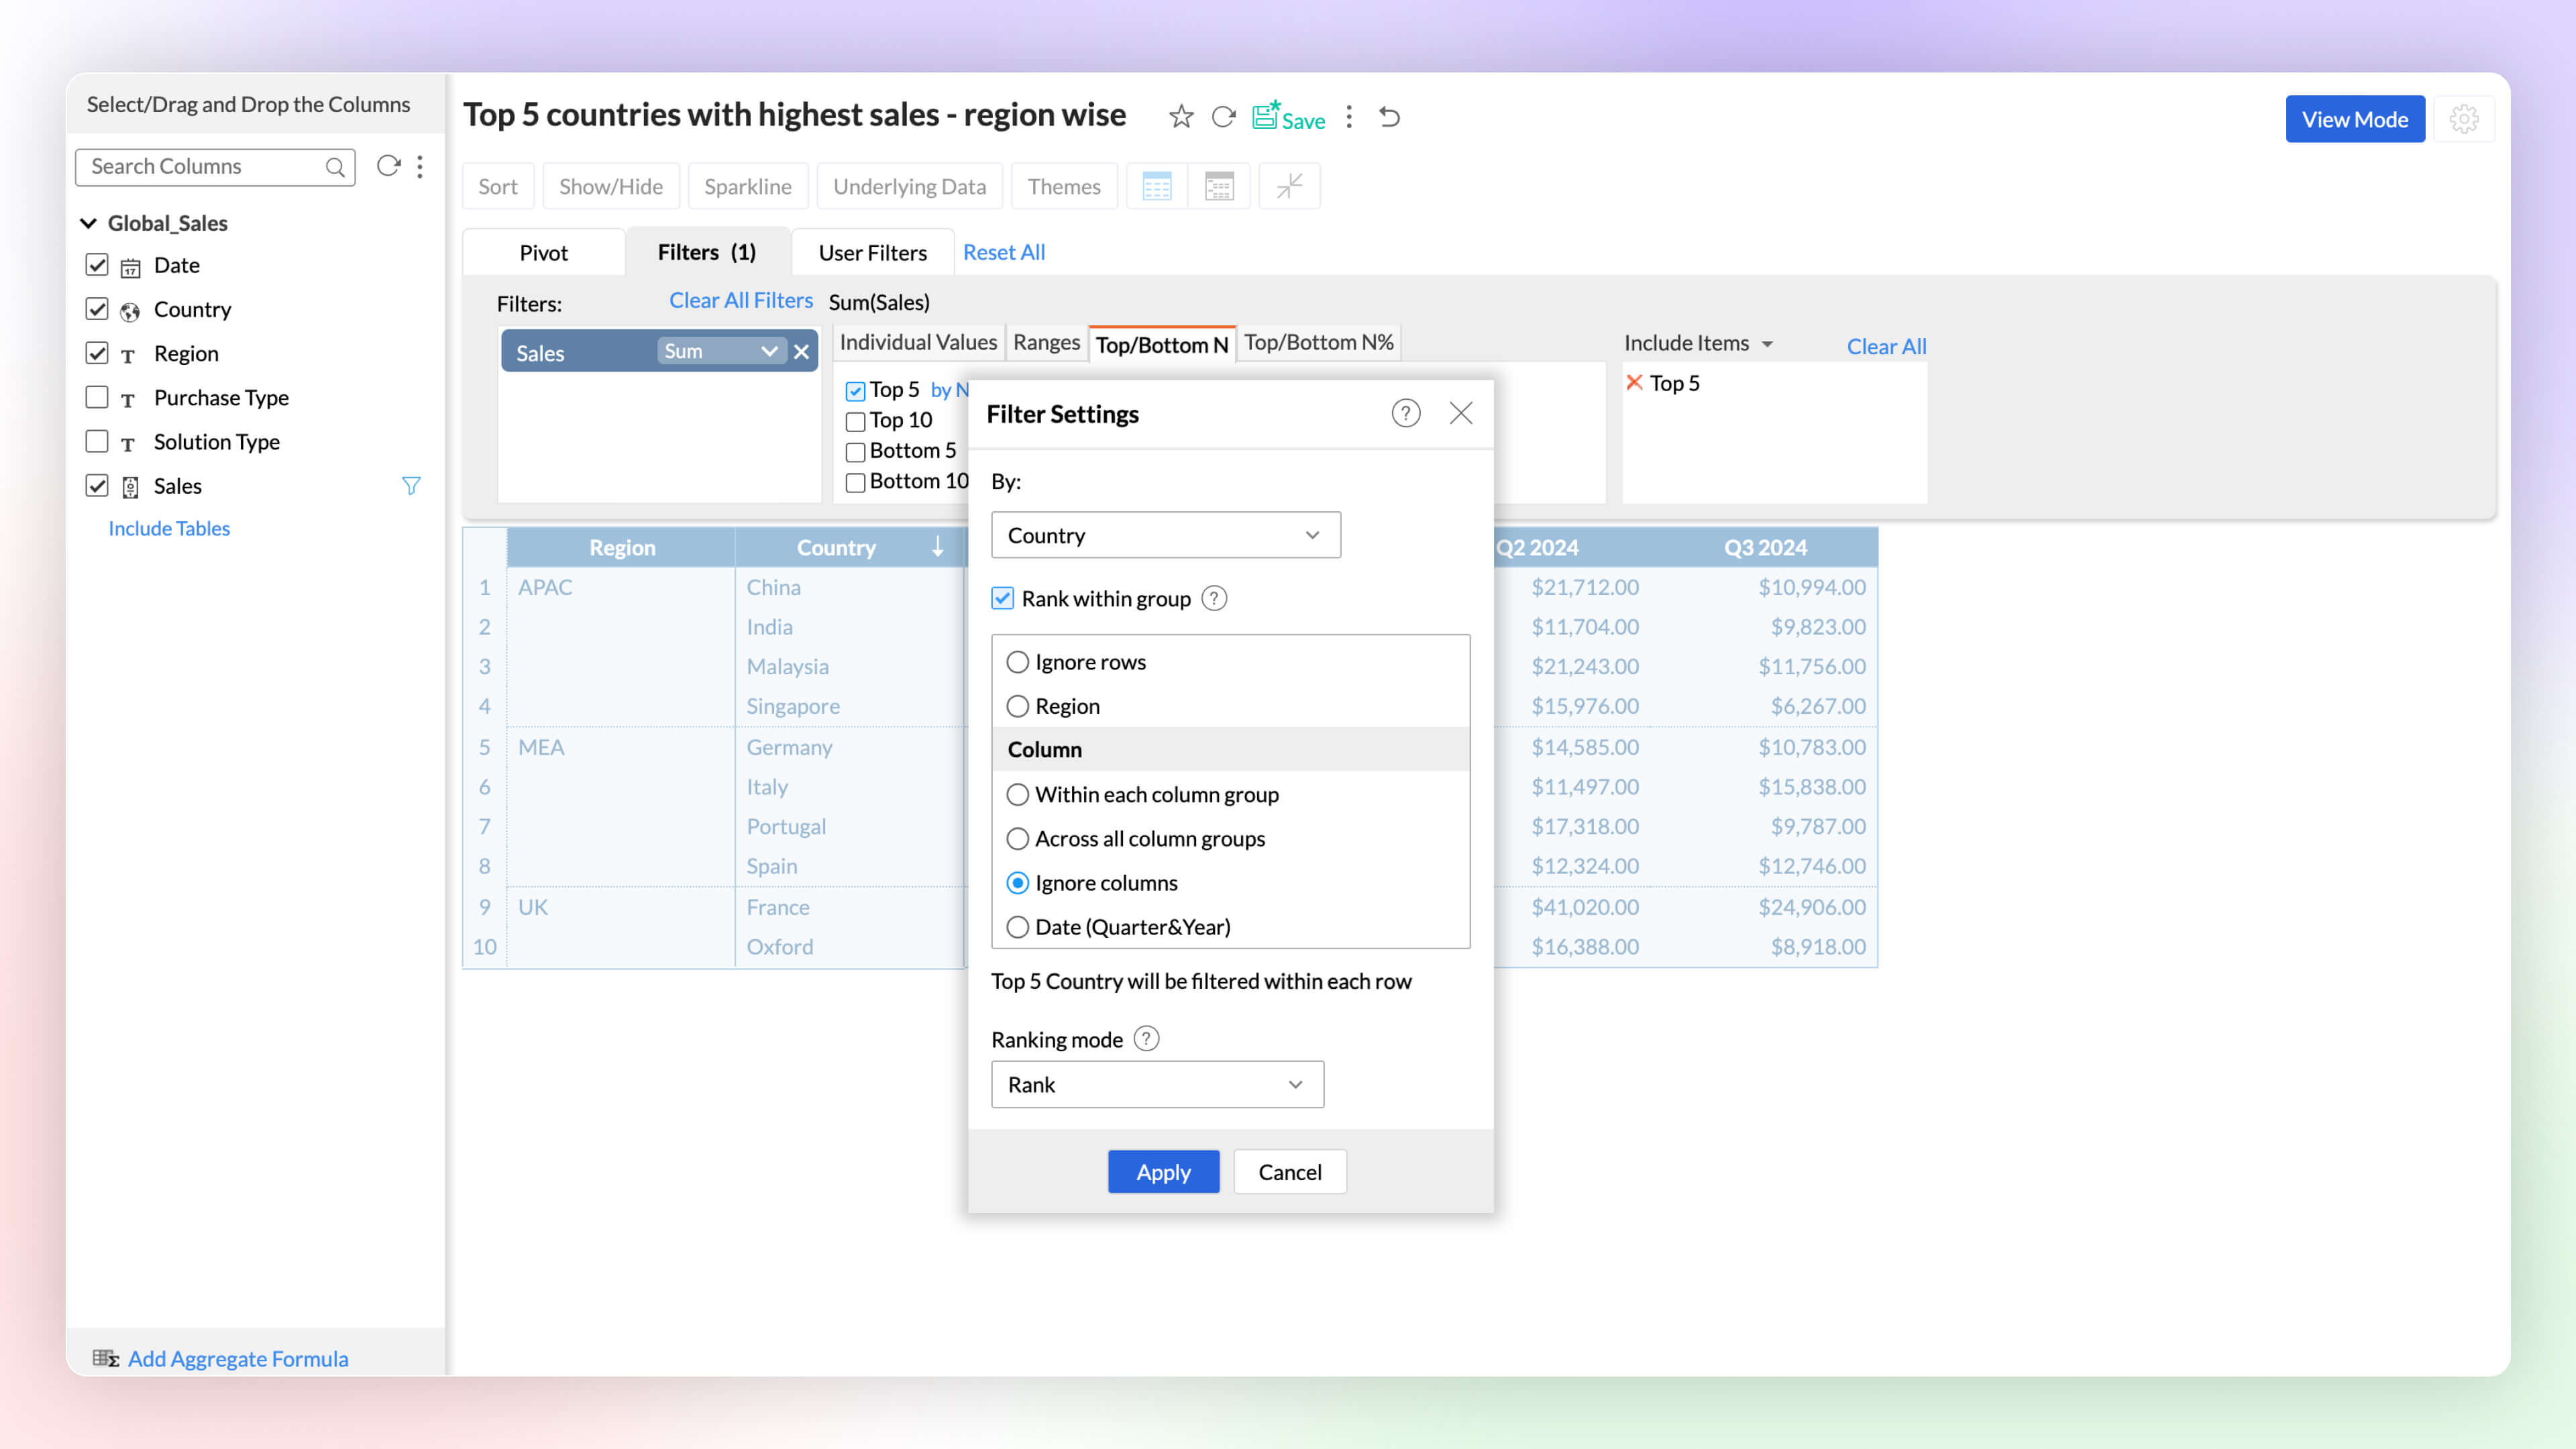
Rank within Data
Identify and analyze top and bottom performers across various dimensions. The rank-based ability helps find the top or bottom performers within and across individual groups without having to write complex formulas.
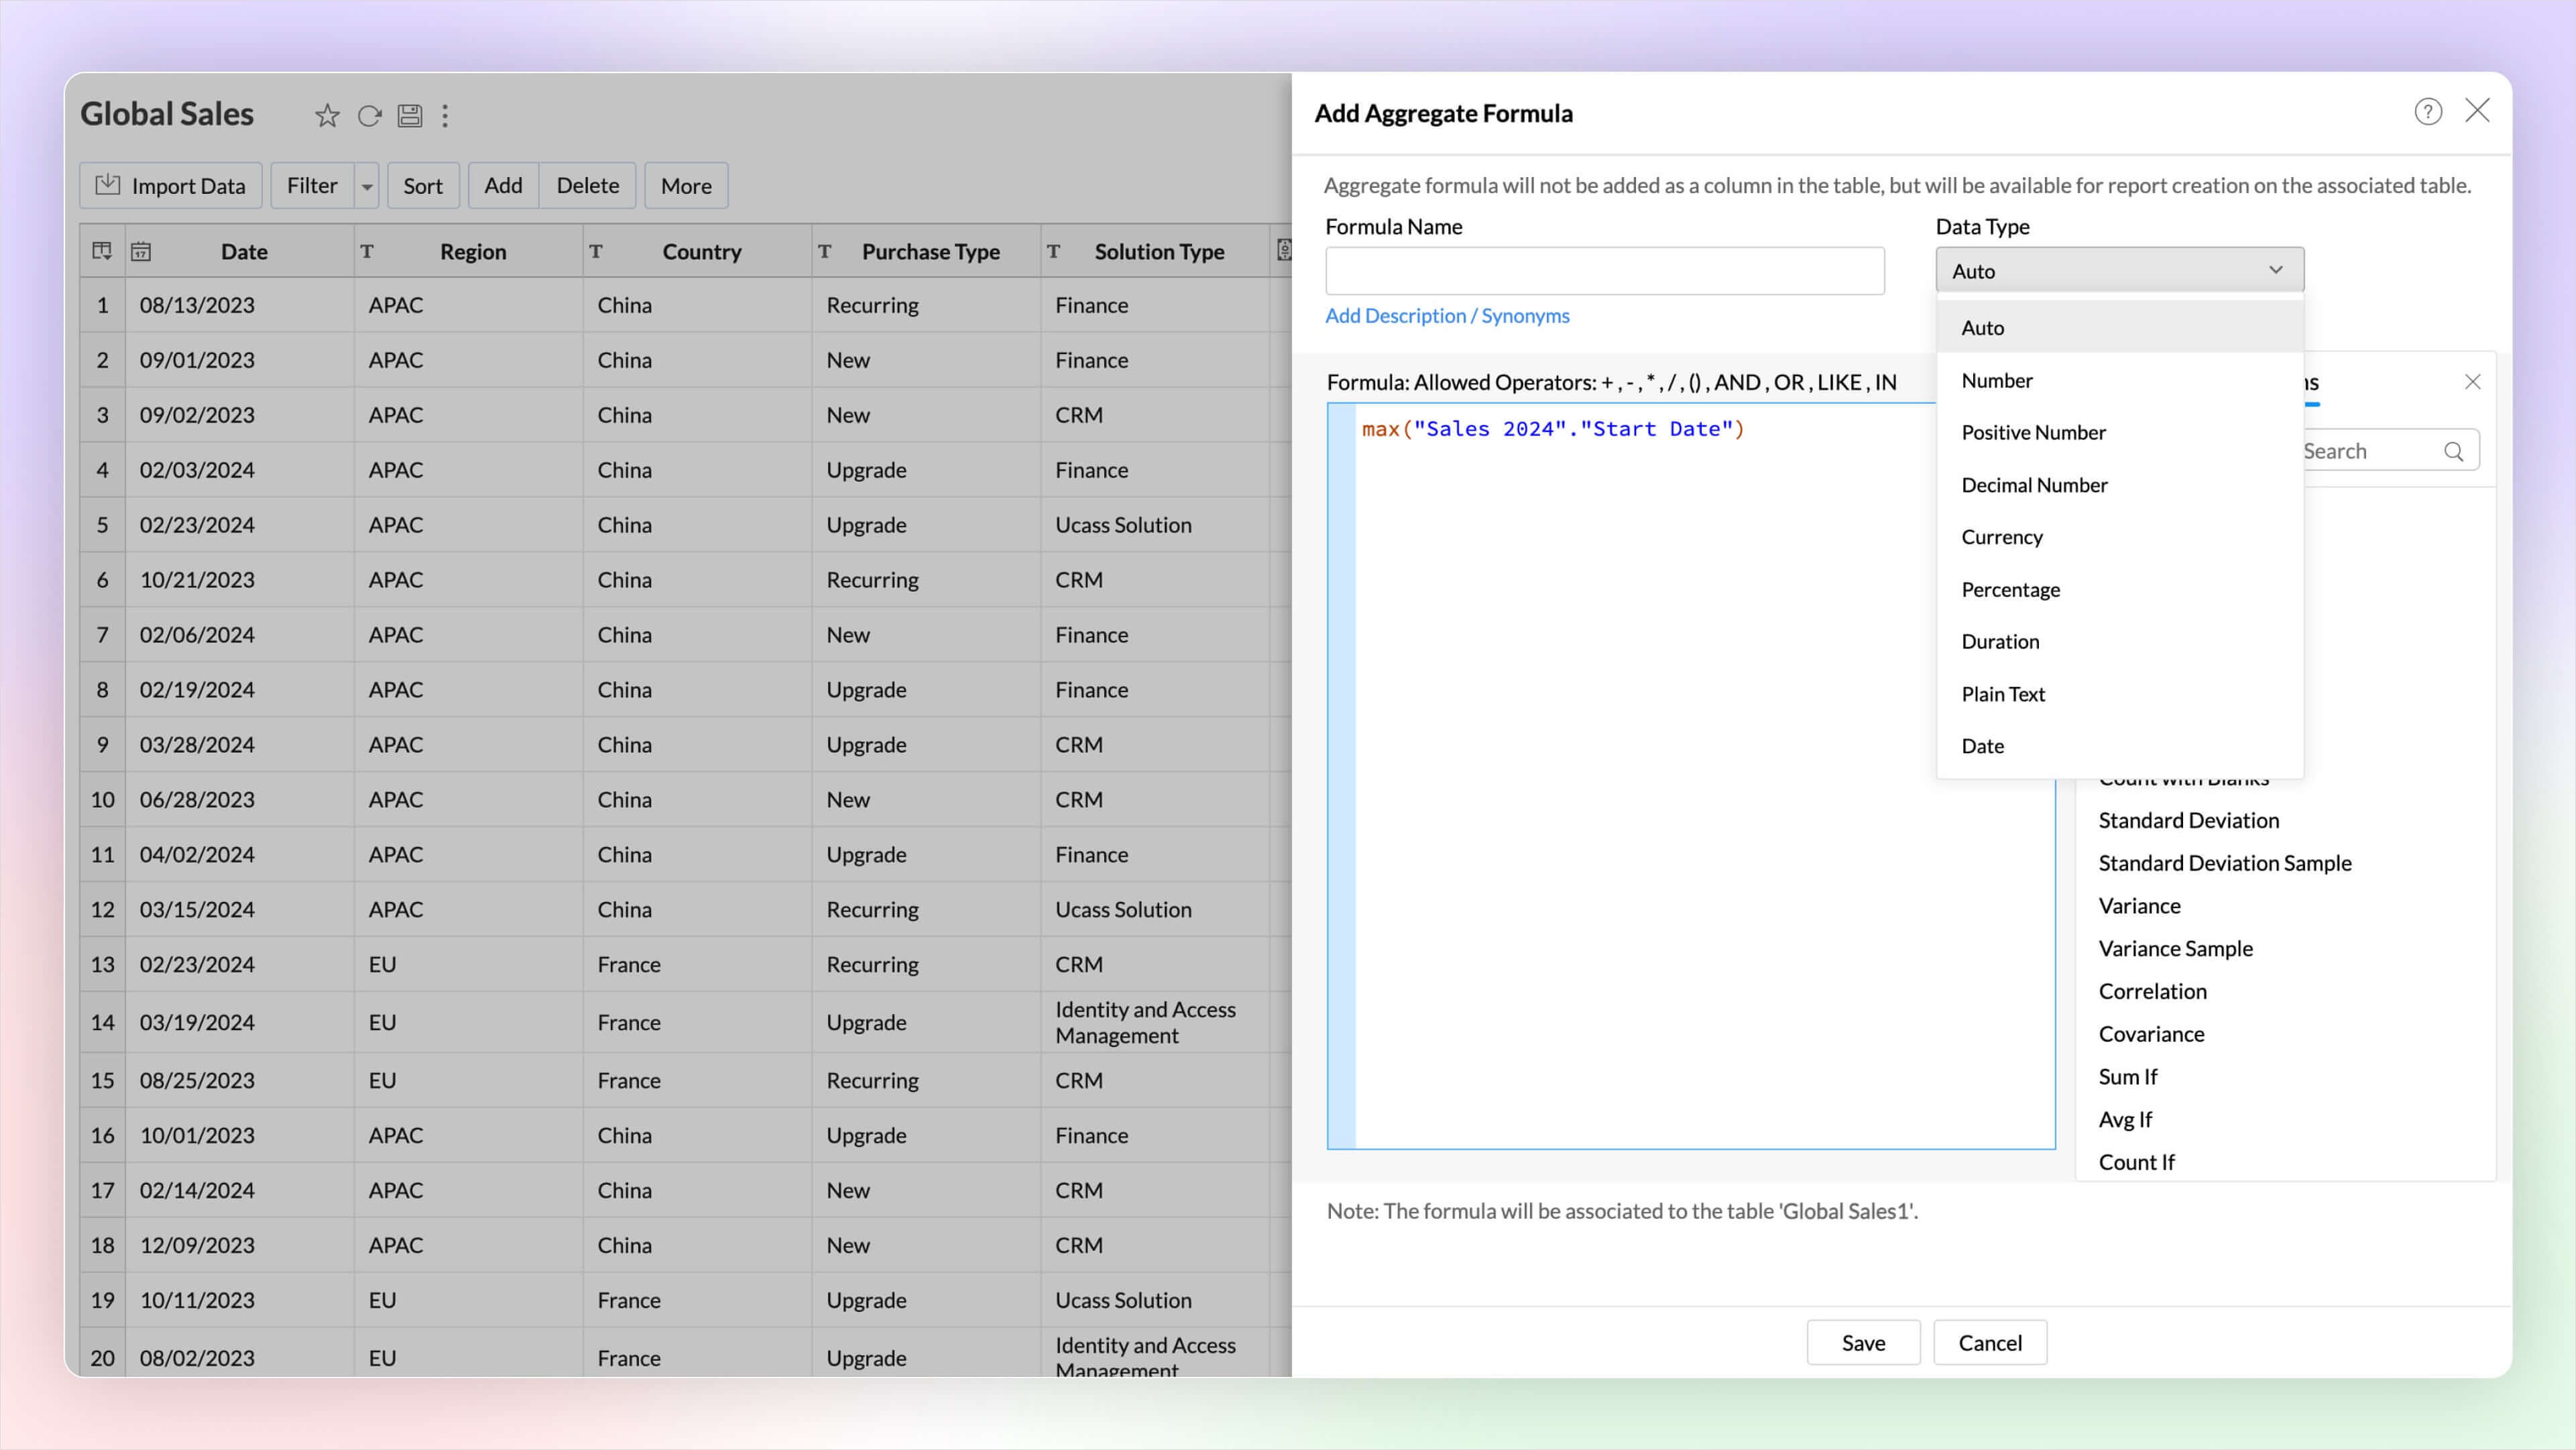
Date and String data types in Aggregate Formula
Zoho Analytics now supports the date and plain text as return data types in aggregate functions. This improvement proves immensely beneficial in scenarios such as cohort analysis, project milestone tracking, and various other use cases.
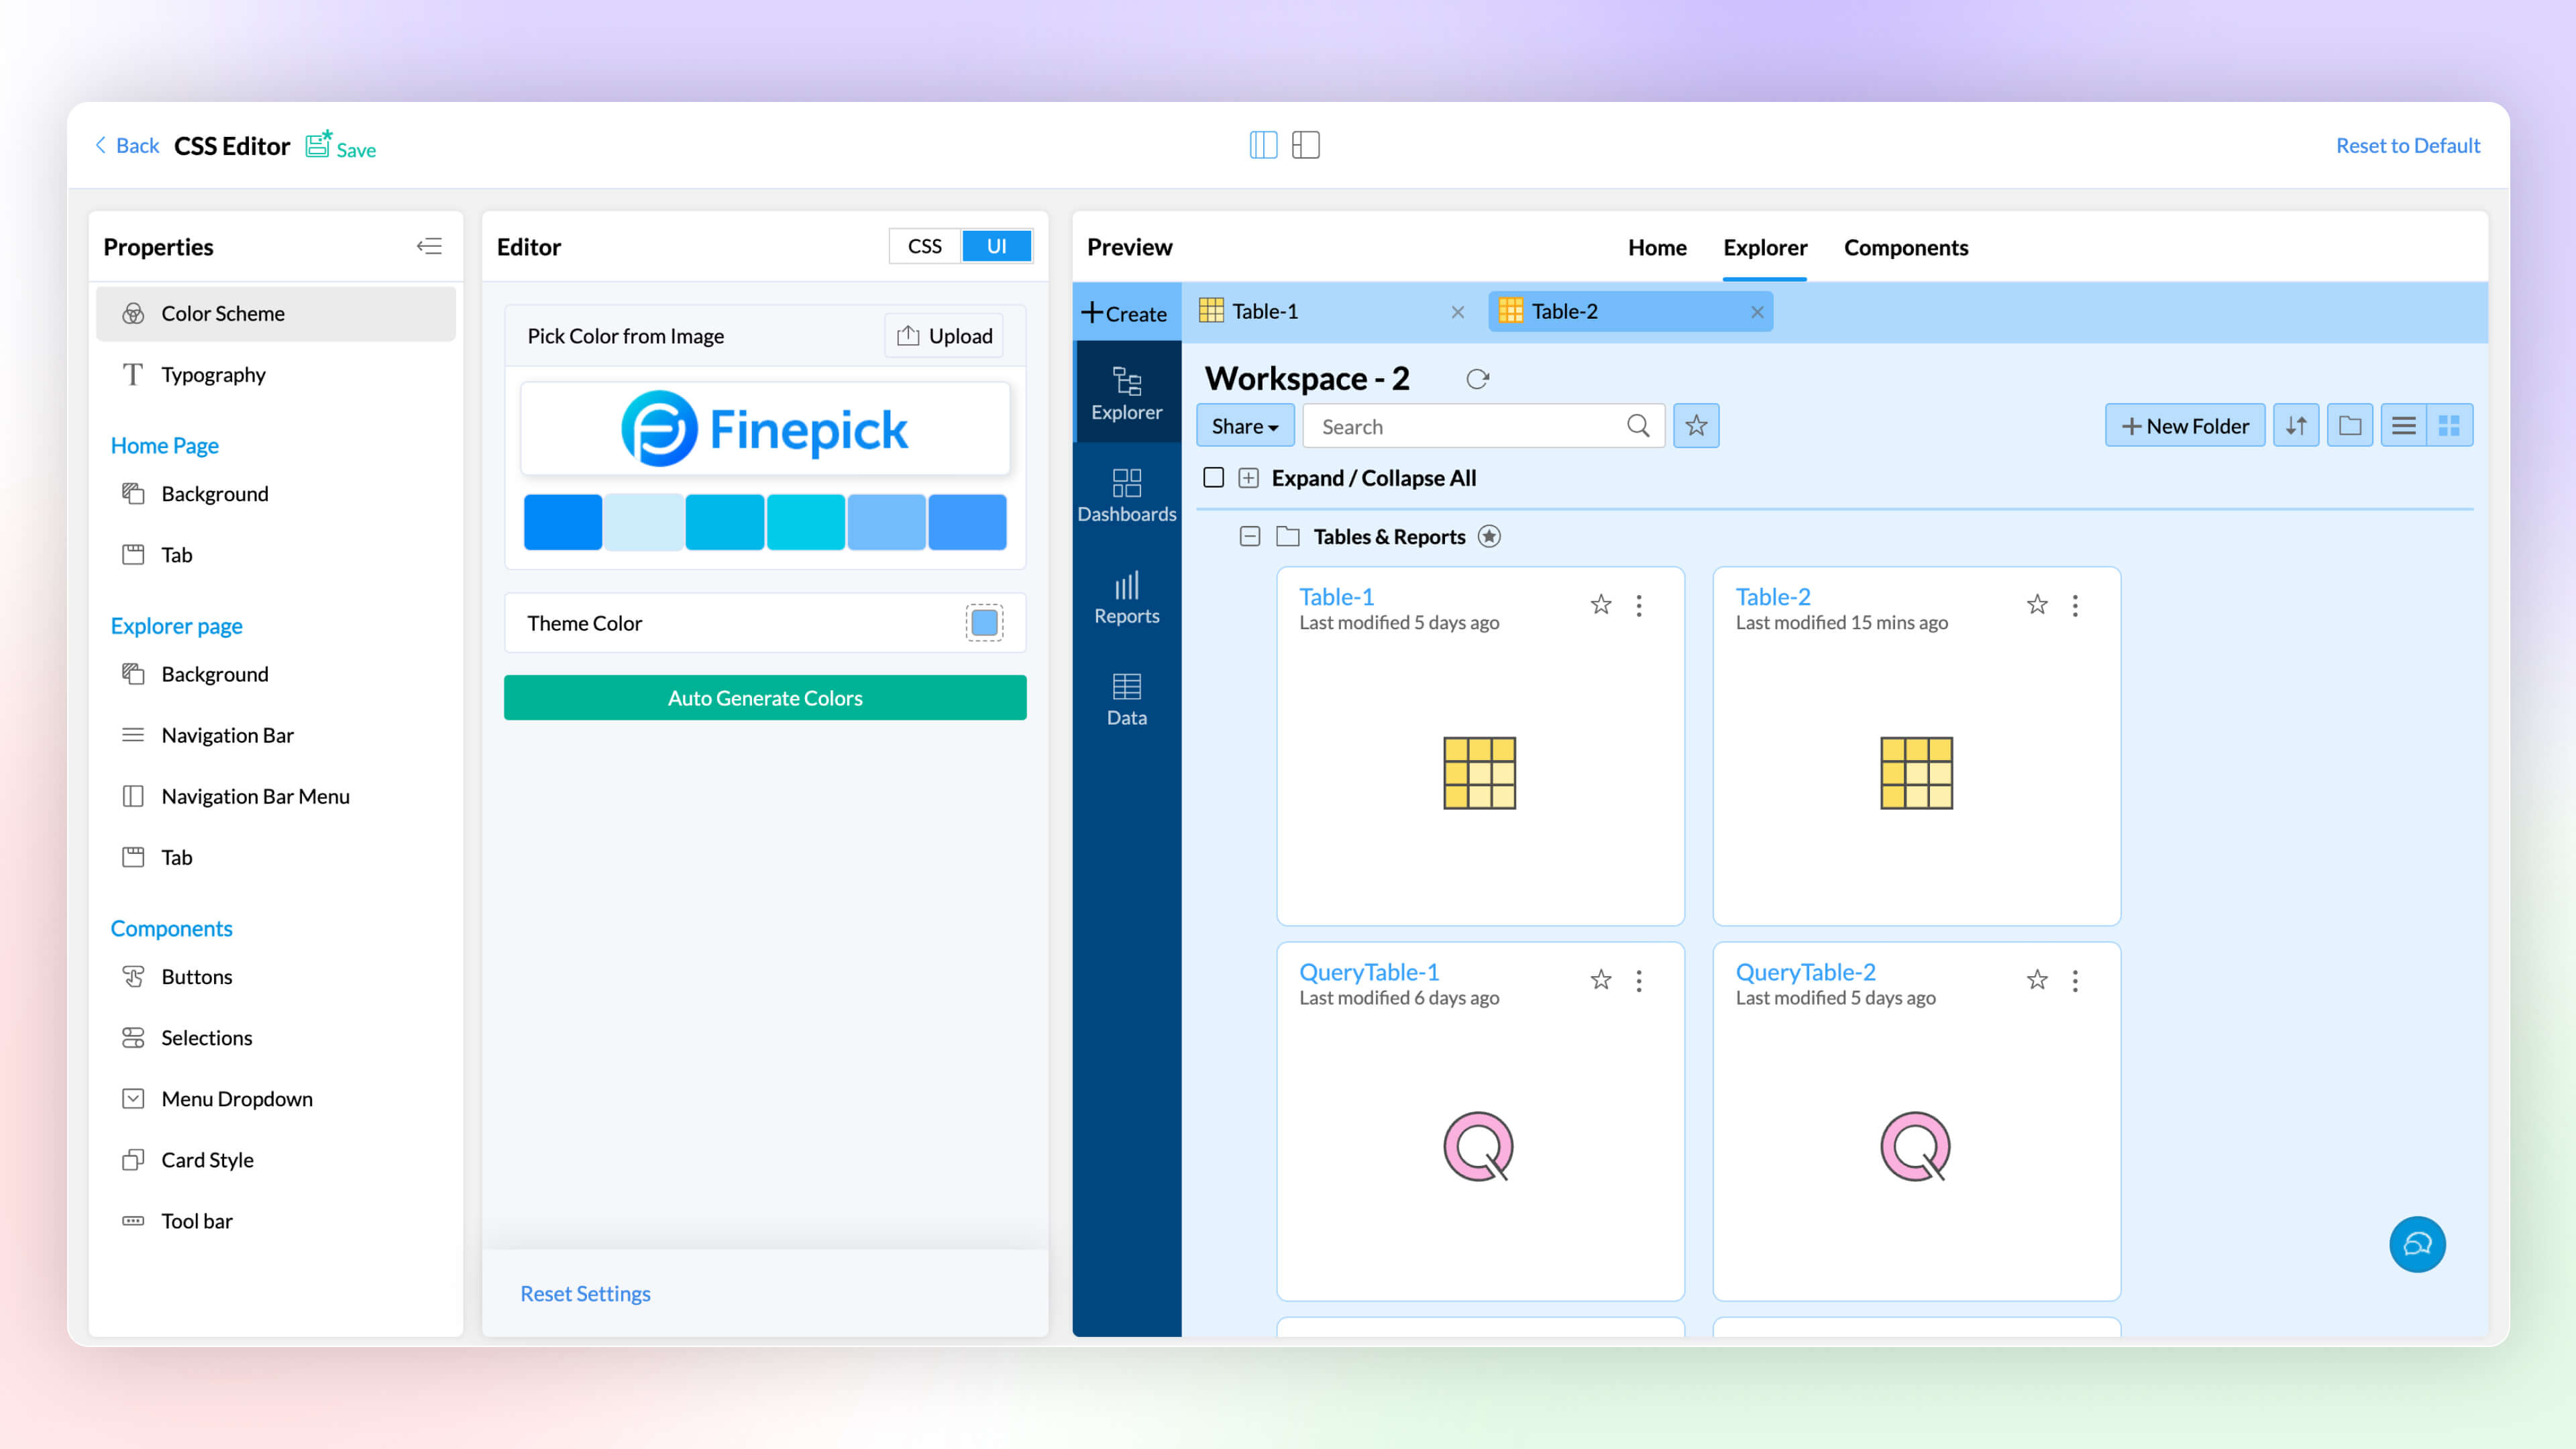
White Label CSS Customization
Elevate the visual appeal of your white labeled product and align it with your brand through the CSS customization feature. This latest addition to Zoho Analytics enables you to customize text, colors, and more on pages, tabs, selections, hover options, enhancing the overall look and feel.
Right to Left User Interface
Zoho Analytics now supports a right to left user interface. This option is best suited for languages like Arabic and Hebrew that are read from right to left.
Security
At Zoho Analytics, ensuring data privacy and security remains our topmost priority. We have implemented additional measures to strengthen security through the following enhancements.
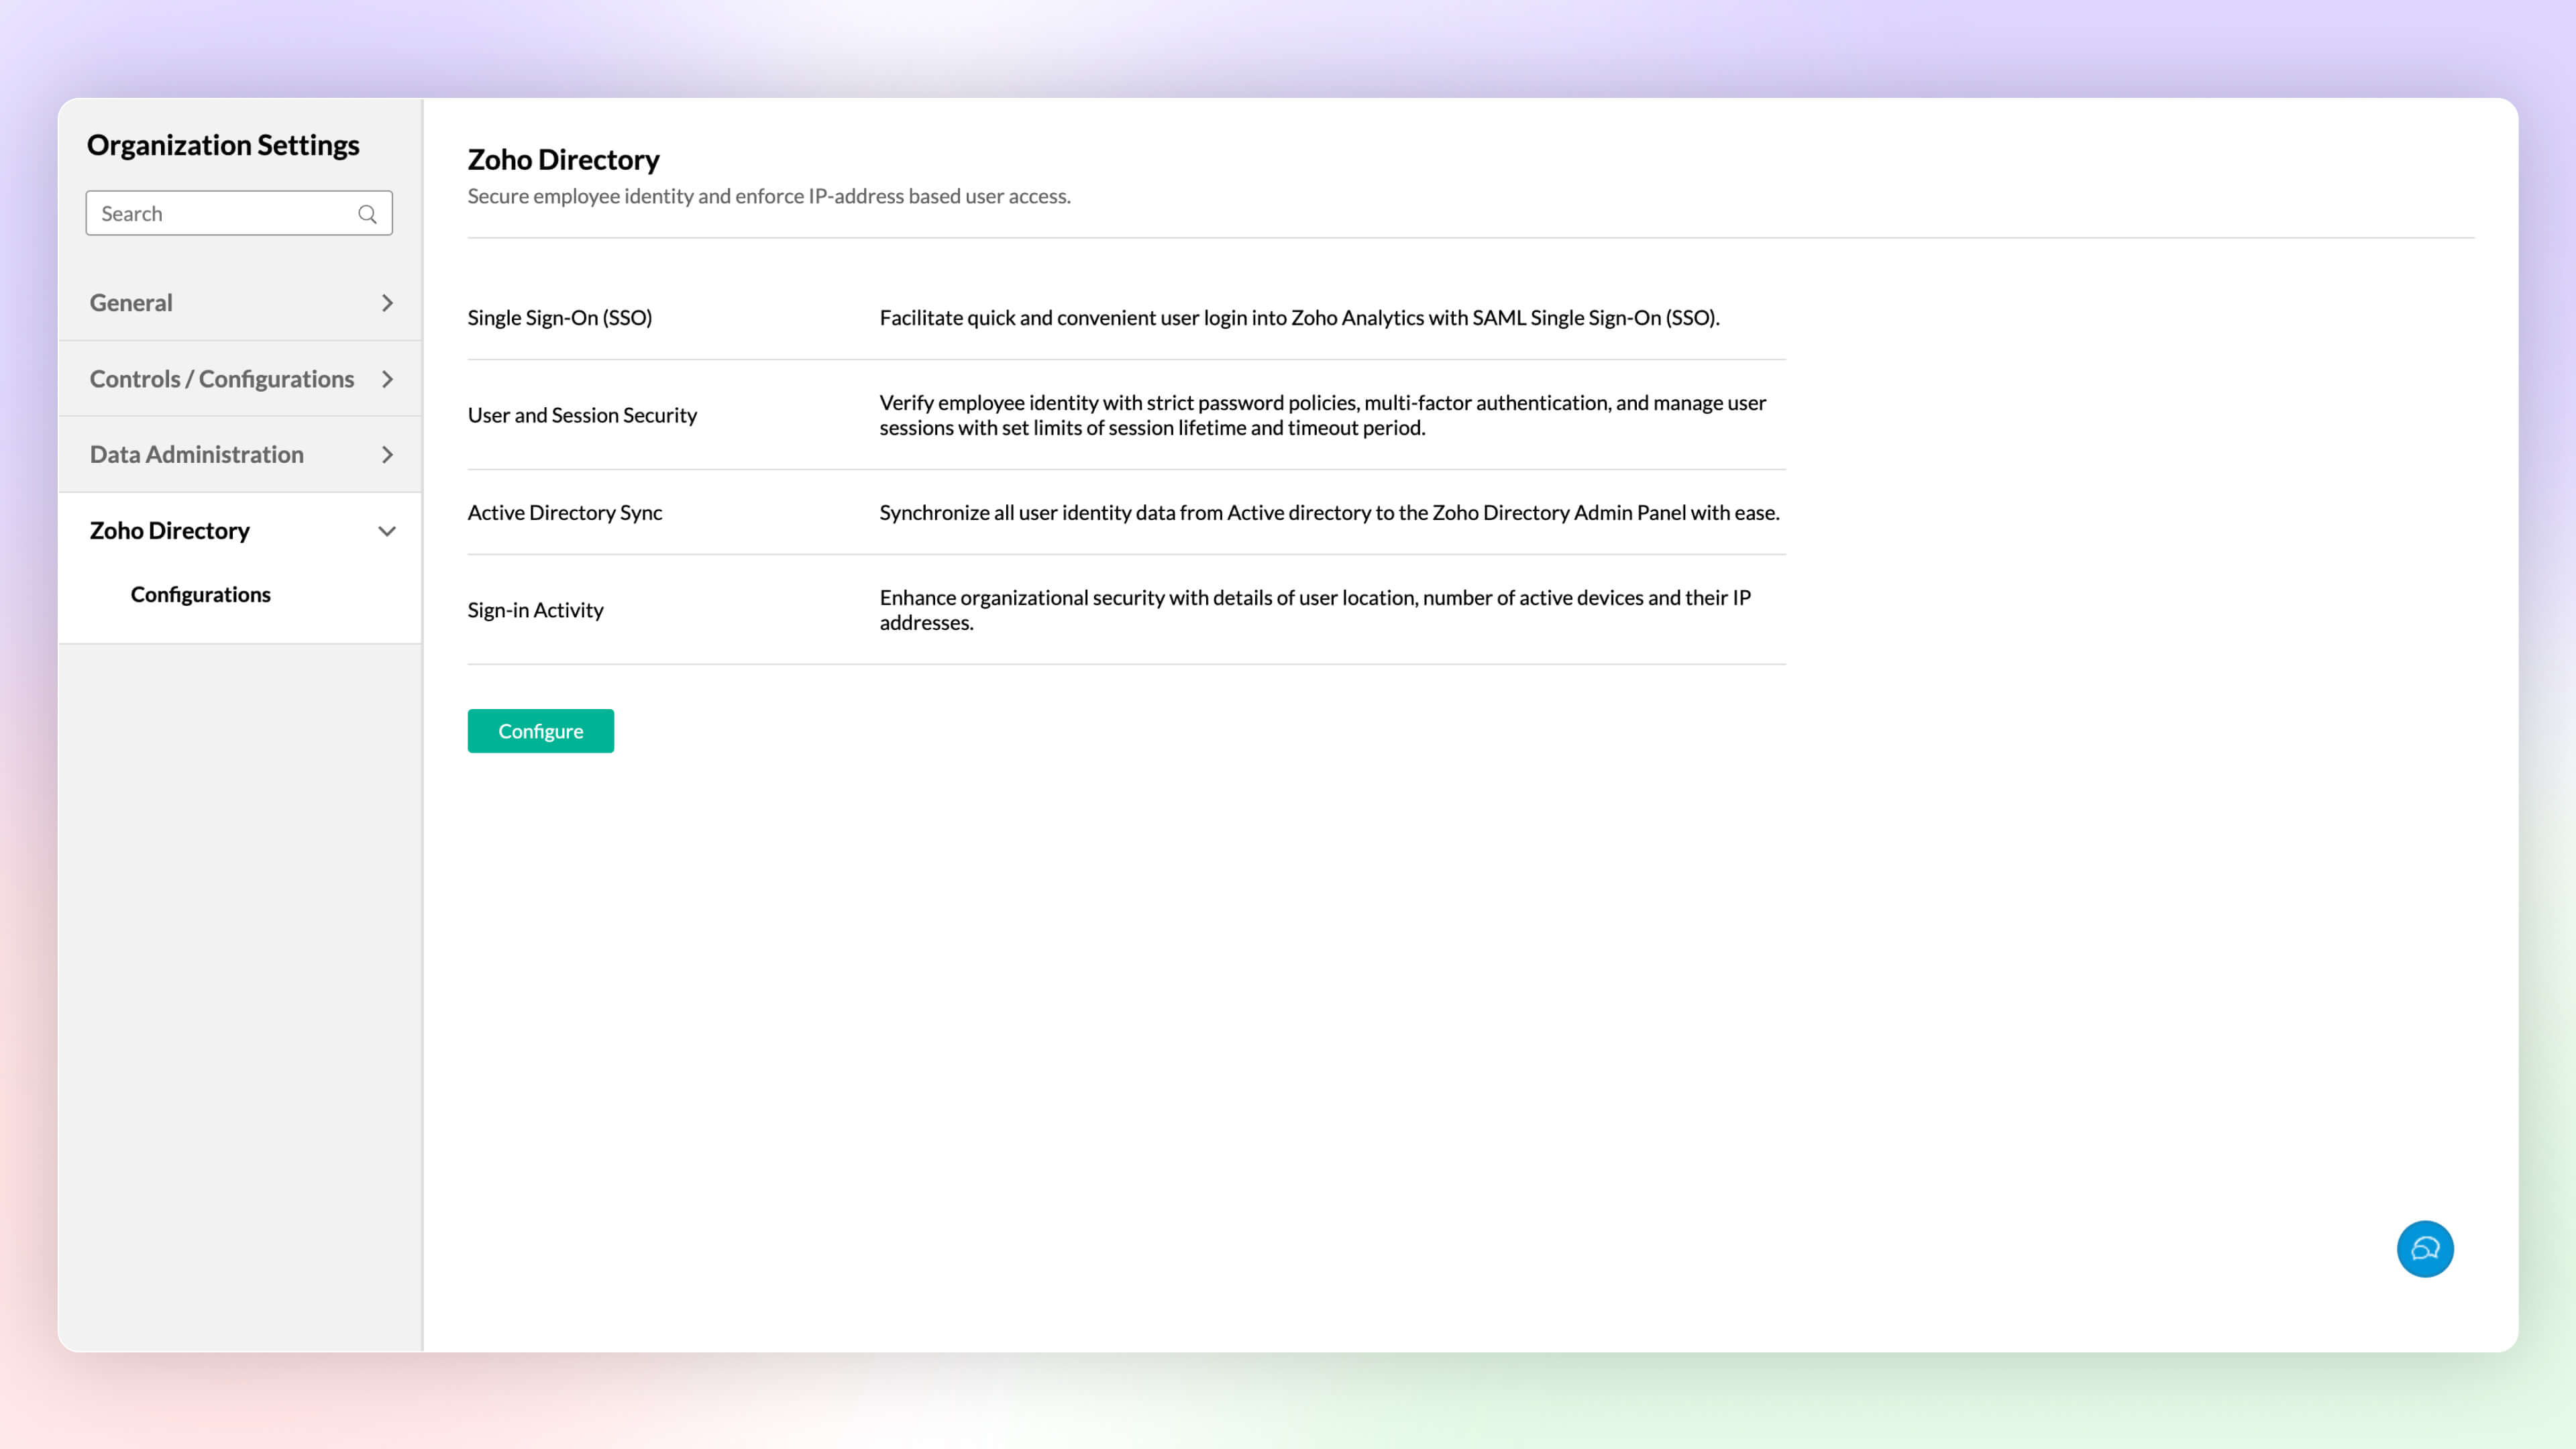
Zoho Directory
Zoho Analytics' integration with Zoho Directory allows administrators to handle identity and user access management with ease. You can now easily setup Single Sign-on, setup Active Directory sync, manage user access, etc.,with Zoho Directory.
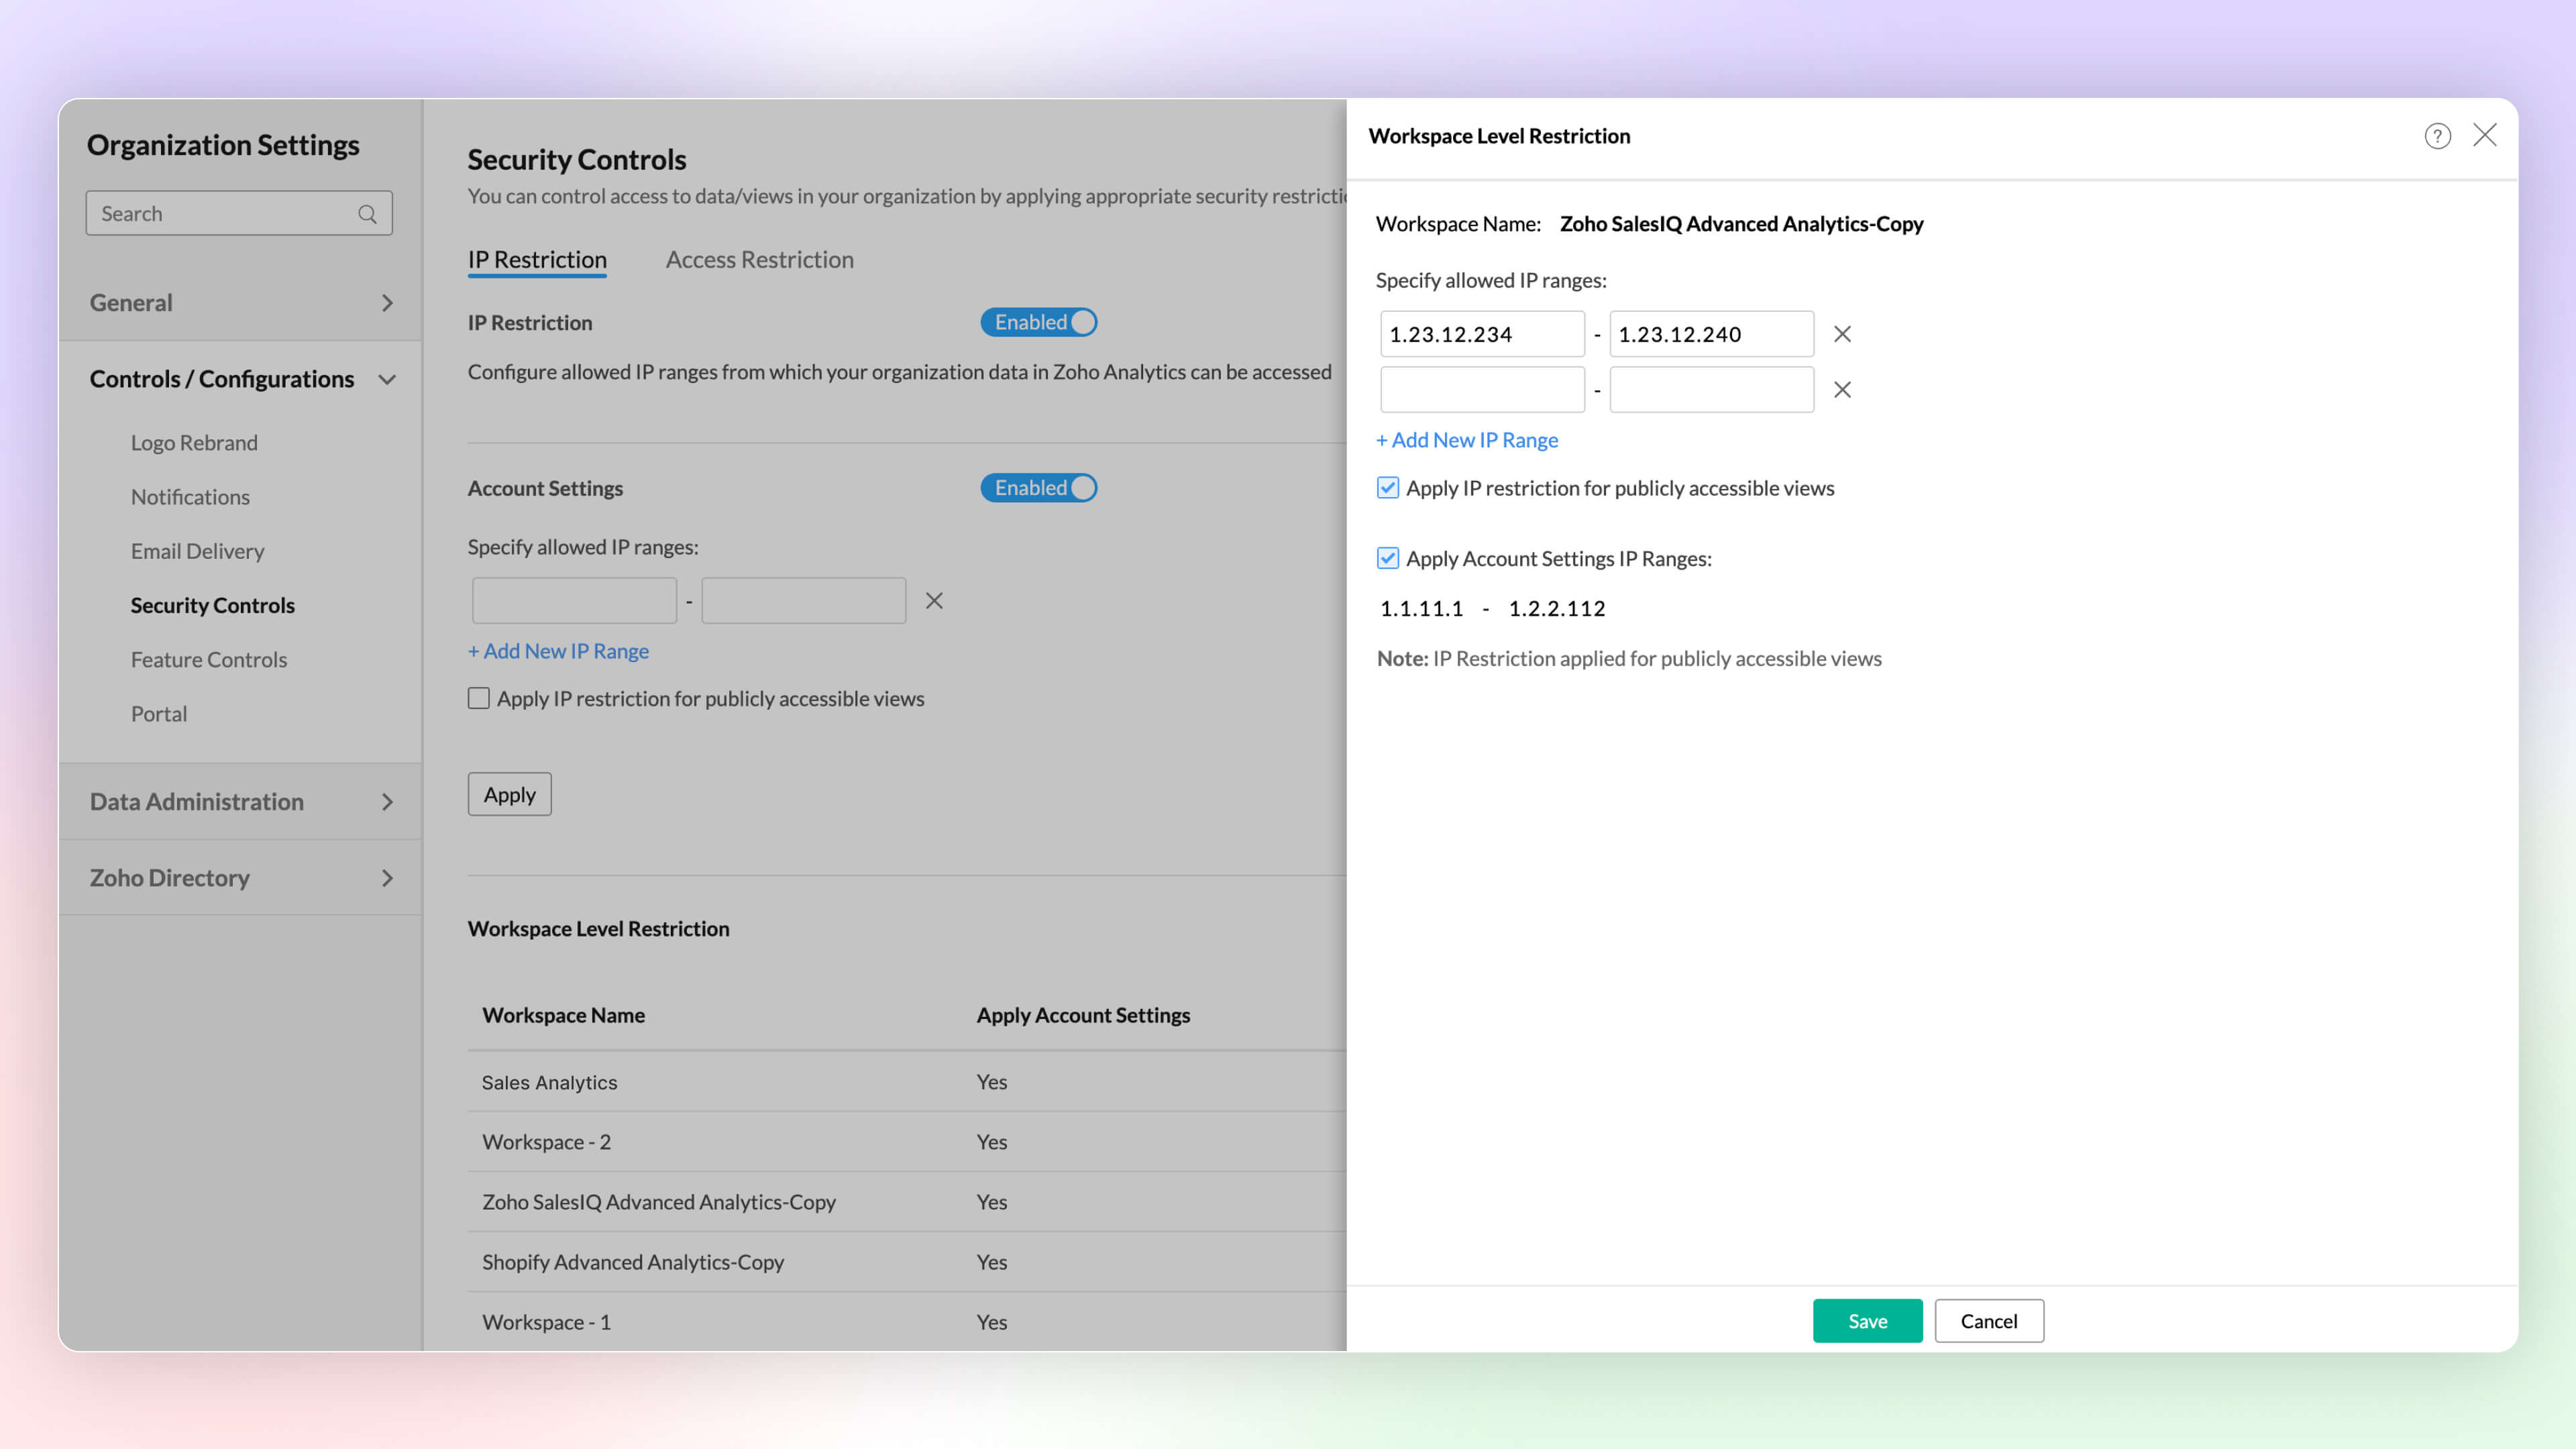
Workspace Level IP Restriction
Configure workspace-level IP restrictions for enhanced security and to prevent unauthorized access. Previously, IP restrictions were available only at the account level.
Zoho Analytics Mobile App
The Zoho Analytics Mobile app has been upgraded as a native app, optimized for your specific device. This enhancement provides faster loading times, high-quality visuals, and advanced security features specific to your device's operating system to protect your data.

Email Schedule APIs
A new set of APIs are now available for managing your email schedules. These APIs enable you to create, update, trigger and delete email schedules easily.
Do try out the new features and share your valuable feedback with us at support@zohoanalytics.com. Your suggestions are crucial to helping us improve and serve you better.