Charts
Chart is a visual representation of data which allows you to effectively analyze and interpret data. Zoho Analytics provides an easy to use drag and drop interface which enables you to create charts easily. It supports a wide range of chart types such as Area, Line, Bar, Stacked, Pie, Scatter, Combination, Funnel and Web.
Zoho Analytics offers a wide range of customization options to customize your charts like Titles, Colors, Legends, Tooltips etc. We also support a comprehensive filtering capability that allows you to extract (filter) the data you desire and portray the chart the way you want.
Zoho Analytics also offers a wide range of interactivity options like On-Mouse over highlights, Data Drill Down, Legend based filters, User Filters, Chart Exports, etc., for those who access the chart.
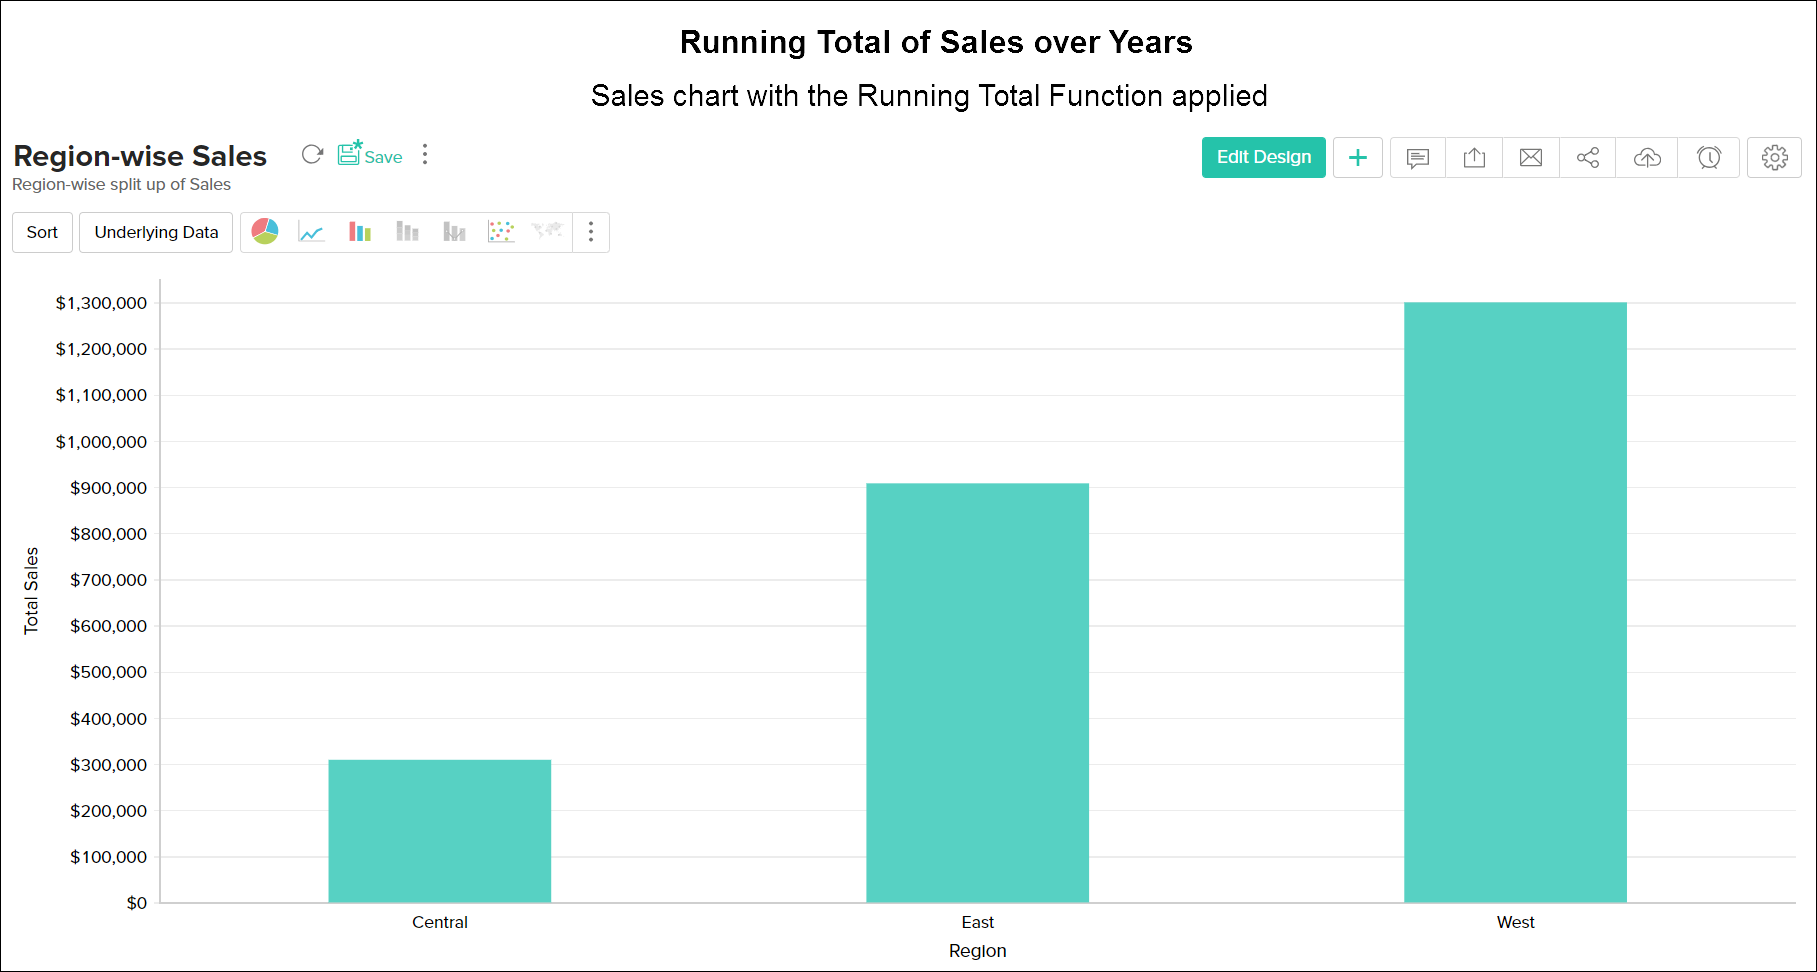
Following is a screenshot that displays the basic Chart Items available for all chart types:


In this chapter we will discuss the following:


