Evaluation Guide / visualize
Visualize
See the big picture. Turn data into actionable insights with powerful visualization tools.

BI & analytics
Zoho Creator strives to modernize and simplify the creation of enterprise applications utilizing low-code. As the ability to analyze huge datasets has become a vital component of these applications, Creator has built in business intelligence (BI) and analytics capabilities. These tools can make raw data meaningful and comprehensible, allowing developers and business users to identify trends, make informed decisions, and increase operational efficiency through real-time, data-driven insights.
Utilizing BI and analytics in Zoho Creator simplifies data management, helps optimize workflows, and creates an overarching system that is both nimble and customizable to the specific needs of the business.
Powerful integrations
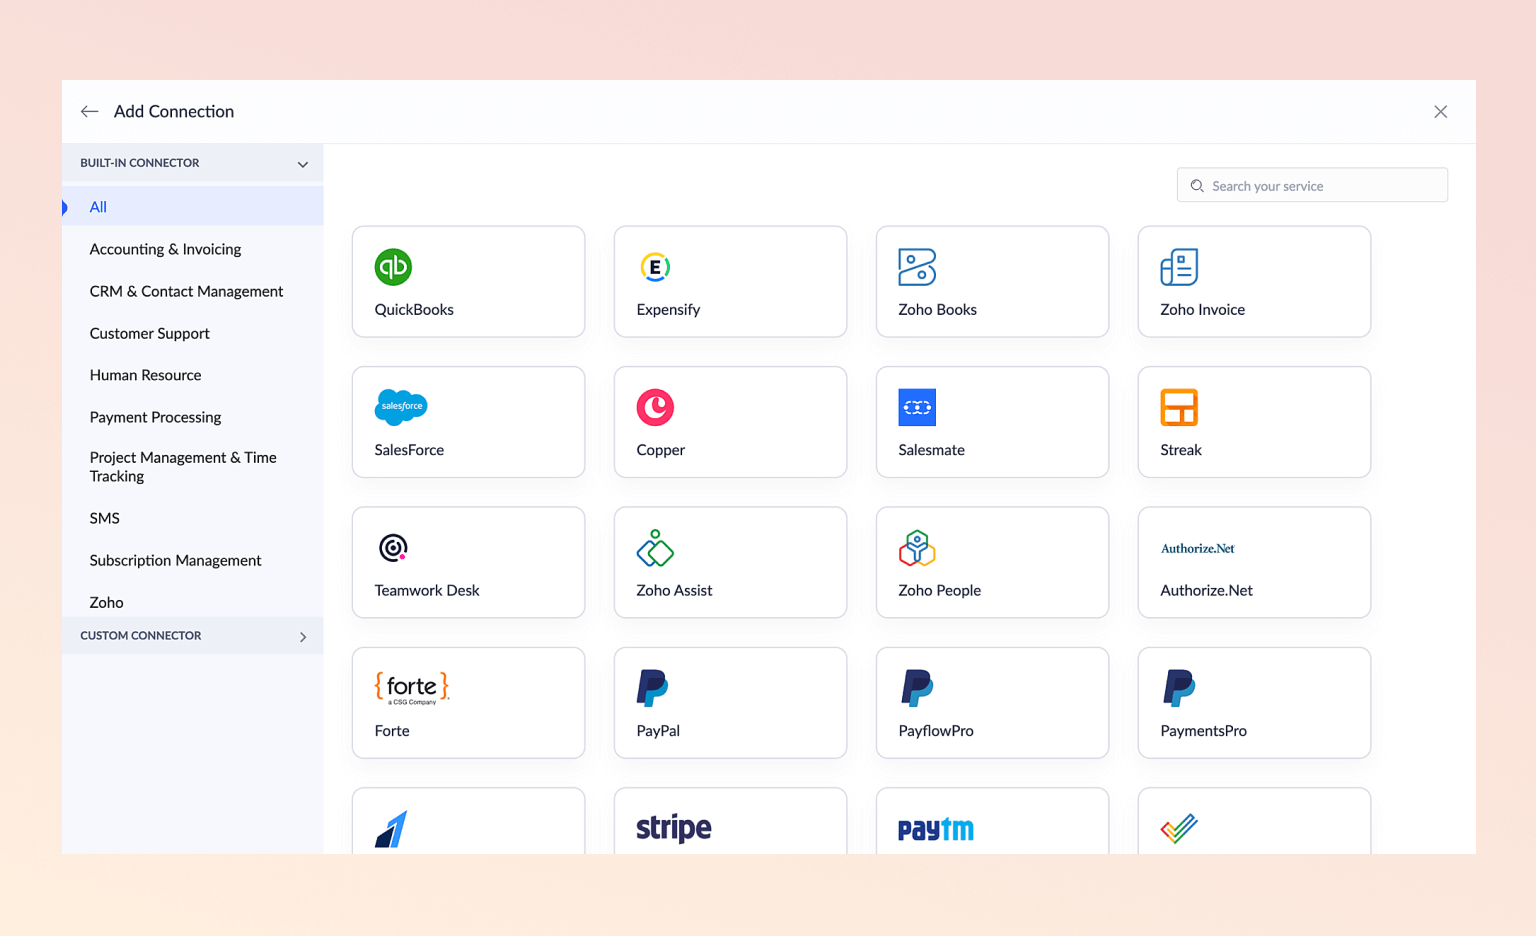
The Creator platform has powerful capabilities to manage integrations in just a few clicks, making it possible to connect one application to another and streamline business processes efficiently. Through the platform's extensive ecosystem, developers can benefit from a diverse library of prebuilt connectors, which ease the process of integrating with backend systems, such as databases like Oracle, MySQL, SAP, and Salesforce. This functionality enables developers to build robust applications, giving businesses the ability to achieve an end-to-end digital experience that improves workflows, productivity, and ultimately,
customer satisfaction. Moreover, the Zoho Creator platform enables users to blend various technologies seamlessly and provides an environment that lets them build their own integrations.
Data insights—anywhere, anytime
The ability to glean insights from data is a critical component of any technological ecosystem. With Zoho Creator, data insights can be obtained from a variety of sources, such as applications, databases, and APIs. The platform boasts an impressive range of analytics features that allow developers to explore and extract valuable insights from their data. They can leverage the power of predictive analytics to identify patterns and trends that can help to optimize business processes. The user-friendly interface of Zoho Creator makes it easy to navigate and extract insights from large, complex datasets.
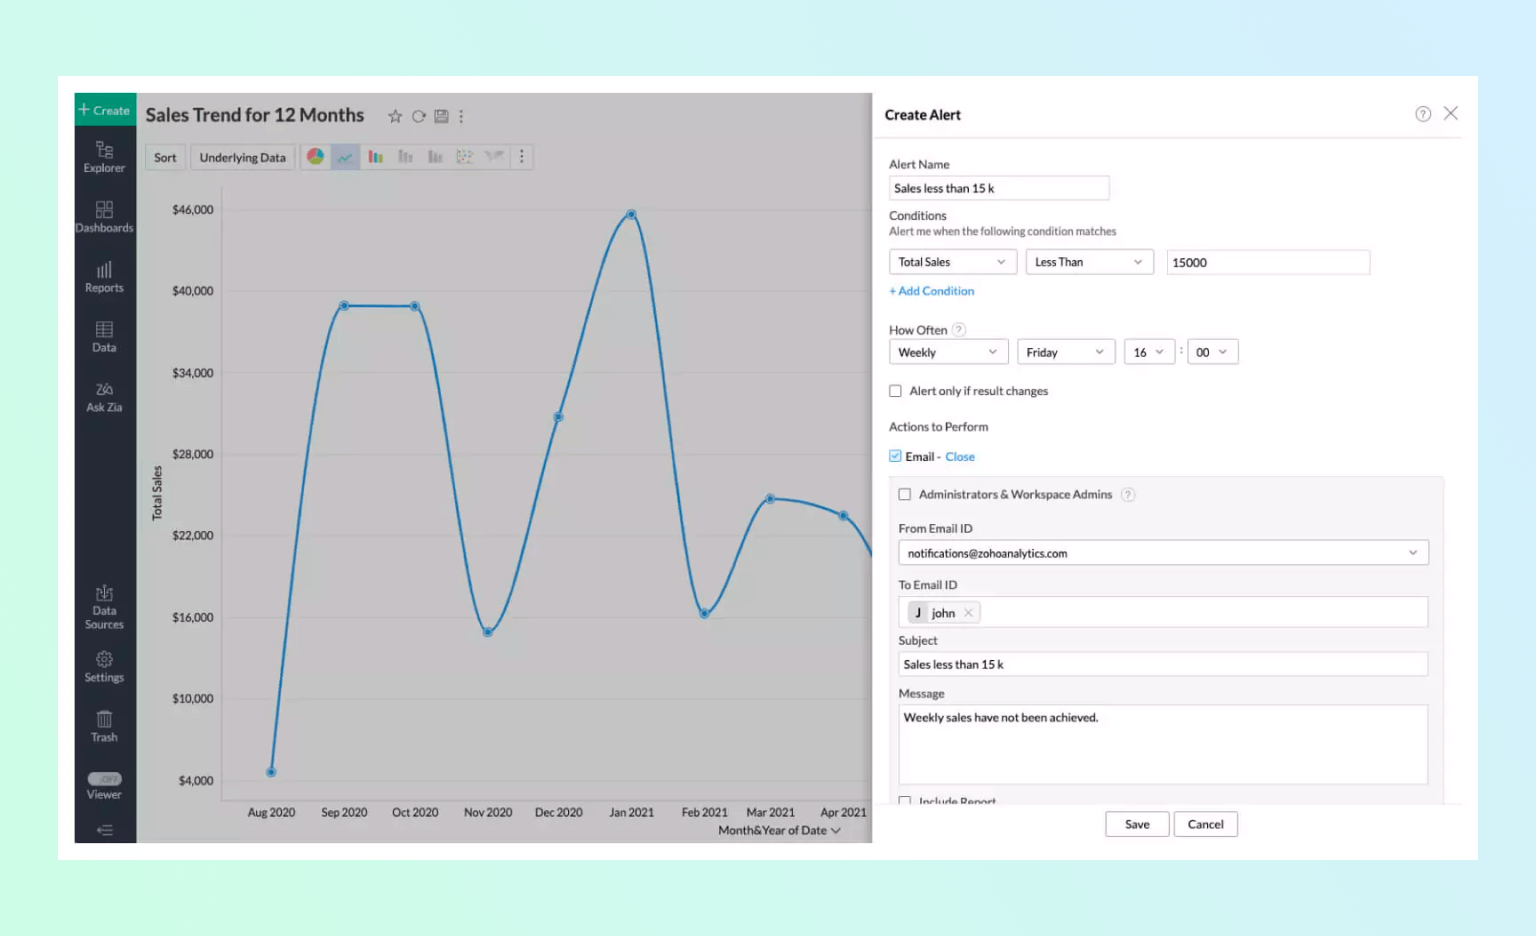
With Zoho Creator's data insights, developers can uncover hidden trends and patterns that can be used to optimize their applications and enhance the overall user experience. This cutting-edge technology provides a wealth of information that allows developers to make informed decisions, resulting in higher-quality software that's easier to maintain over time.
Augmented analytics
This technology is designed to facilitate smarter, more informed decision-making by automating time-consuming tasks such as data preparation, predictive modeling, and report generation. It does this by incorporating machine learning algorithms and analytical models into the platform, thus making it easy for business analysts and nontechnical users to draw actionable insights from massive data sets.
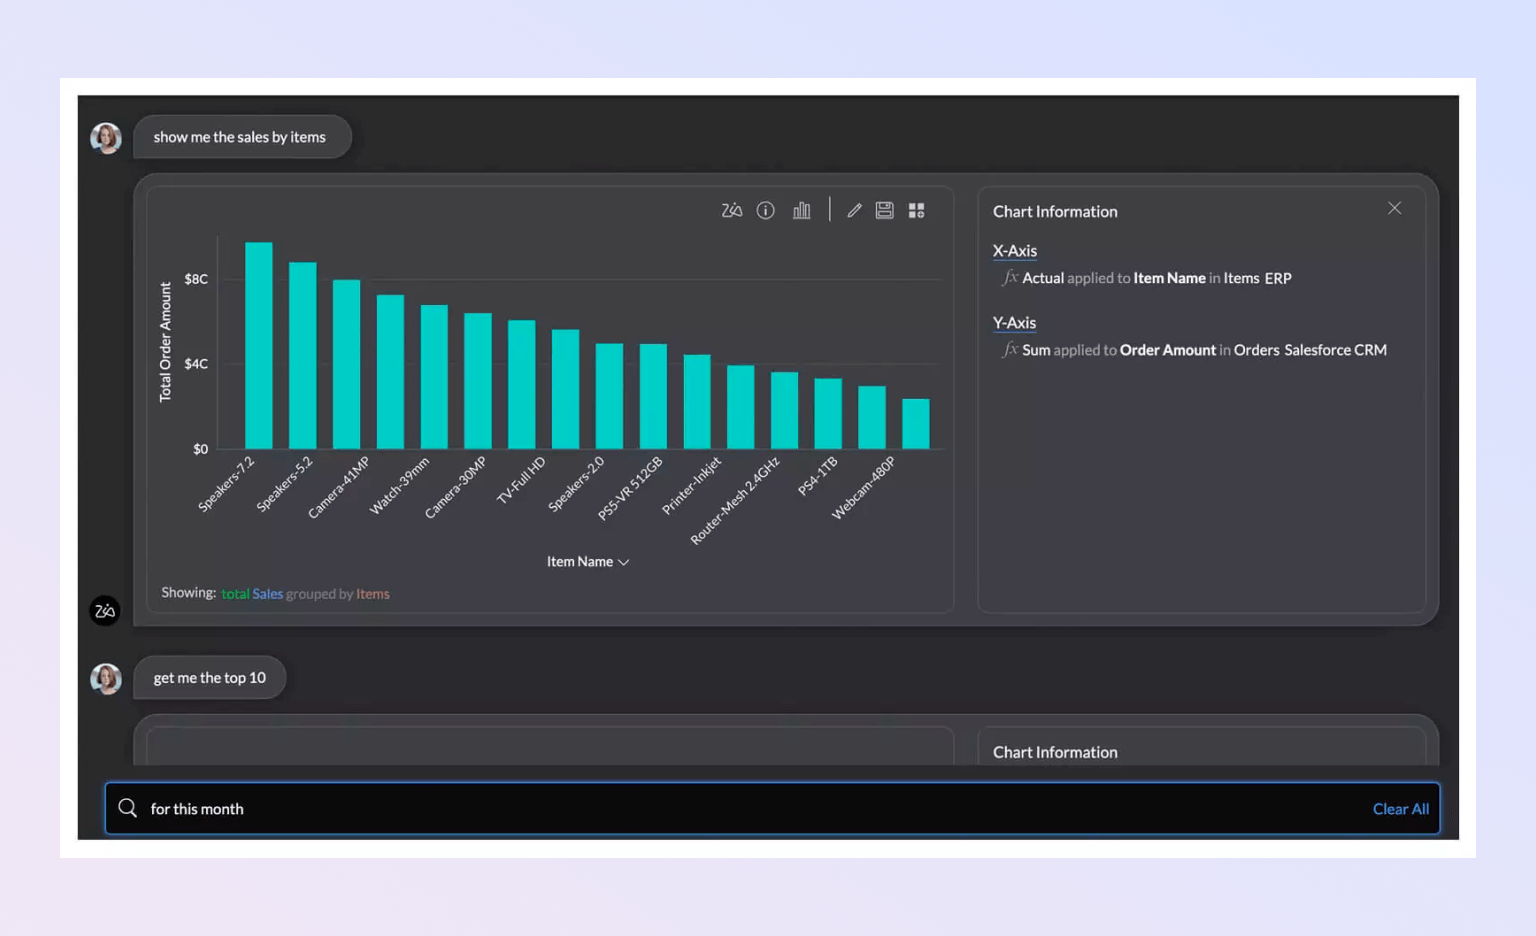
One of the core benefits of augmented analytics is that it eliminates the need for manual data analysis and interpretation. It can automatically identify patterns, anomalies, and correlations in data, allowing users to identify hidden insights that may have been difficult or impossible to find otherwise. This streamlined process can also save businesses a significant amount of time and resources, as data analytics tasks can be completed much faster and with less effort.
Moreover, augmented analytics is an asset in the development of powerful predictive models. It can automatically detect data trends and patterns and provide predictive insights to improve business decision-making. The results of these models can then be incorporated directly into the development process, allowing organizations to create more effective business strategies, reduce overall costs, and increase revenue streams.
Collaborative analytics
Collaborative analytics is a powerful feature of the Zoho Creator platform that enables teams of developers and business users to collaborate closely on data insights and business intelligence. Creator provides an easy-to-use, collaborative analytics interface that allows multiple users to simultaneously analyze, visualize, and share data without the need for complex SQL queries or data-prep processes.
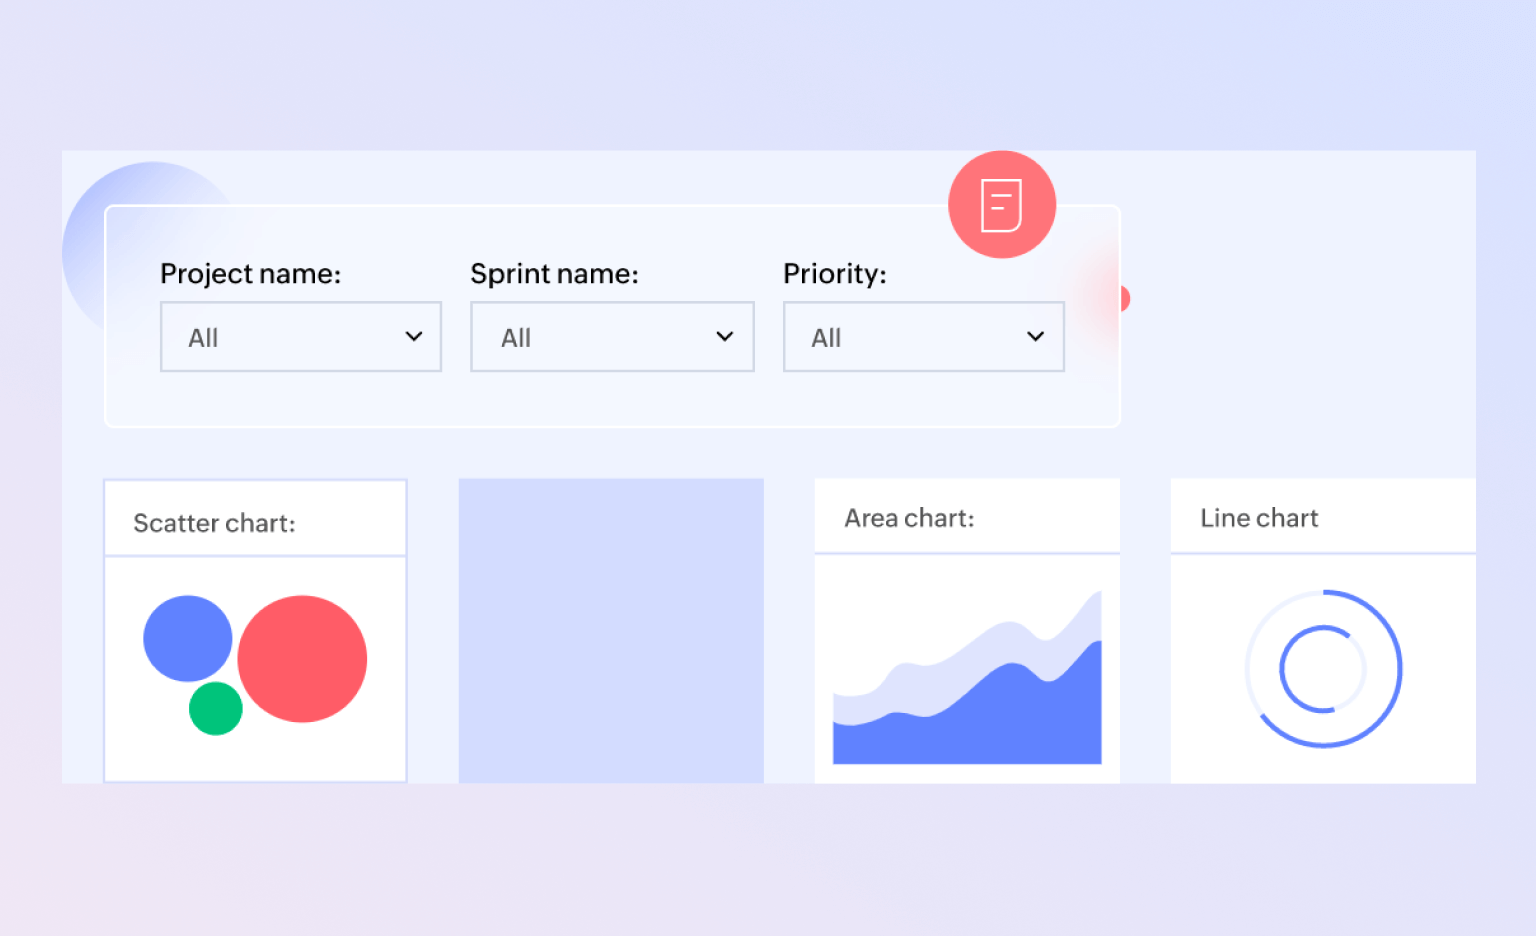
Collaborative analytics in Zoho Creator leverages the power of various advanced analytics technologies—such as exploratory data analysis, interactive visualization, and predictive modeling—to enable business users and data analysts to easily gain insights from complex data sets without any technical background. Zoho Creator provides an intuitive drag-and-drop interface for users to create and customize charts, reports, and dashboards without any prior knowledge of coding.
Zoho Creator's collaborative analytics increases transparency and collaboration within teams, facilitating the exchange of ideas and insights between team members in real time. By empowering users to interactively investigate data and patterns in collaboration within a shared environment, users can make data-informed decisions quickly and accurately.

Creator collaborative analytics also enables interactivity with data on a more granular level. With the Zoho Creator platform, users can connect to most cloud-based data sources directly, integrating external sources and generating actionable insights on data in real time.
Self-service portals
Self-service portals are a crucial component of the Creator platform, which allows developers to quickly and easily build applications that empower users to perform a wide range of functions, without the need for technical expertise. These portals provide an essential self-service experience for end users to access content, view data, manage profiles, and perform various other activities.
Zoho Creator self-service portals provide a user-friendly interface that enables users to quickly manage their data or gain insights into various data analytics. The portal pages can be easily customized with drag-and-drop tools and designed to meet branding requirements.
These portals are built using Creator's model-driven architecture, which makes them highly responsive, scalable, and customizable. The self-service portals interface with Zoho Creator applications, allowing users to access and update data with ease.
One of the most significant benefits of Creator's self-service portals is that they allow organizations to provide a secure and customizable space for end users to interact with data and processes, and quickly find the information they need. Users are empowered to initiate and manage their own activities related to order placements, approvals, and reporting, without depending on IT teams or involving a manual process.
Mobile BI
Mobile business intelligence, commonly known as mobile BI, is an essential component of Creator—it enables users to access, analyze, and share business data on their mobile devices. The Zoho Creator platform is designed to provide a comprehensive suite of tools and features for building, deploying, and managing enterprise applications, with mobile BI being an integral part of the solution.
With mobile BI in Zoho Creator, users can leverage real-time and up-to-date data from multiple sources to make informed business decisions at any time, from anywhere. The platform offers a range of interactive features, allowing users to interact with data in an intelligent and intuitive way, from custom dashboards and reports to data visualizations and analytics.
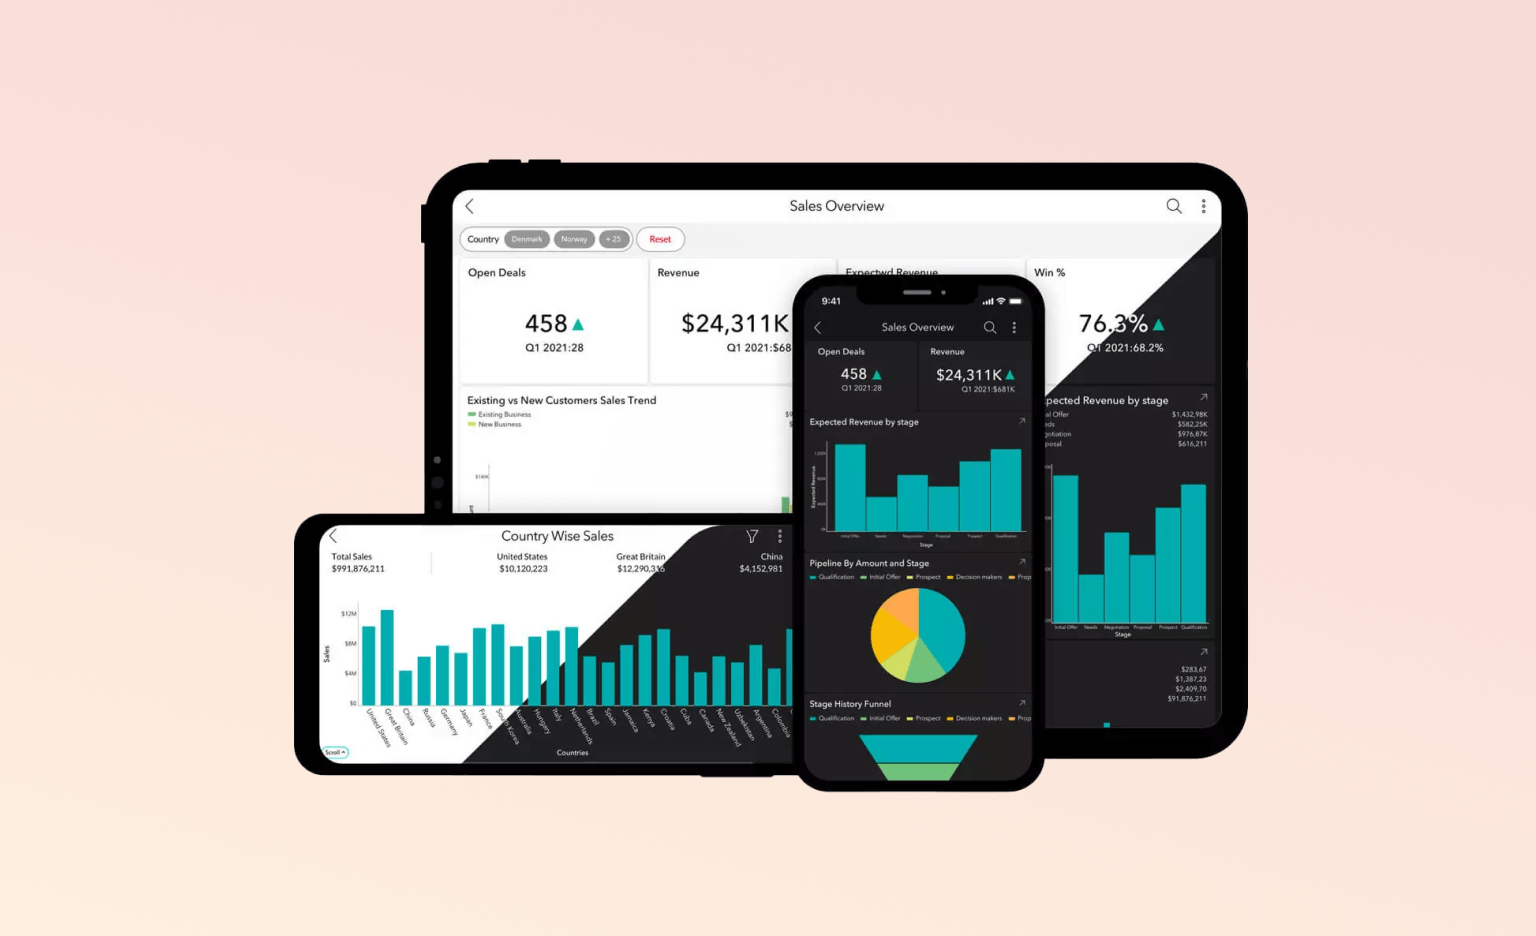
Mobile BI in Zoho Creator utilizes a range of technologies, such as responsive design, HTML5, and native mobile apps, to ensure optimal performance and a seamless user experience across all mobile devices. The platform also offers robust security features, including user authentication and authorization, data encryption, and secure data transfer protocols, to protect sensitive business information.
One of the key benefits of mobile BI in Zoho Creator is that it enables users to stay connected to their business data in real time, allowing for faster insights and more efficient decision-making. The platform also offers a range of customization and integration options, enabling users to tailor the solution to their specific business needs and easily integrate data from various sources.
Dashboards
Drag-and-drop design
The drag-and-drop design feature in Creator enables users to effortlessly create visual reports by dragging and dropping objects onto a canvas. Users can drag and drop tables, fields, charts, images, and other objects to create a customized report. This feature provides an intuitive way for users to design reports, making it easy for even nontechnical users to create them. The ability to drag and drop objects also ensures that reports are structured and follow a consistent design.
Simple and easily customizable
Zoho Creator ensures that building visual reports is simple and customizable. The platform provides a straightforward interface that enables users to easily create reports. Users can customize their reports by choosing from a variety of prebuilt templates or creating their own templates. This feature allows users to design reports that meet their specific needs, making it easier to track performance, identify trends, and make informed decisions.
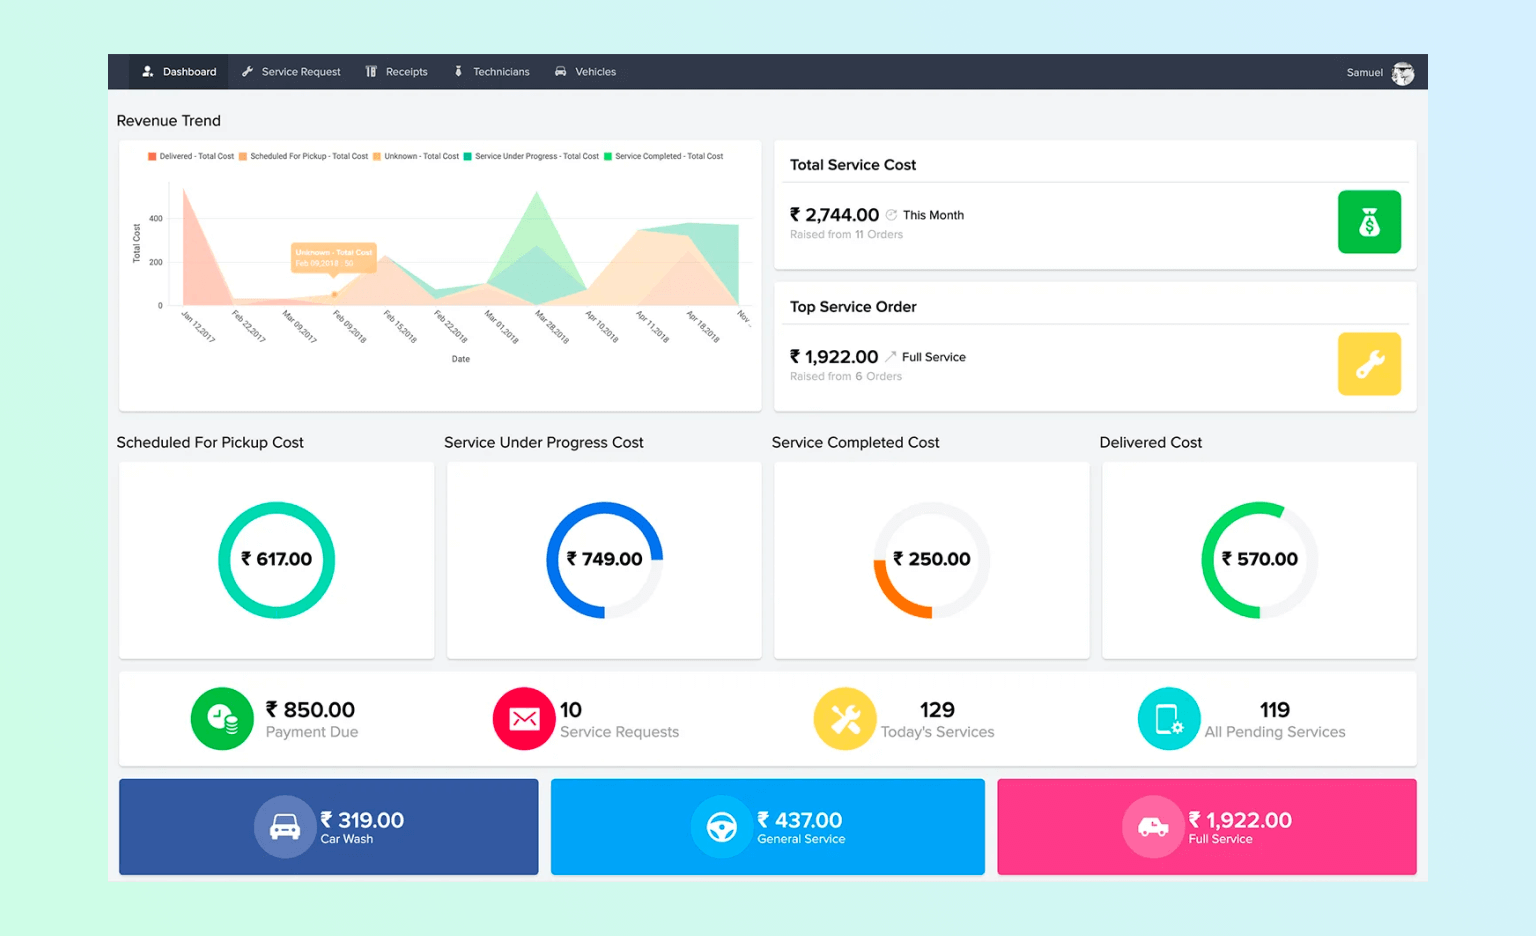
Real-time multi-device dashboards
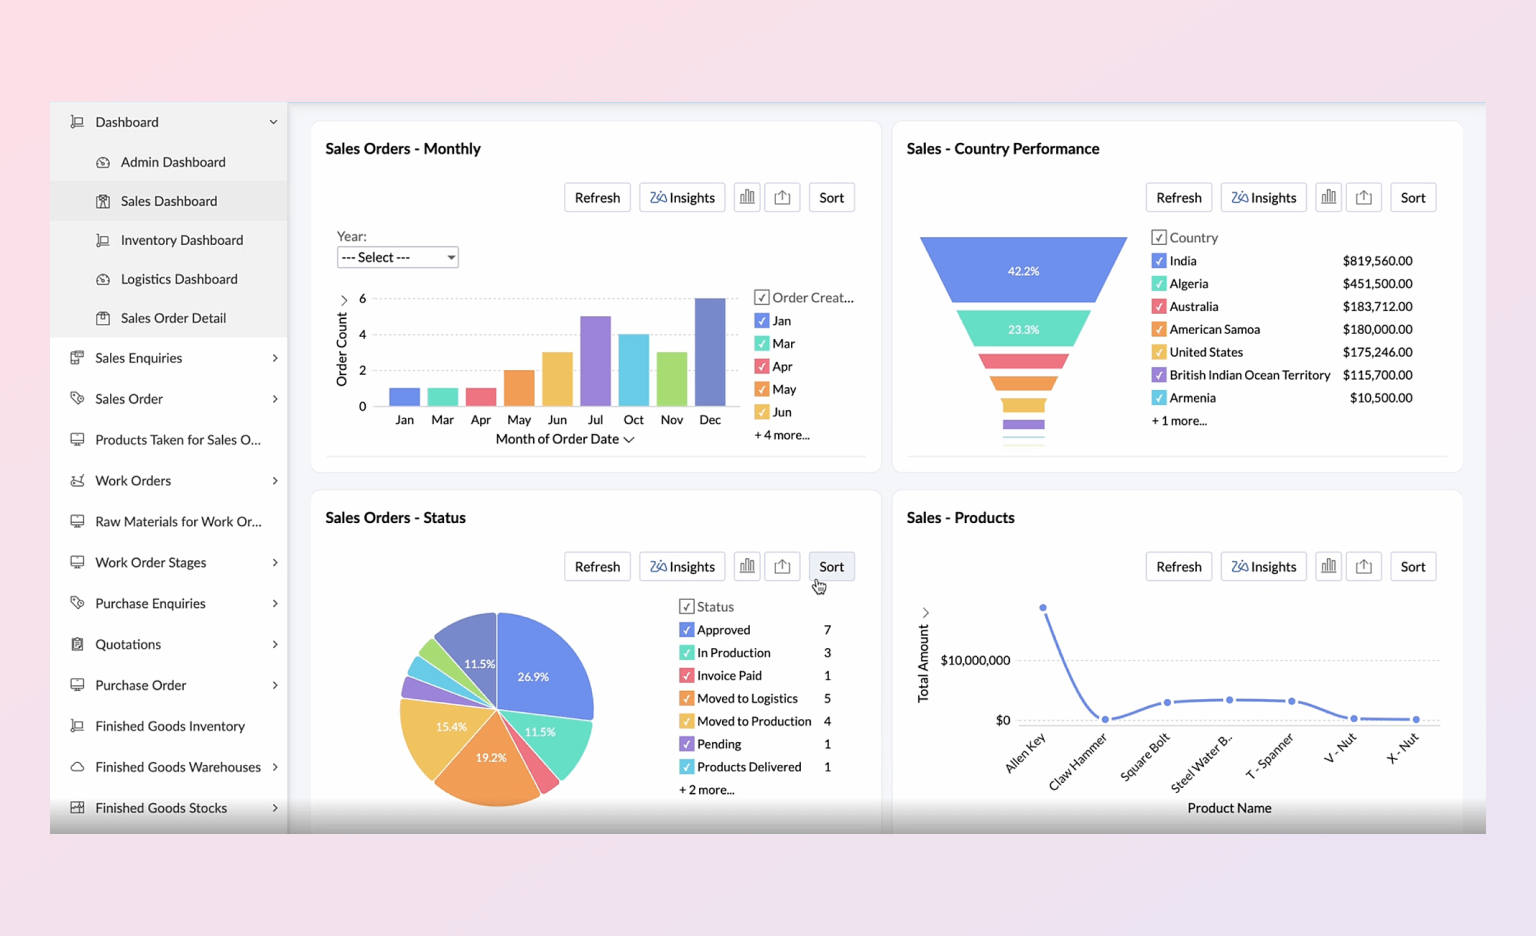
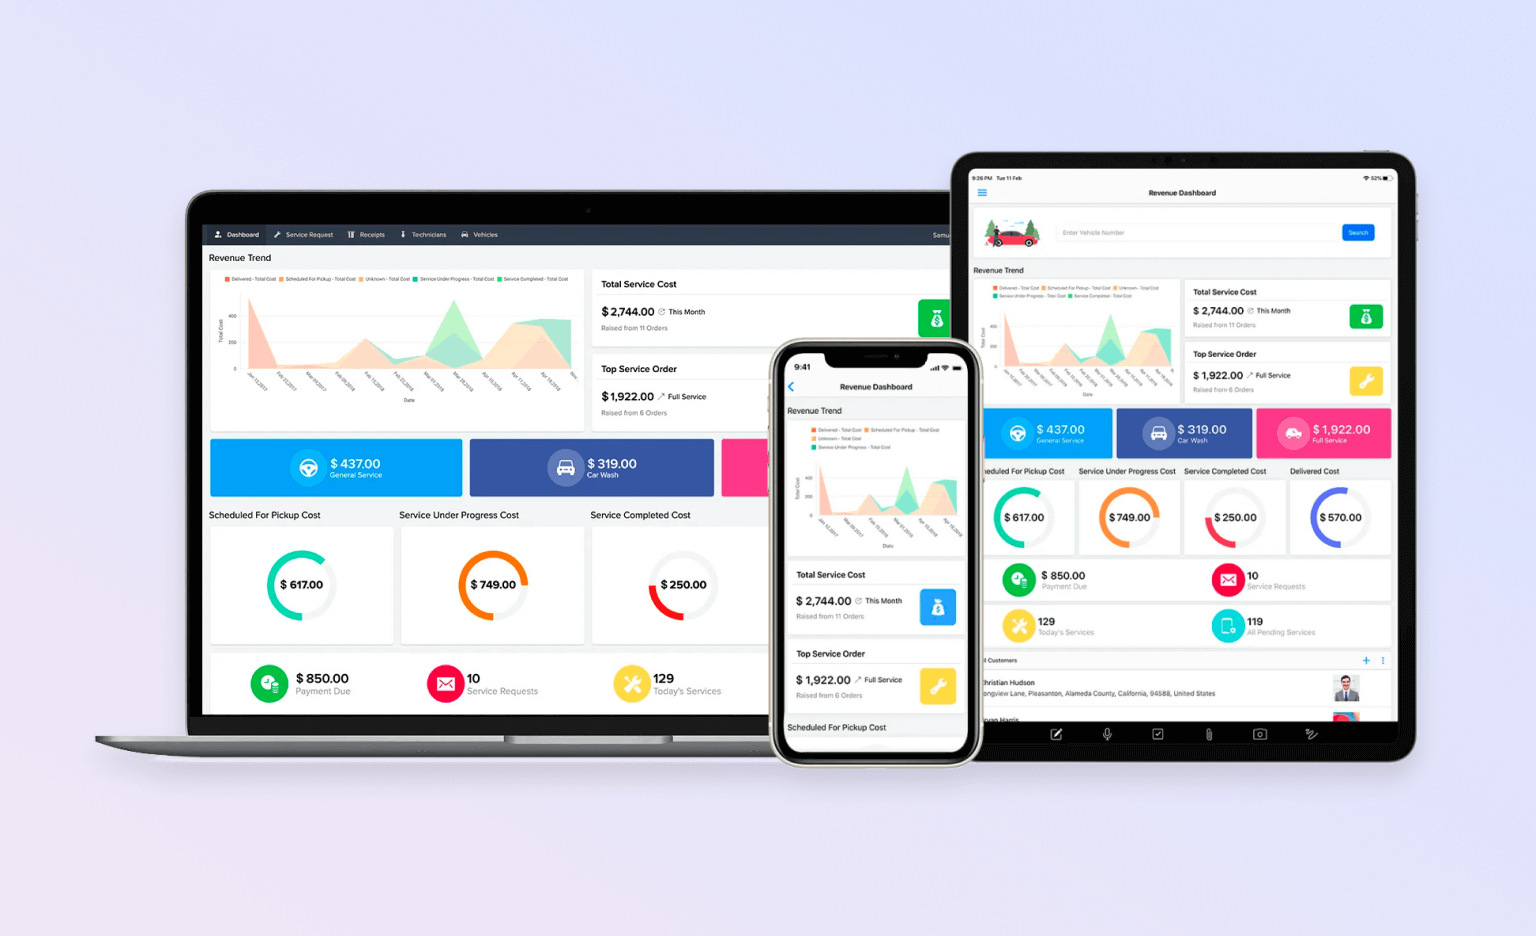
This feature allows users to monitor key business metrics on a single dashboard. It allows users to create visualizations that are continuously updated in real time, providing a quick and easy way to monitor business performance, engage team members, and identify opportunities. Users can also access dashboards from multiple devices, including mobile phones, tablets, and laptops.
Embeddable widgets
Zoho Creator provides a feature for users to embed widgets in their reports, enabling them to interact with their data. This feature allows users to include charts, tables, maps, calendars, and other widgets in their reports. By embedding widgets, users can provide more context to their data, making it easier for their audience to understand the data and make informed decisions.
Zoho Markup Language
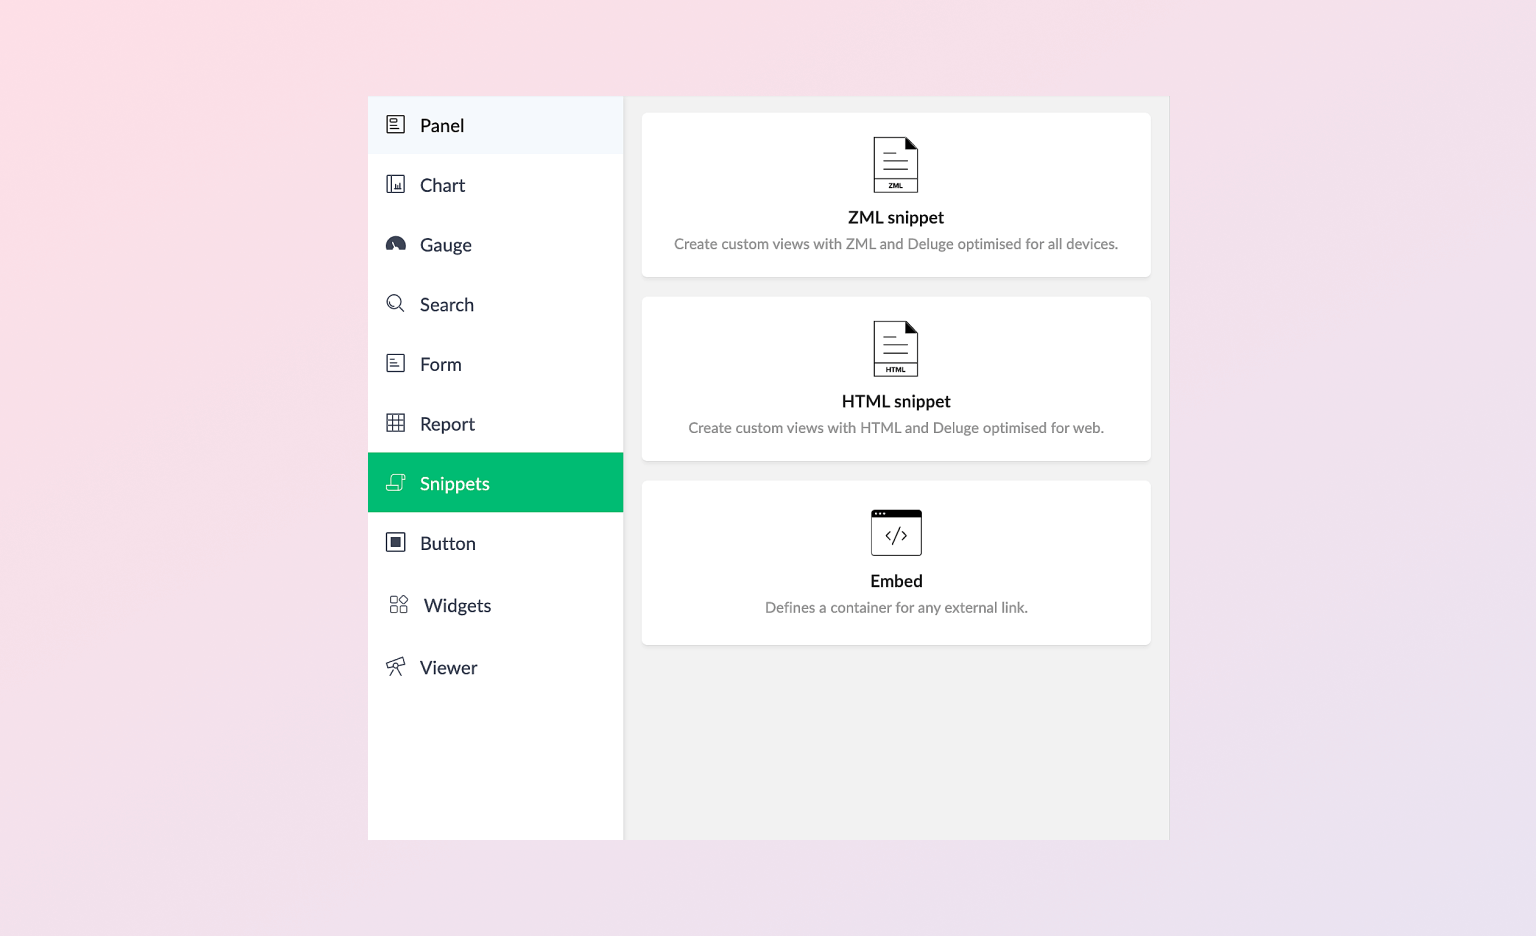
Zoho Markup Language (ZML) is a proprietary markup language used in Creator that allows users to design and code their reports. This feature provides users with complete control over the design and layout of their reports. ZML offers a wide range of tags and tools that enable users to create dynamic and interactive reports. With ZML, even highly complex reporting requirements can be met without the need for technical expertise.
Over 40 types of reports
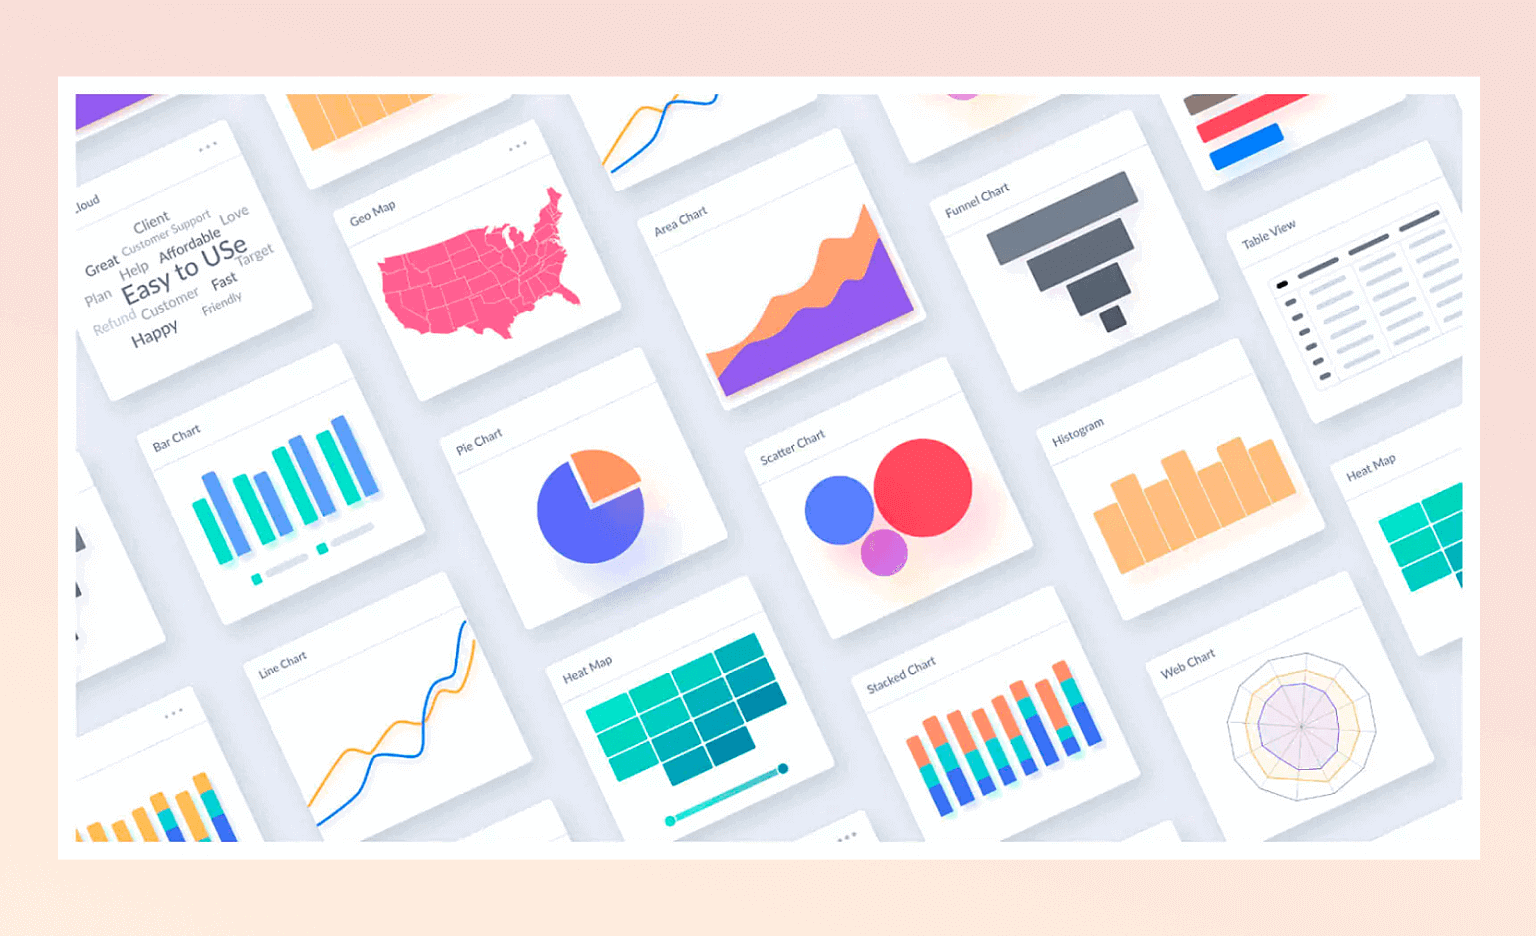
Zoho Creator provides users with the ability to create over 40 different types of reports, each with unique features and capabilities. These reports include summary, pivot, calendar, Gantt, map, and many more. Users can customize their reports by selecting different styles, colors, and fonts. With dozens of different types of reports to choose from, users can create comprehensive, informative, and engaging reports for all types of business needs.
