Gain deep insights with self-service data visualizations
Create custom dashboards and automate your reporting to share accurate and up-to-date insights with your team. With Zoho Creator's end-to-end BI, you and your team can easily go from data to analytics to insights to action.
Try for free

- Data visualization
- Overview
- BI & Analytics
- Dashboards
What data visualization software is and why it matters
Data visualization software is a tool to represent data using visual elements like charts and graphs. Generally, human eyes are highly receptive to colors and patterns—we pick up on trends a lot quicker this way than when sifting through endless numbers. That’s why data visualization is a powerful tool for communication and faster decision-making. It simplifies analyzing the huge volumes of data that businesses generate every day. With data visualization software, you can inform, compare, organize, spot patterns and outliers, and bring out the relationships and changes in your data.
Get fast, centralized insights from multiple data sources
Visualize your data from files, databases, cloud drives, web URL feeds, and other applications.
- Drag-and-drop builder
- Augmented analytics
- Secure collaboration
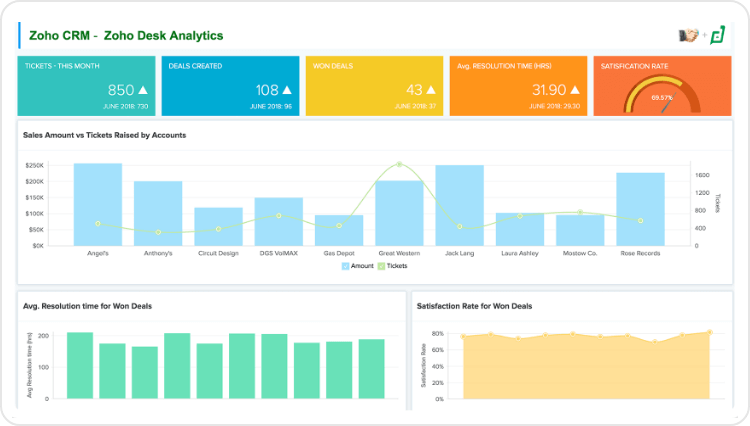
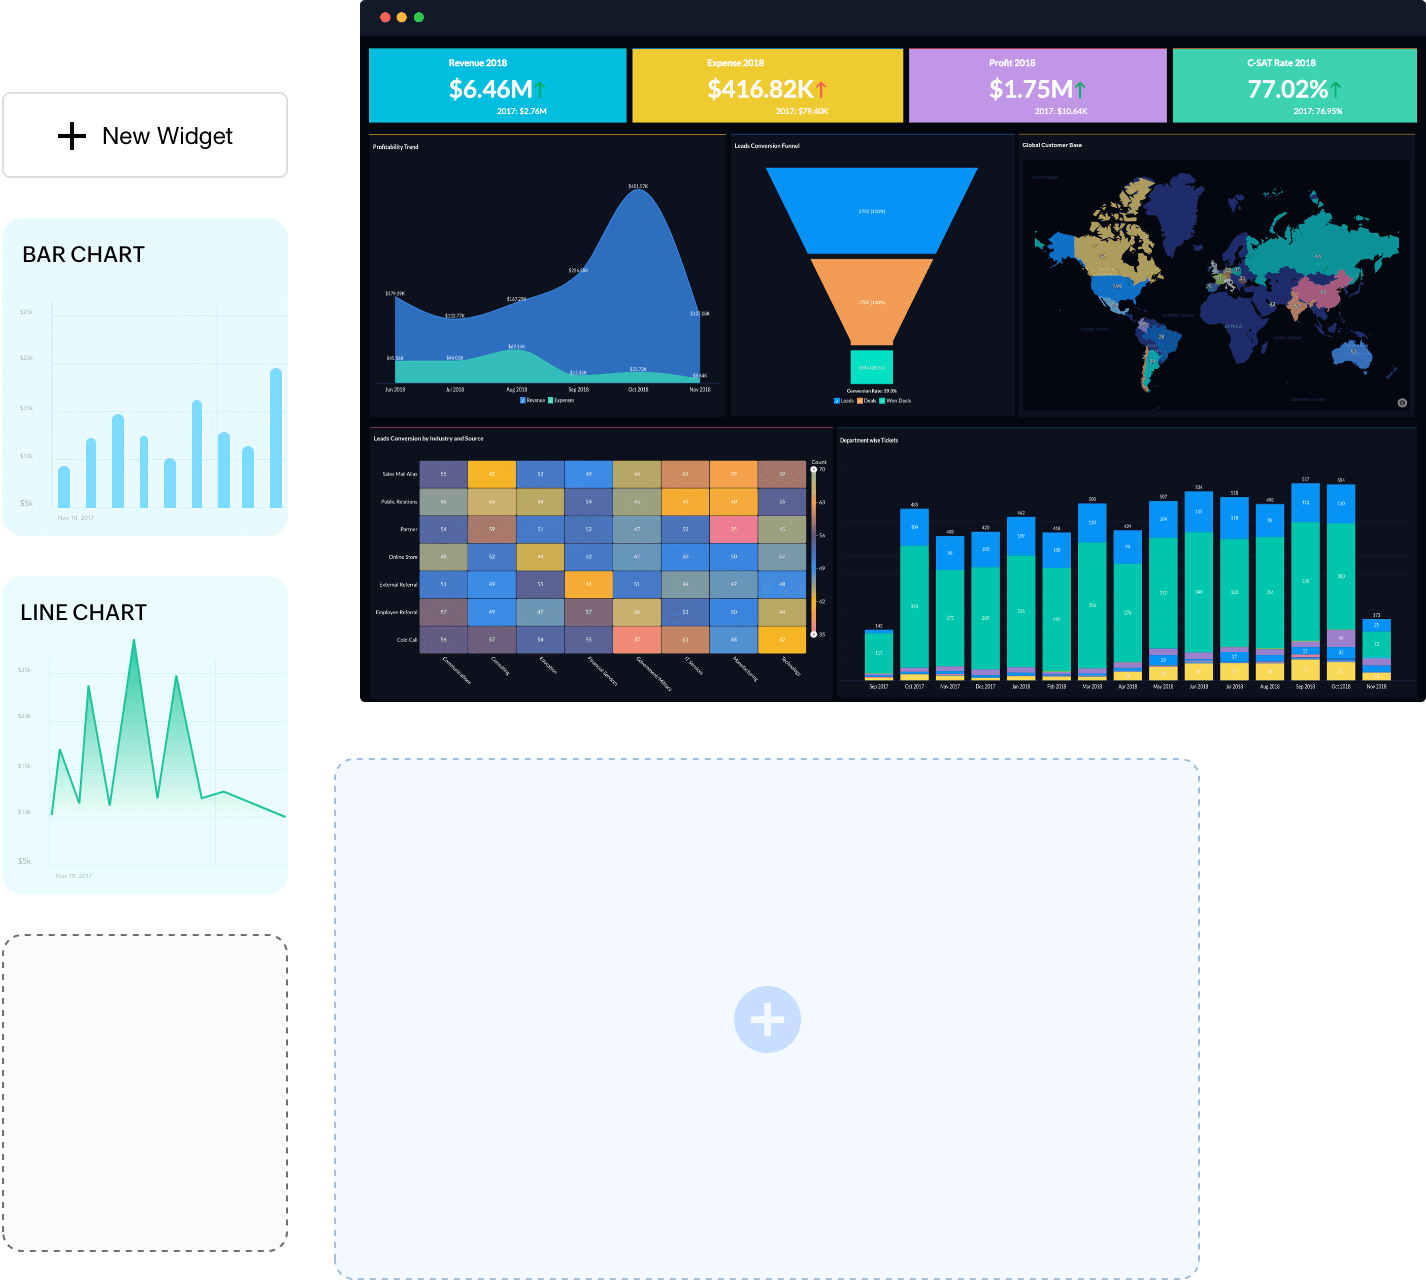
Comprehensive custom dashboards to analyze your data
Get a 360 degree view of what's happening in your project, department, or entire organization.
- Drag-and-drop design
- Fully customizable
- Third-party widgets
Hear what our customers have to say
"The biggest impact is that the majority of employees can interact on the platform; we can now create more metrics that help management make better decisions."
Eduardo,Chief Developer, Kumi Motors
"Our sales team is able to enter product data with pictures in the Zoho Creator app. And the back office is able to run reports and analytics to manage marketing campaigns and measure store performance with real-time data, avoiding emails, Excel, etc."
Srini Dadi,CIO, Stella & Chewy’s