


Troubleshooting Client Script
1. Log Statement
log();Use the log statement to debug the script wherever required and run the script using the Run option in Client Script IDE. The logs will be available in the Messages panel of Run option. Here is the screenshot of how you can add log statements in your script and where you can see the logs when the script executes. 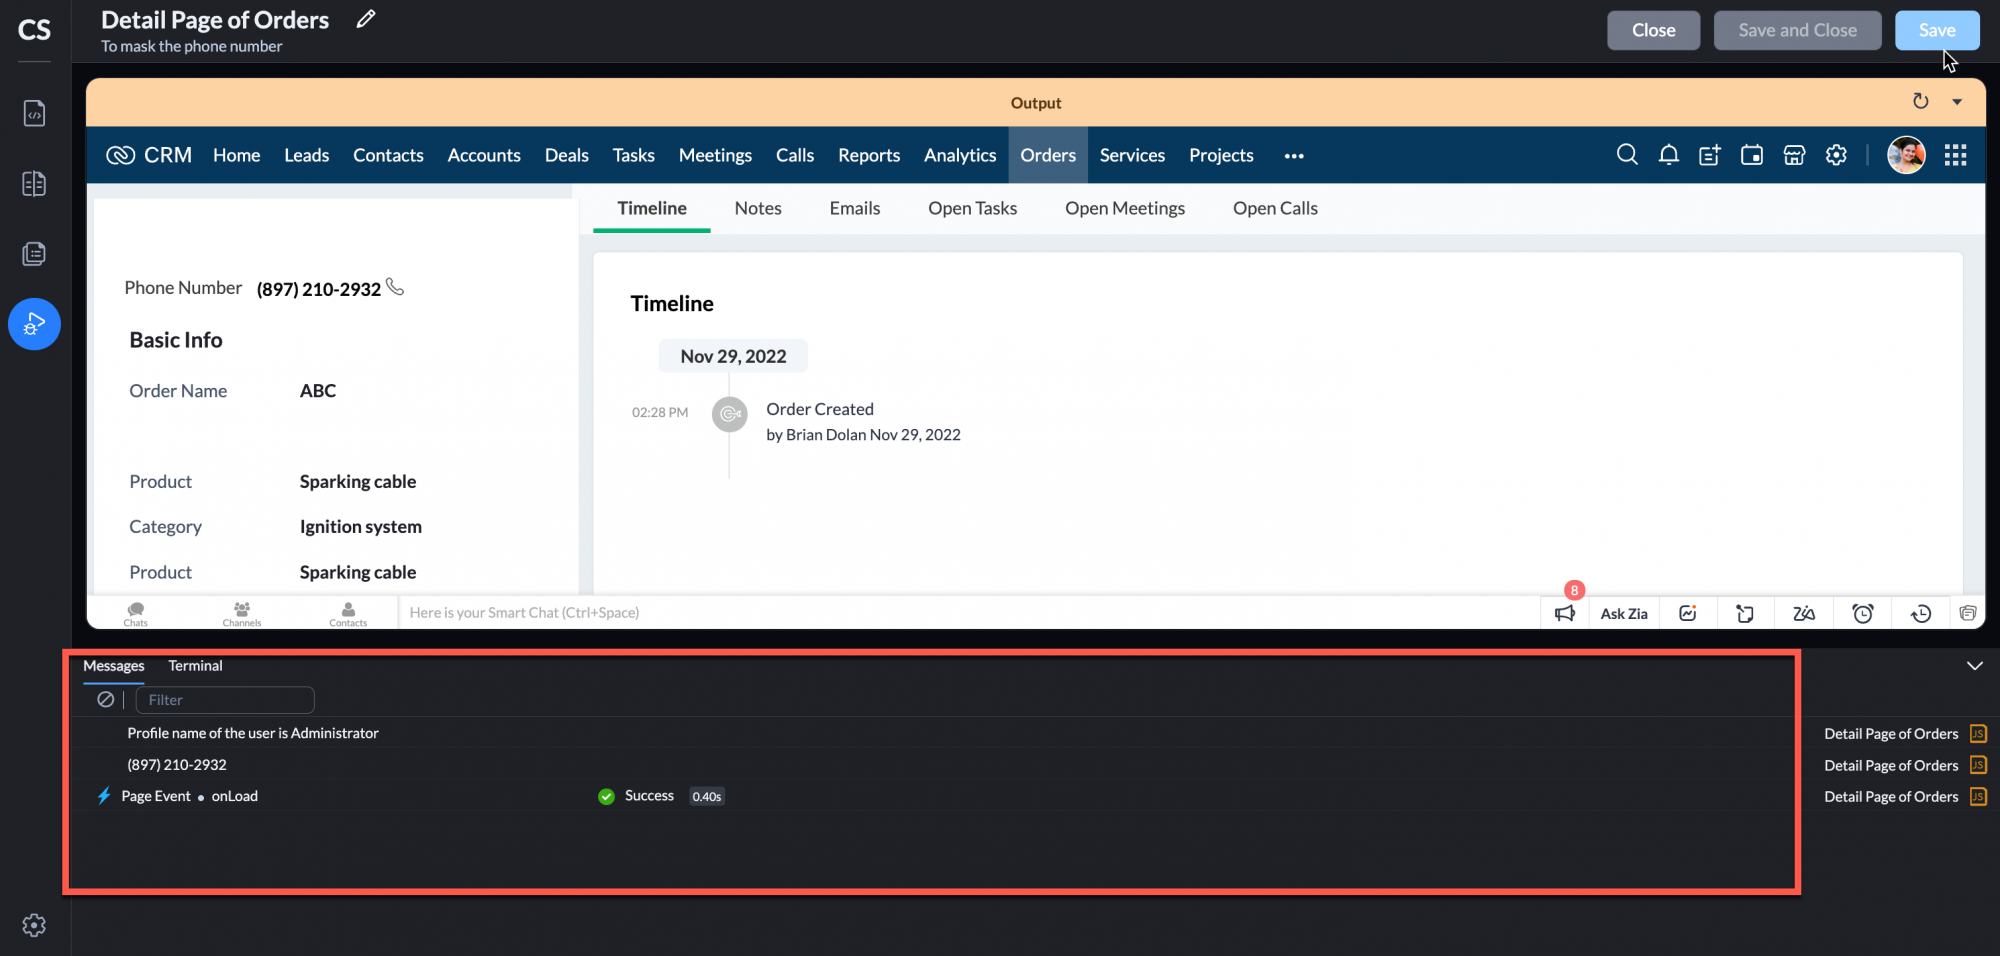
1. Debug Statement
debugger;Debugger statement in JavaScript is used to invoke any available debugging functionality, effectively pausing code execution at that point. This lets you examine the code, check variable values, and troubleshoot issues. You can add this statement anywhere in your Client Script. When the Client Script runs, it will pause at the exact point where you placed the debugger statement.
How debugger Works?
When the debugger statement is encountered in a script, if developer tools are open in the browser, execution will pause at that line. If no debugging tools are available, the statement has no effect. This behavior makes it similar to setting a breakpoint in a debugger.
Note:
Enable JavaScript source maps in Chrome DevTools to map code back to the original source, ensuring accurate debugging.

To enable this, simply check the JavaScript Source Maps option in DevTools settings.
var d1 = ZDK.Page.getField("Date_1").getValue();
debugger;
var d2 = ZDK.Page.getField("Date_2");
d2.setValue(value);
Explanation
- Debugger Statement: The debugger statement is placed right after retrieving the Date_1 value, and the execution will pause here.
- The variable "d1" holds the value of the 'Date1' field.
- Debugger Statement: The debugger statement is placed right after retrieving the Date_1 value, and the execution will pause here.
- Error Checking: After inspecting variable states, you can continue execution to see if the error handling works as expected.
How to Use It?
- Open Developer Tools: In your browser, open the Developer Tools. The following are the shortcut keys to open Developer Tools.
- Windows/Linux: Ctrl + Shift + I or F12
- Mac: Cmd + Option + I

- Run Your Script: Trigger the function that contains the debugger statement.
- Inspect State: When execution pauses at the debugger line, you can inspect variables and step through your code using the debugging interface.

- This approach allows you to identify where your Client Script may not be functioning as intended and make necessary adjustments based on real-time feedback from the debugger.