
Powerful data management hub
Visualization
Generative AI-infused analytics
Predictive AI
Data science & machine learning
Collaboration & data storytelling
Powerful data management hub
Visualization
Generative AI-infused analytics
Predictive AI
Data science & machine learning
Collaboration & data storytelling
Ask Zia, an AI agent for BI and analytics
For data engineers
For data analysts & business users
Build reports and dashboards by just chatting with your AI agent. Access end-to-end insights, from historic trends to future predictions, along with smart recommendations.
Embed Agentic Ask Zia
Bring the power of Ask Zia to your apps, portals, or products by embedding it contextually where your users need insights the most.
Powered by LLMs
Choose Zoho LLM or connect your own, such as OpenAI, depending on your compliance requirements and stack preferences.

Zoho Analytics MCP server
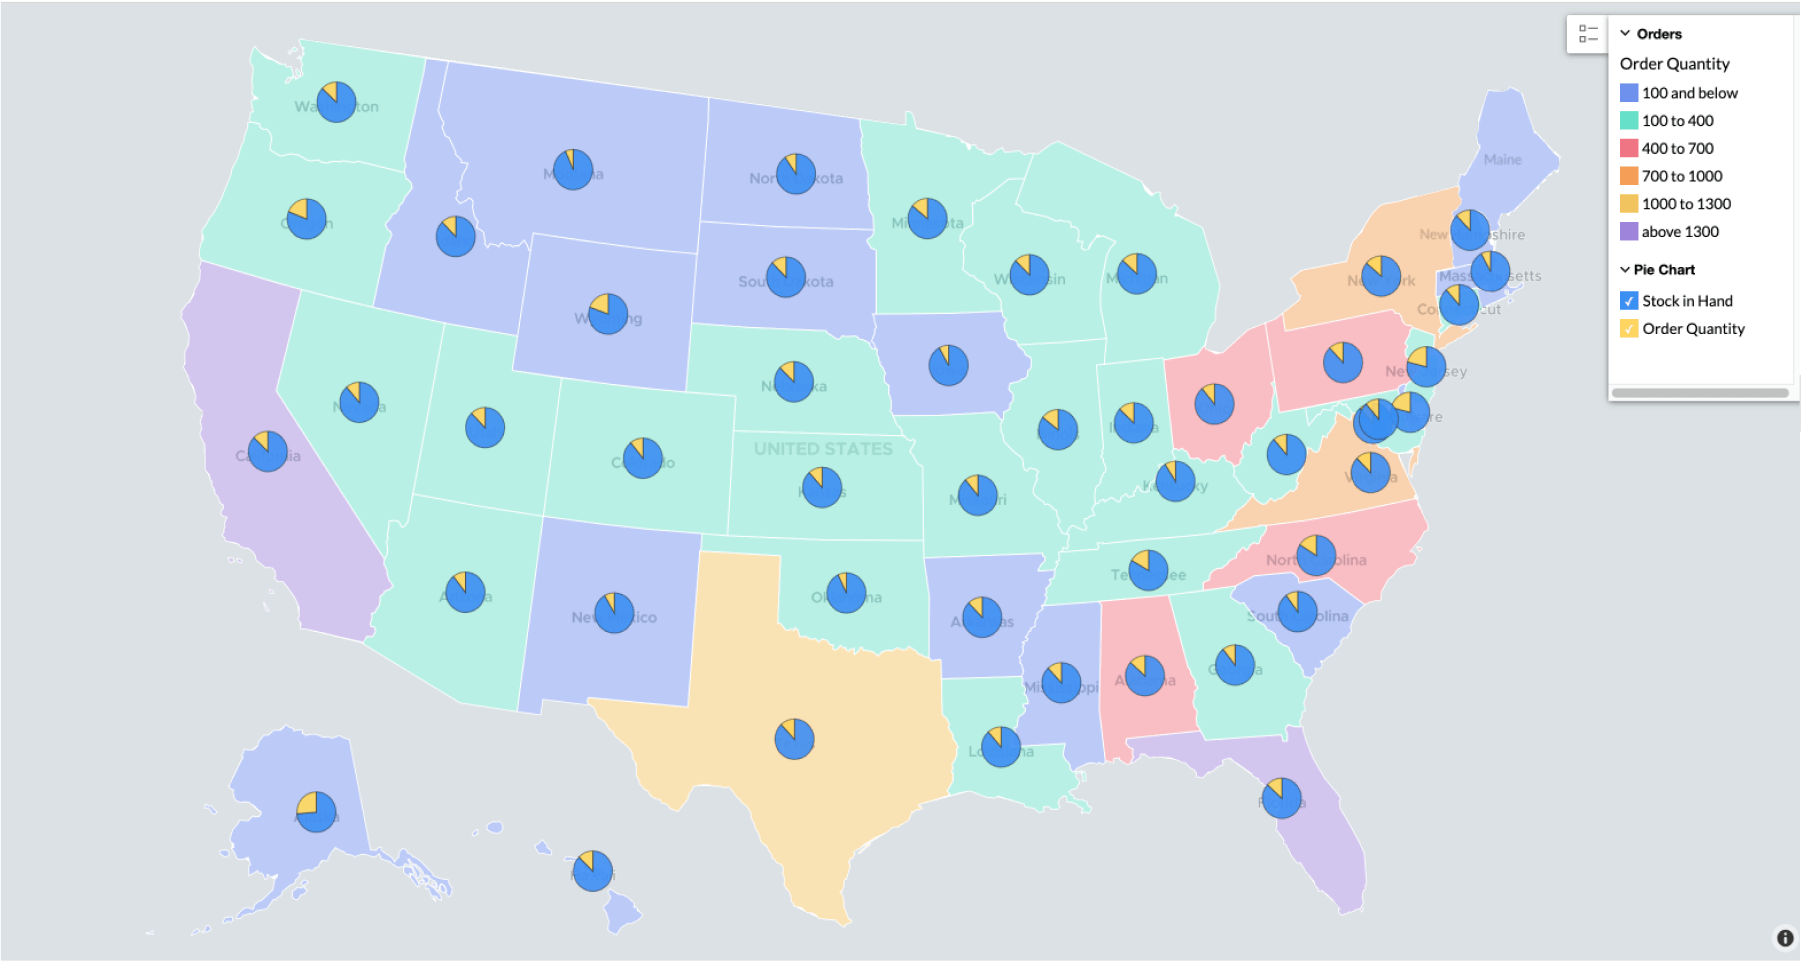
Map layering
Enhance the richness of your geo maps by adding multiple data layers to visualize different dimensions of data. Layered geo maps also support immersive interactions for enhanced data exploration.
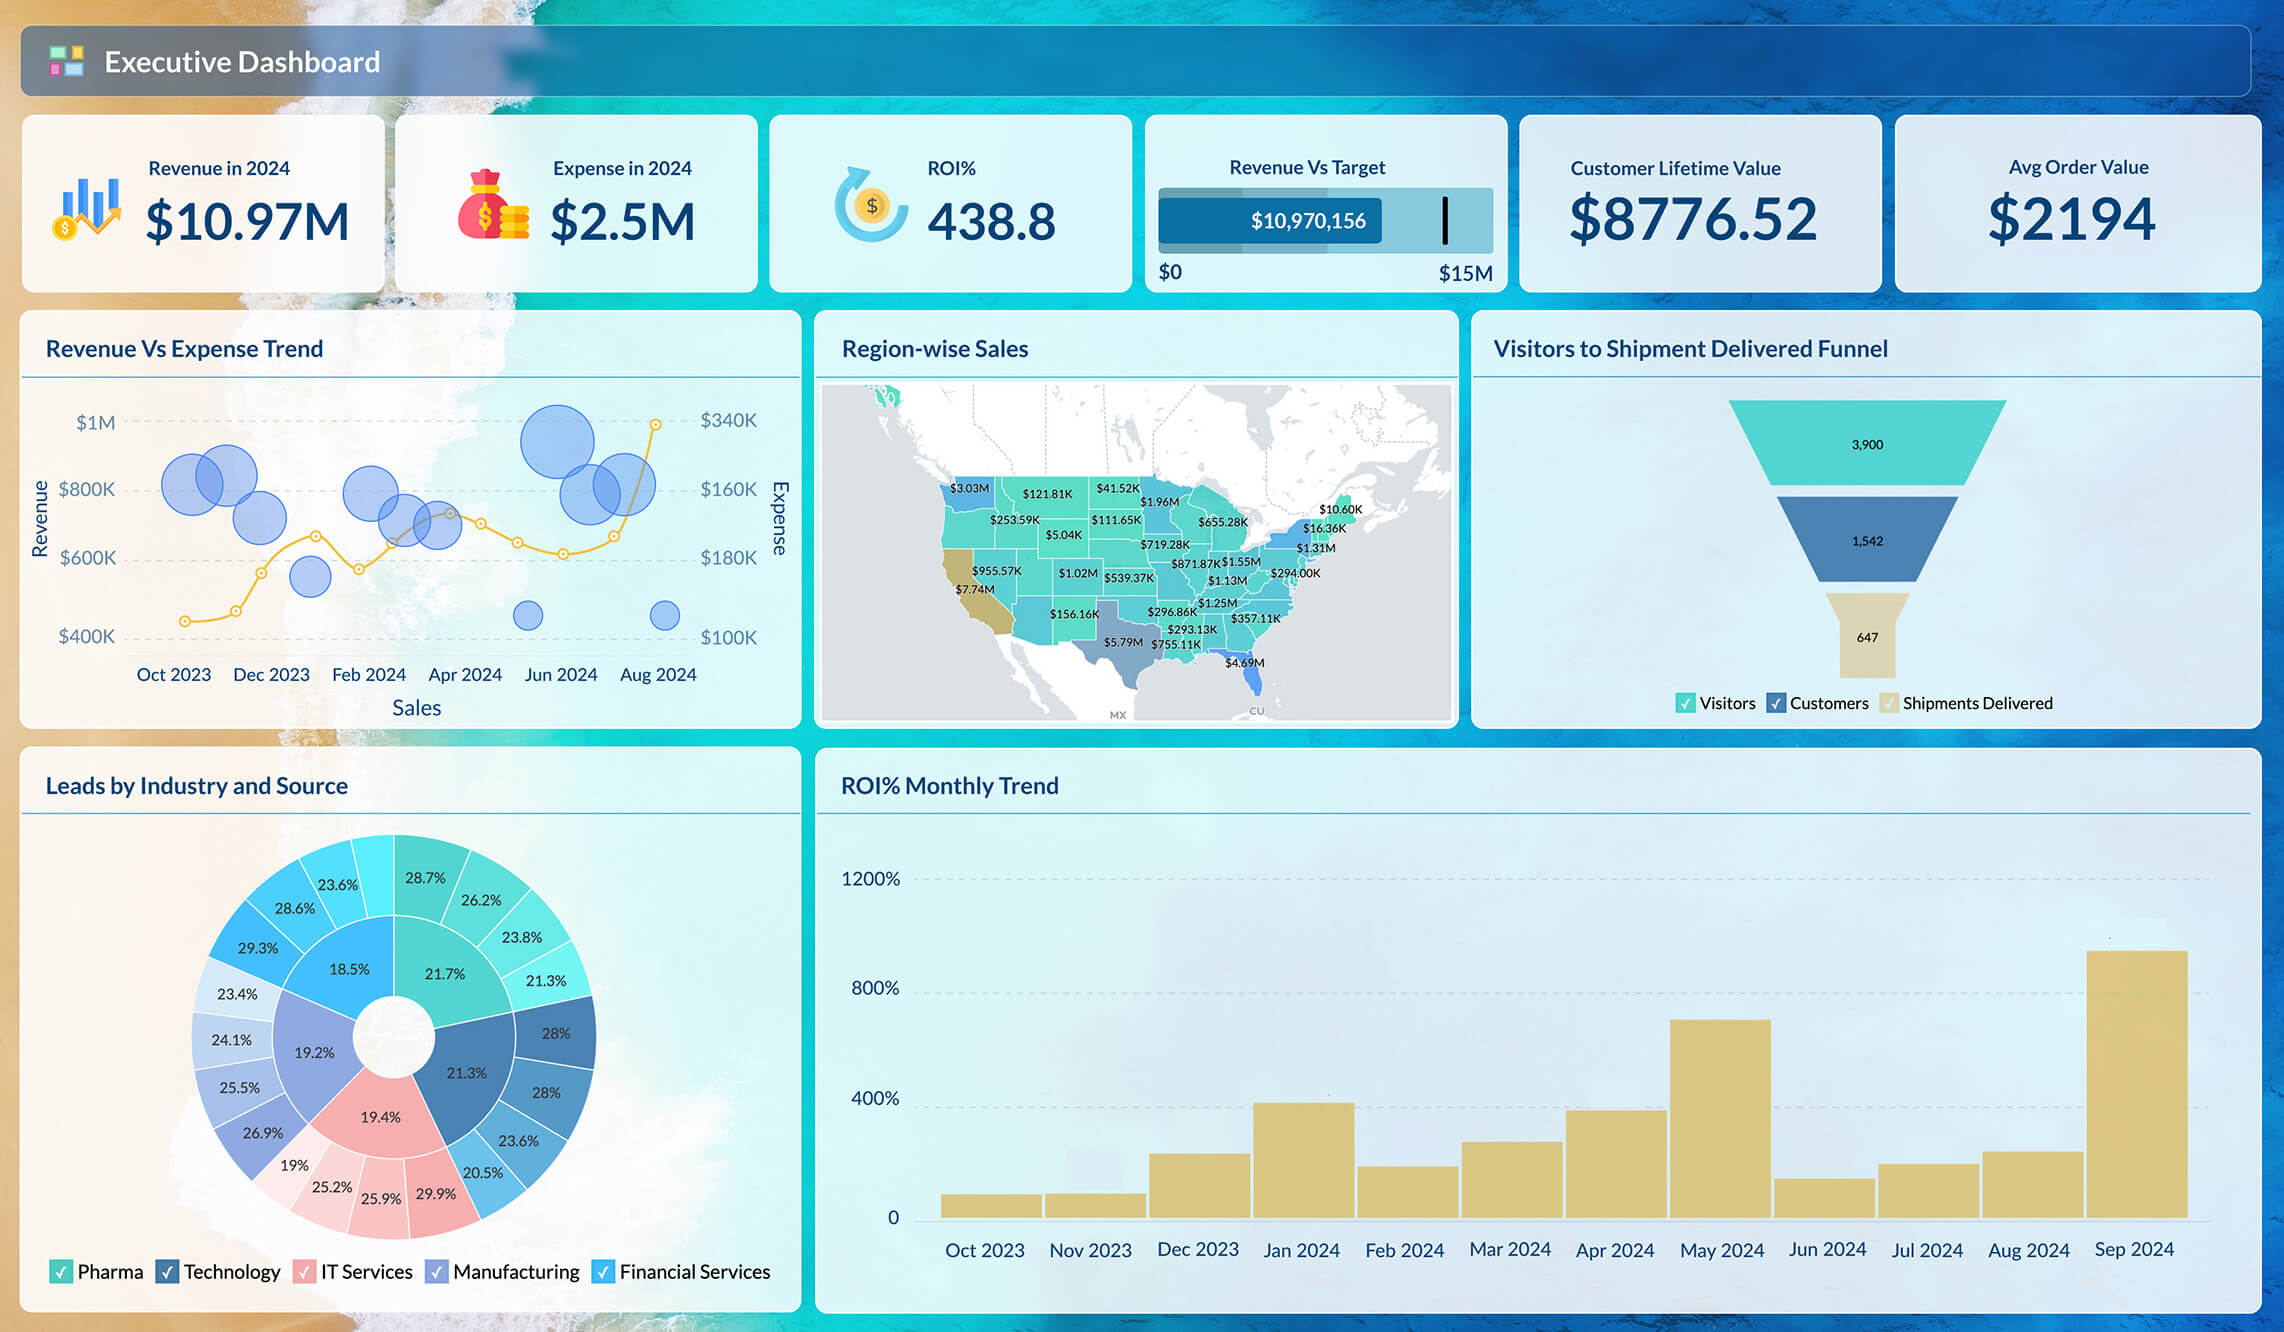
Powerful dashboard builder
We have upgraded the dashboard builder with a new layout and features like moving report views between tabs, adding images to widgets, global user filters, and new themes with images, gradients, and more.
Zoho Analytics Version 6.0
See what's released. Major updates at a glance.
Expand to see updatesRelease 2024: Zoho Analytics Version 6.0
See what's released. Major updates at a glance.
Powerful data management hub
Visual Data Pipelines

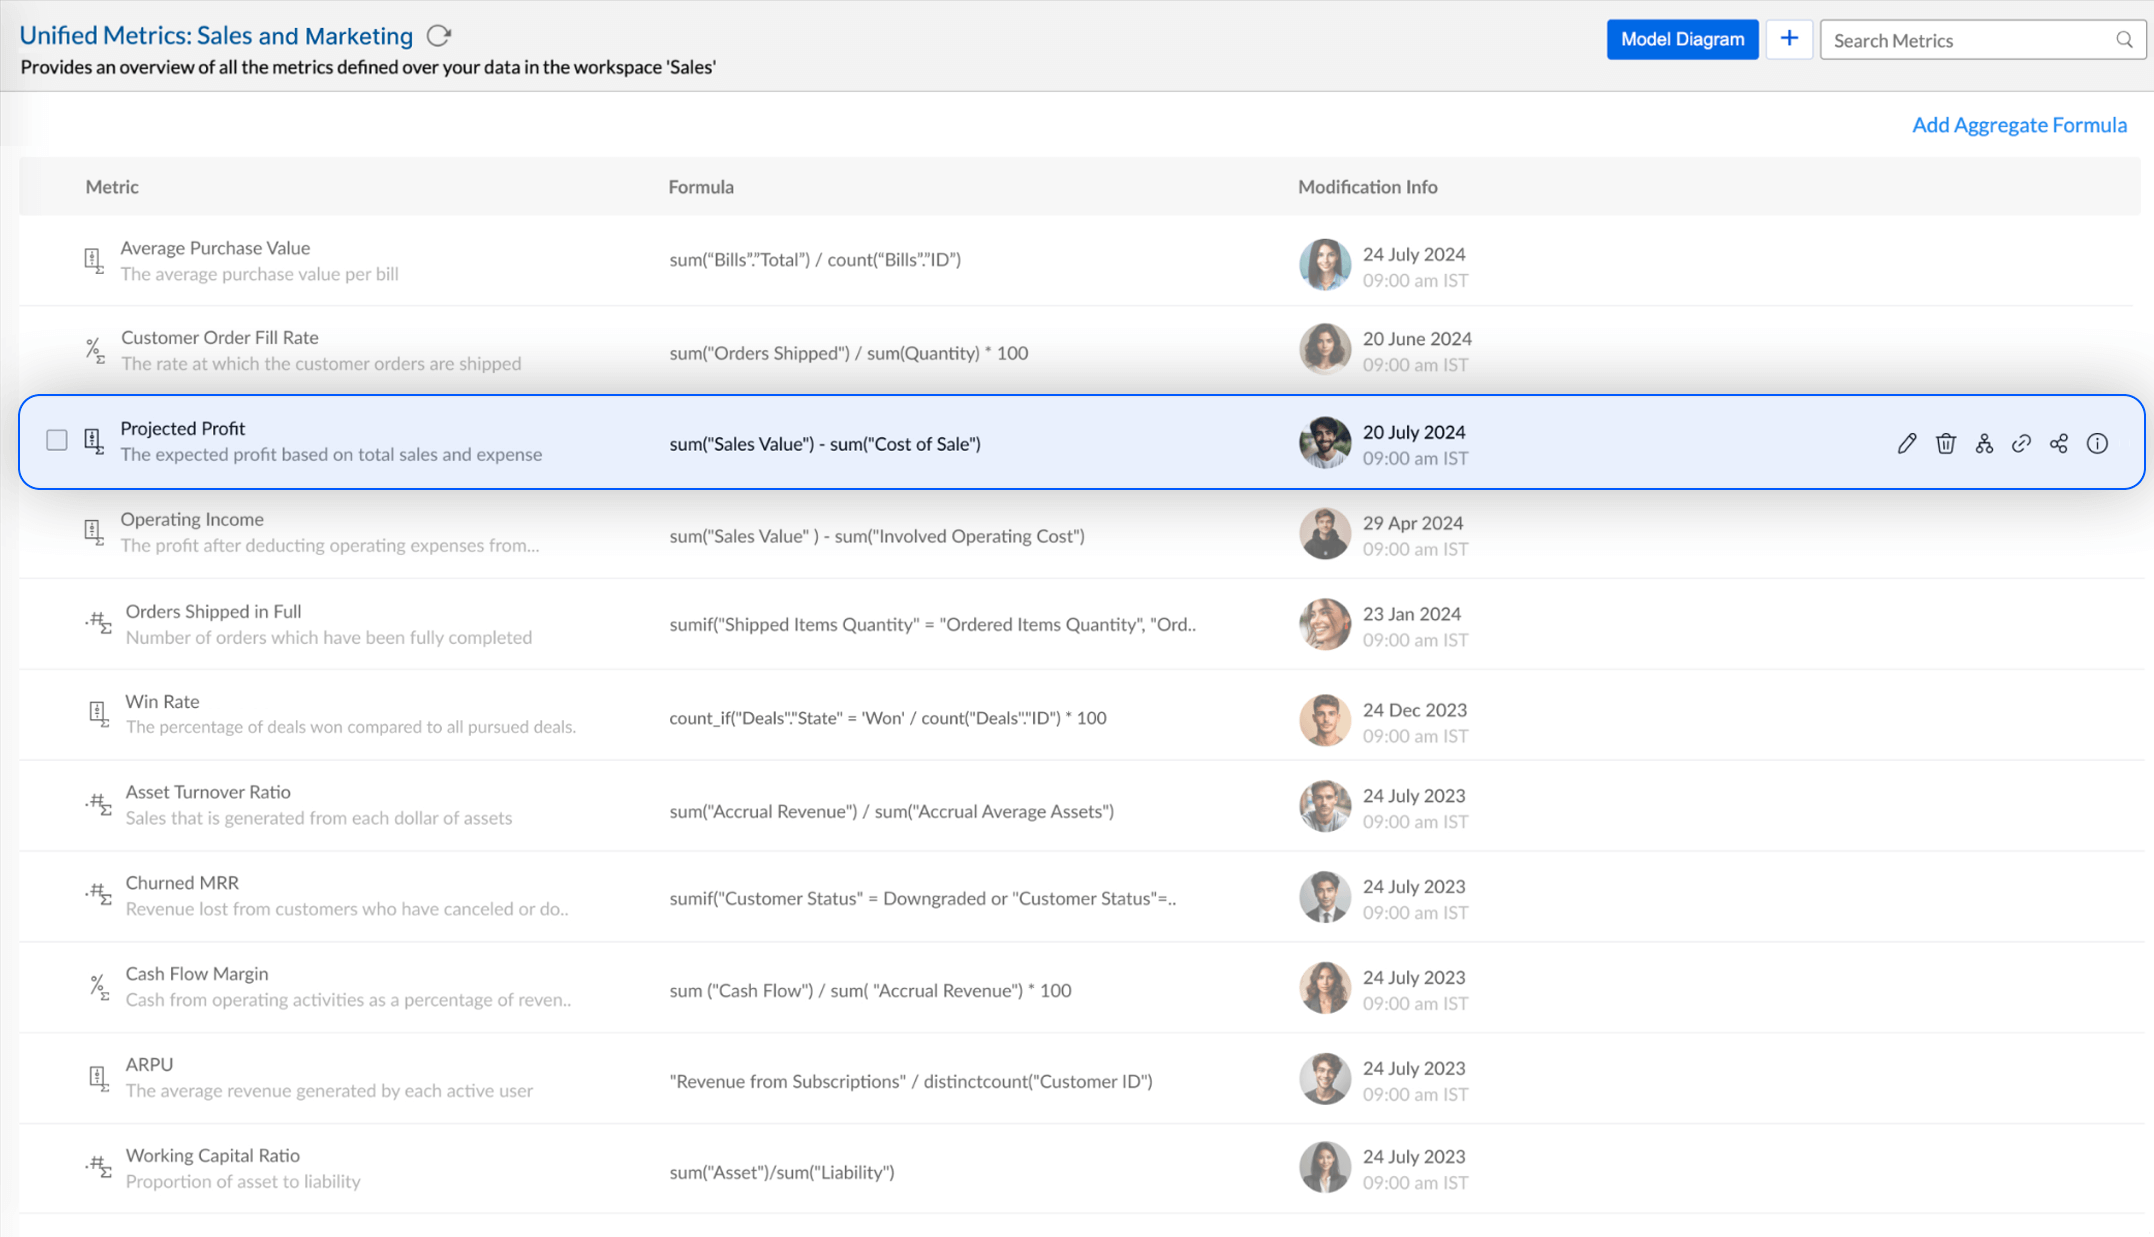
Metrics layer
Create & manage all business metrics in a single place, ensuring consistency, reliability, reusability, and access control. Metrics can be used to create reports & dashboards or consumed independently through an API.
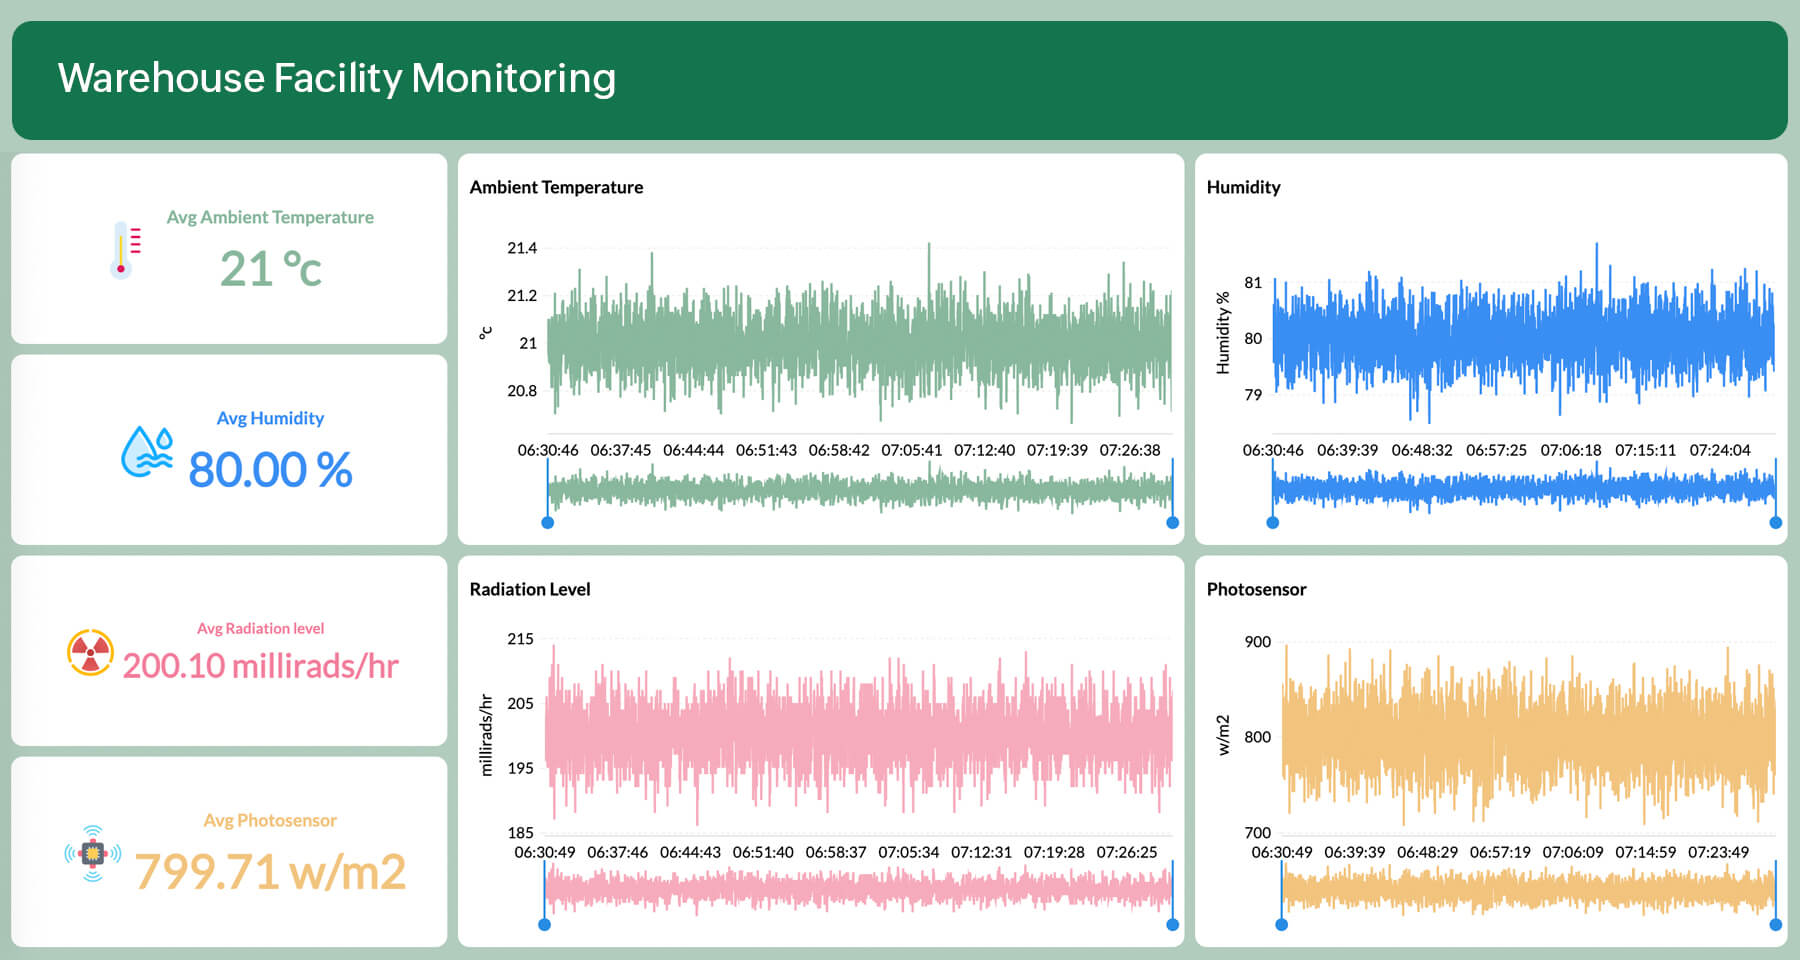
Stream analytics
Connect and analyze streaming data for real-time insights. Process streams from Google Pub/Sub, Kafka, PubNub, APIs, and more
New integrations
We're introducing 25+ new connectors for enterprise business apps and big data platforms, including Netsuite, Monday.com, Dynamics Business Central, Zoho Marketing Automation, Amazon Seller Central, Databricks, Airtable, Dremio, ClickHouse, and more
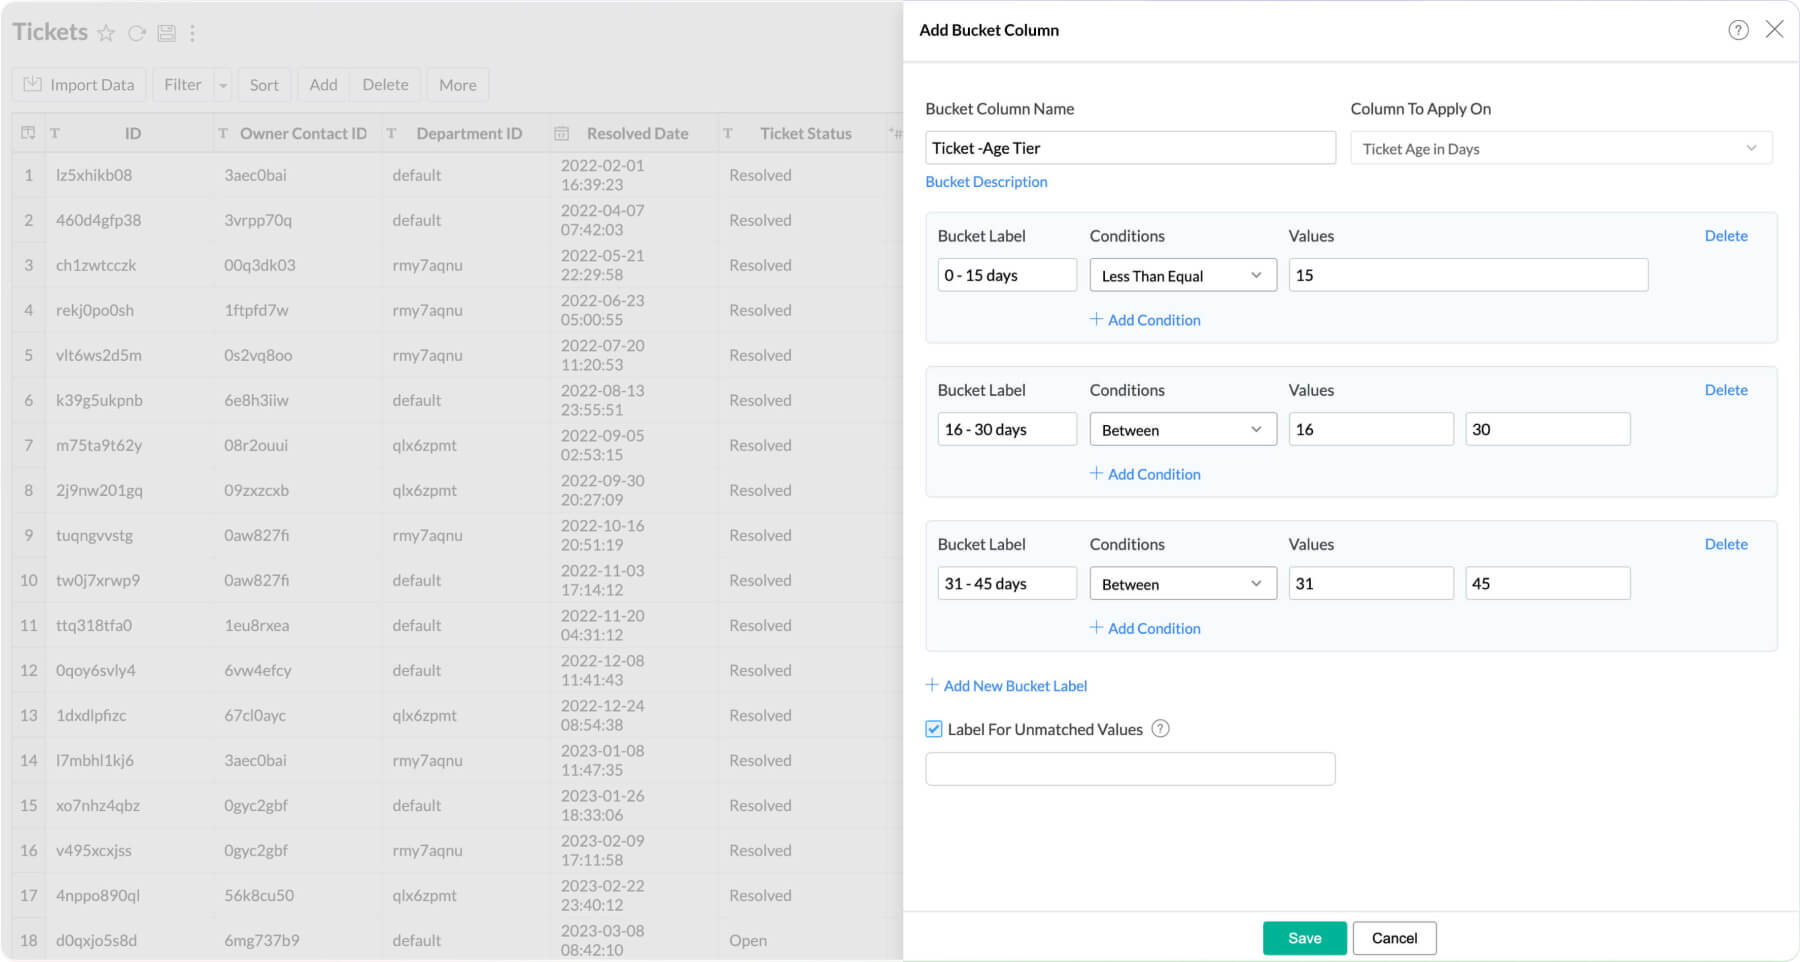
Data bucketing
Categorize or group data points easily with the 'Bucket Columns' options in Zoho Analytics to make data analysis easier.
Visualization
New visual components

Map layering
Enhance the richness of your geo maps by adding multiple data layers to visualize different dimensions of data. Layered geo maps also support immersive interactions for enhanced data exploration.
Powerful dashboard builder
We have upgraded the dashboard builder with a new layout and features like moving report views between tabs, adding images to widgets, global user filters, and new themes with images, gradients, and more.
Generative AI-infused analytics
Decision intelligence with diagnostic analytics

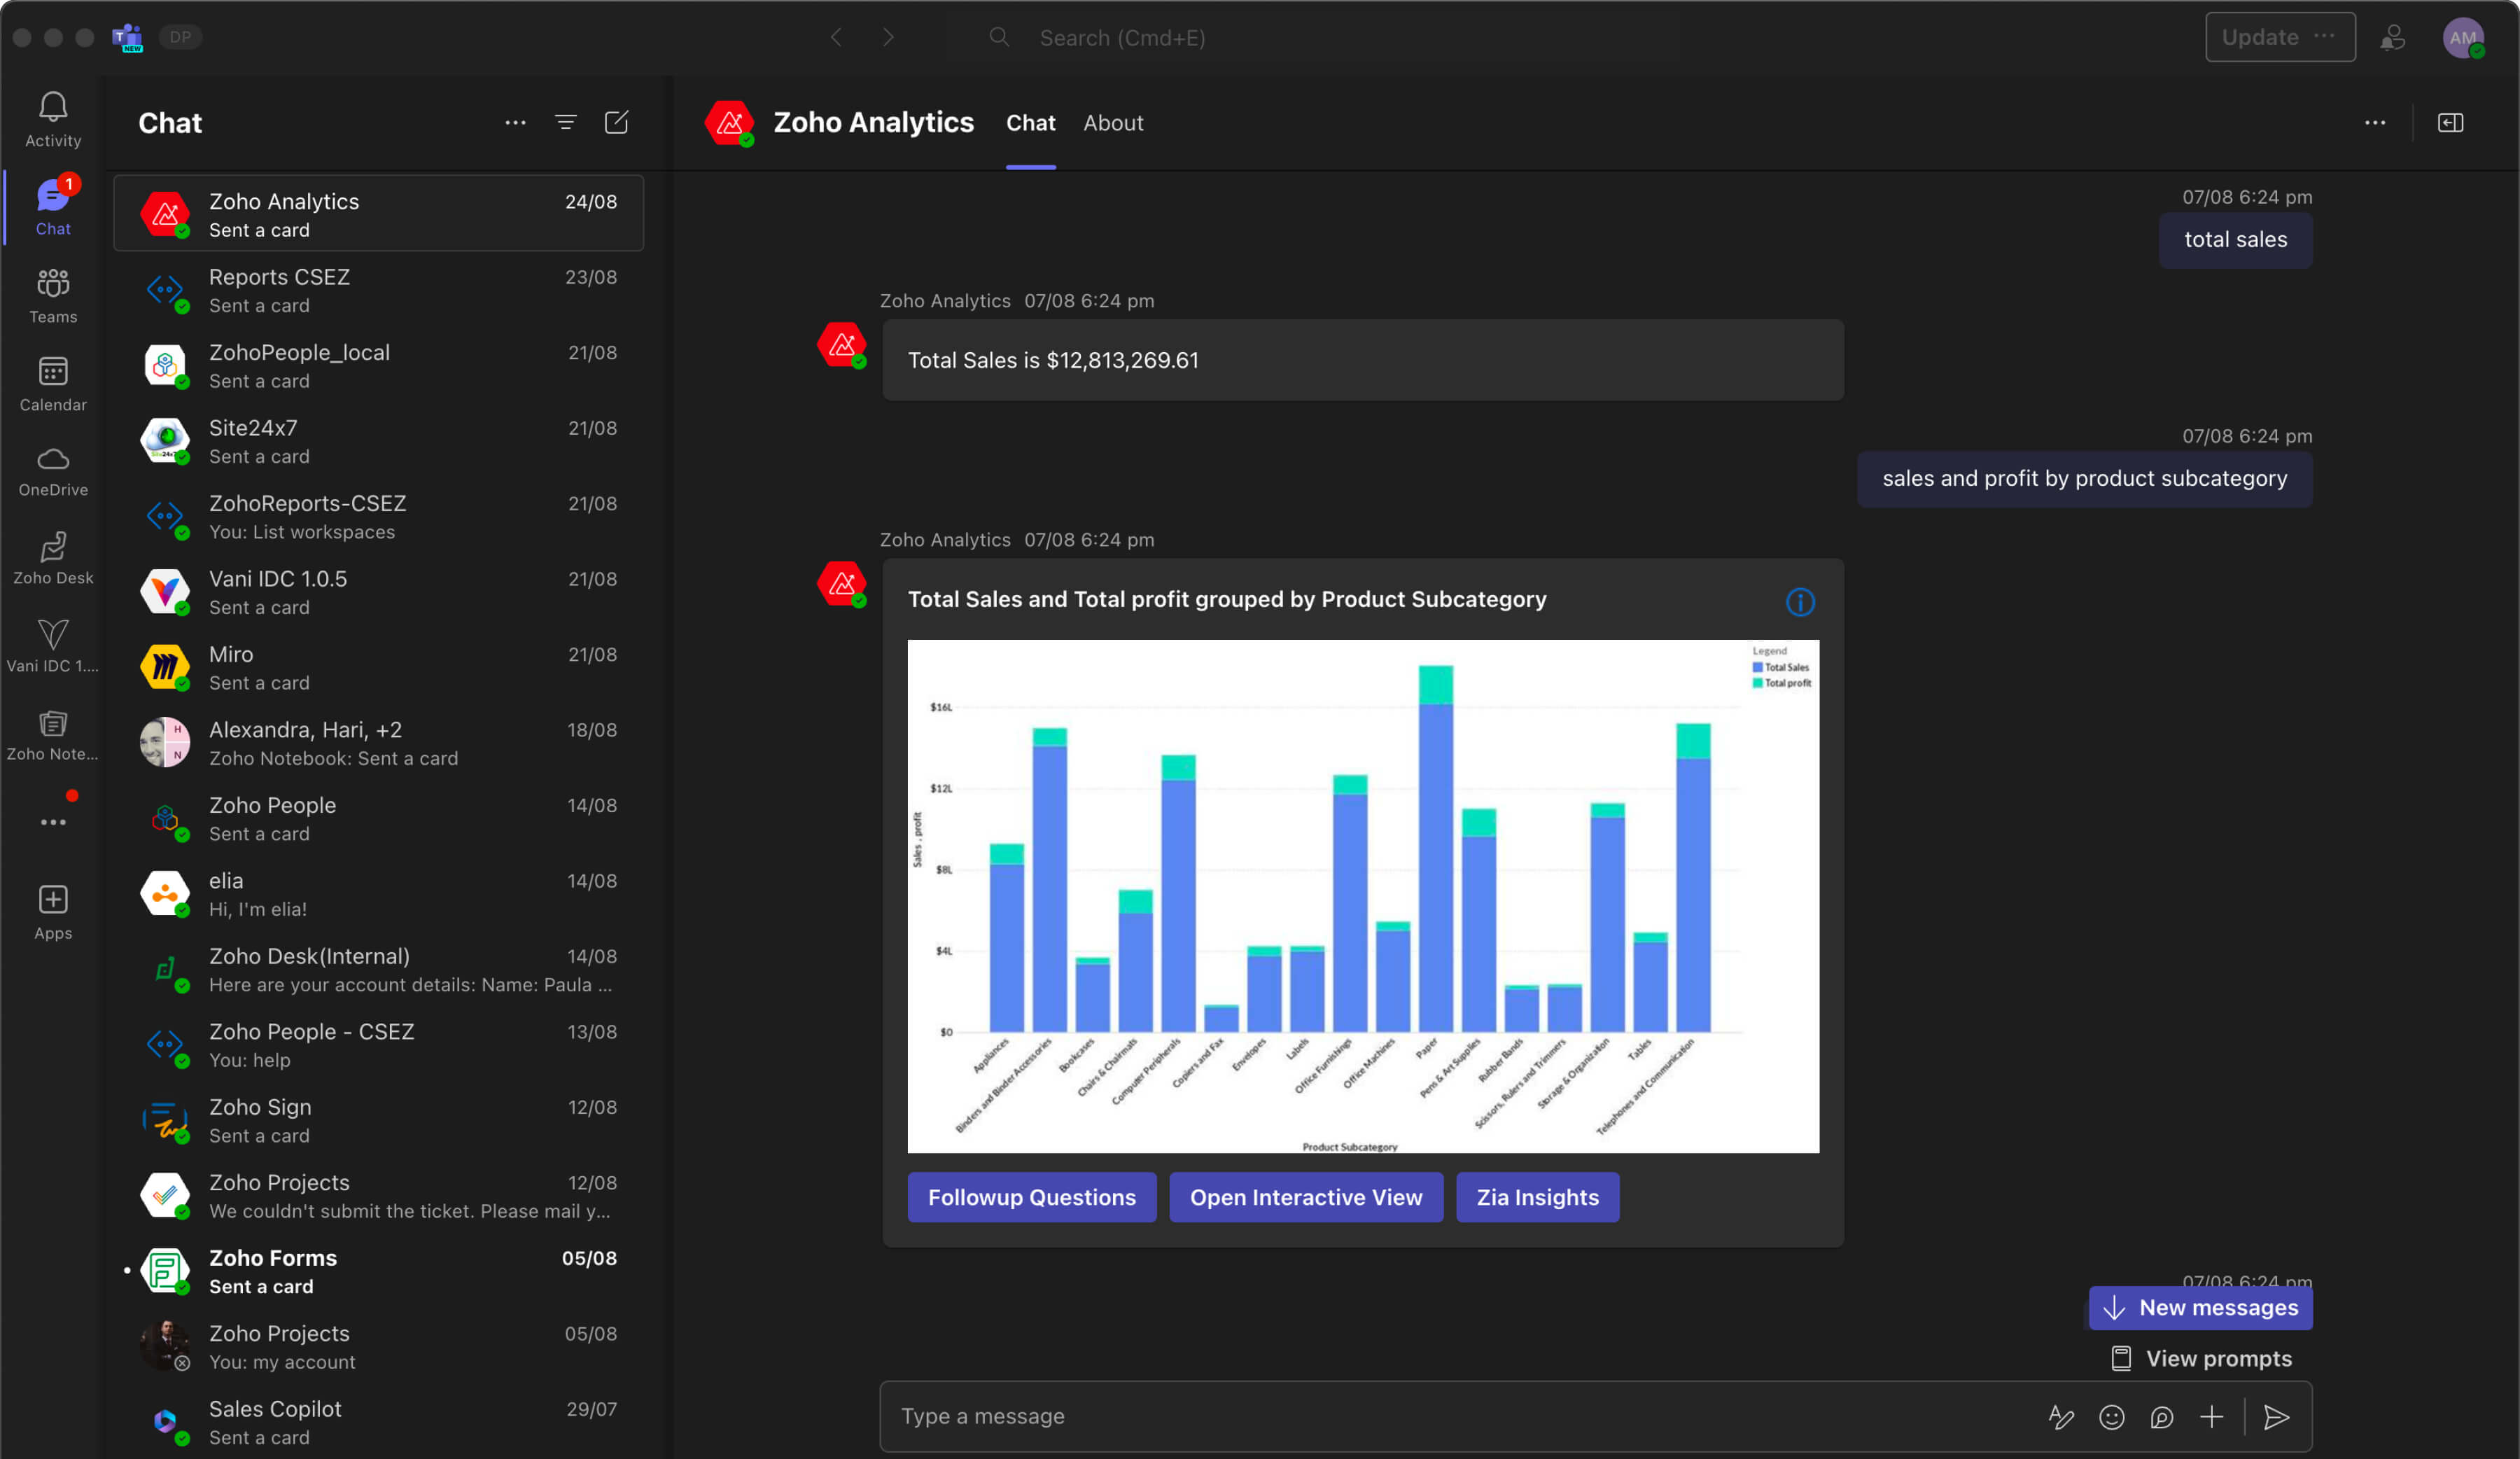
Enhanced Ask Zia
Seamlessly converse with the Ask Zia bot directly within Microsoft Teams. Ask Zia is now multilingual, with support for Spanish and French. You can also use the OpenAI-powered SQL query suggester within Ask Zia to build query tables.
Auto analysis
Generate automated metrics, reports, and dashboards from your data using the enhanced auto-analysis engine. You can also customize the output with advanced controls.

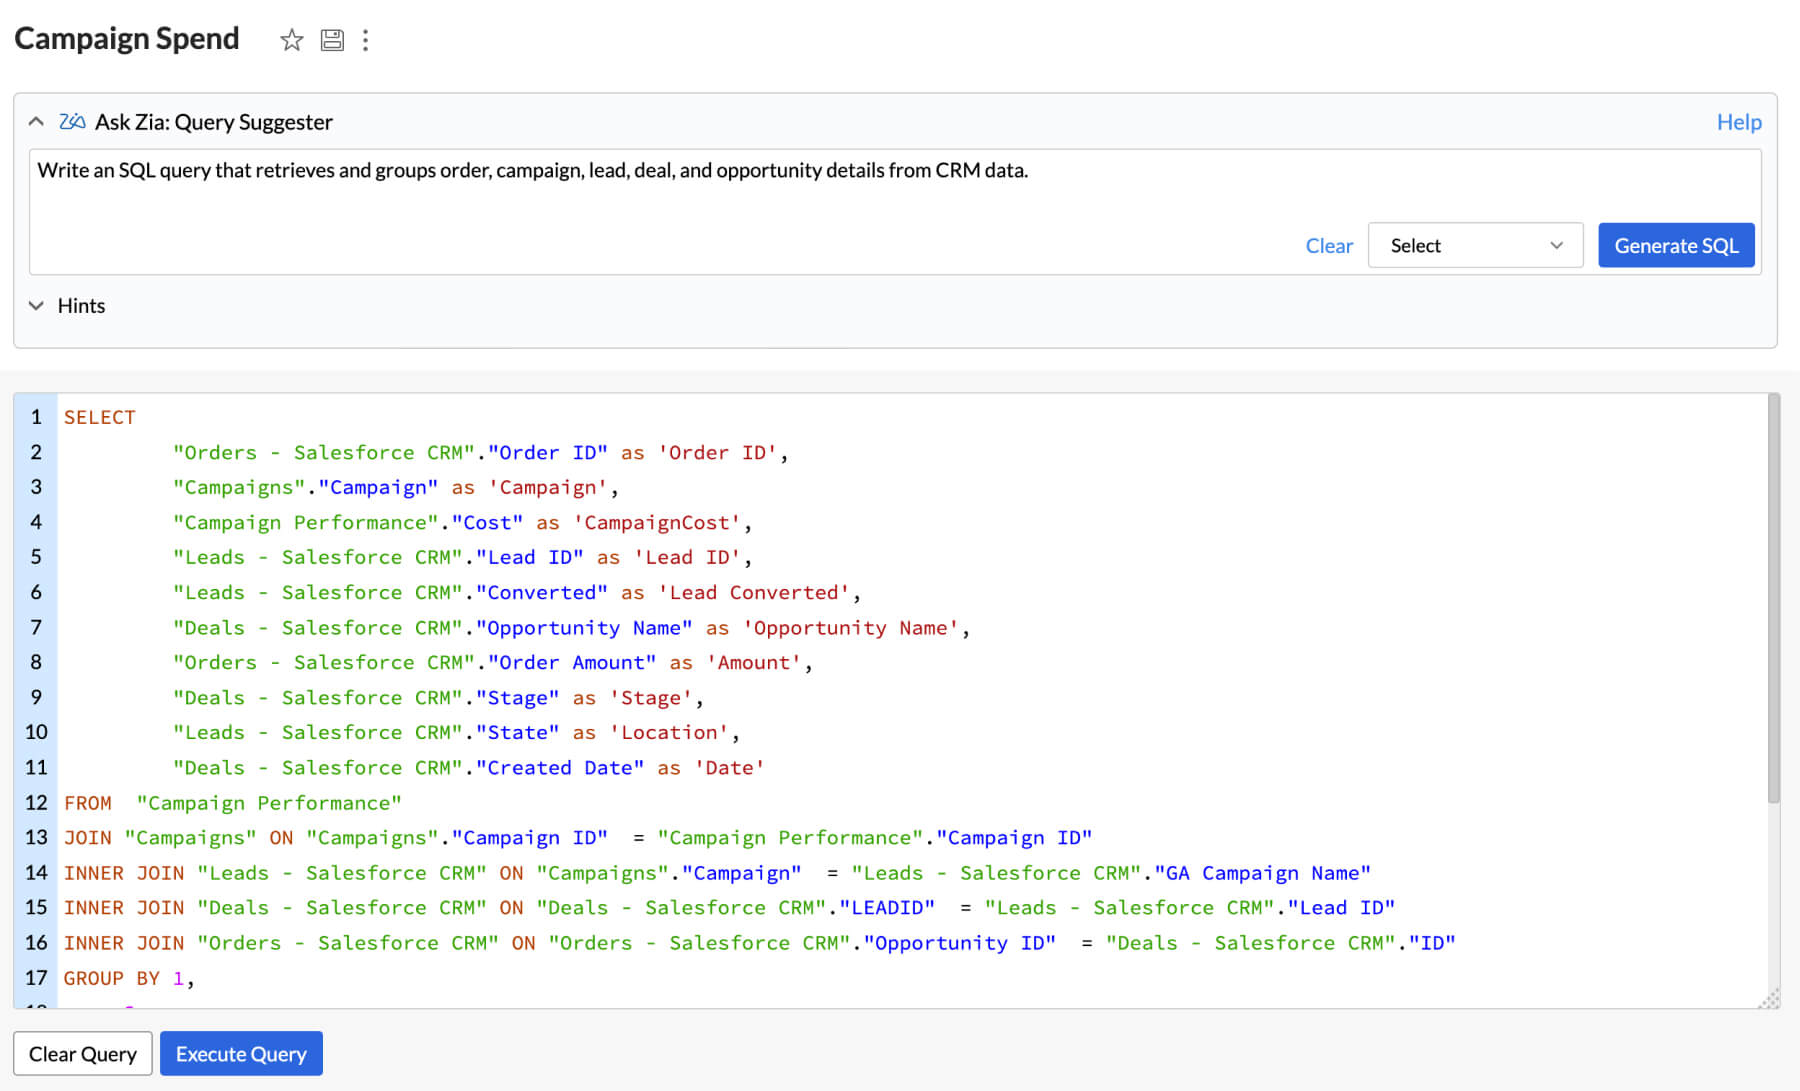
OpenAI integration
Leverage the power of OpenAI's large language models (LLMs) within Ask Zia to build complex queries, construct metrics and formulas, and discover public datasets.
Predictive AI
Anomaly detection

Cluster analysis
Visualize data grouped into clusters using a variety of ML models (k-mean, k-mode, and k-prototype). Intuitively segment and analyze data groups, for common patterns and affinity.

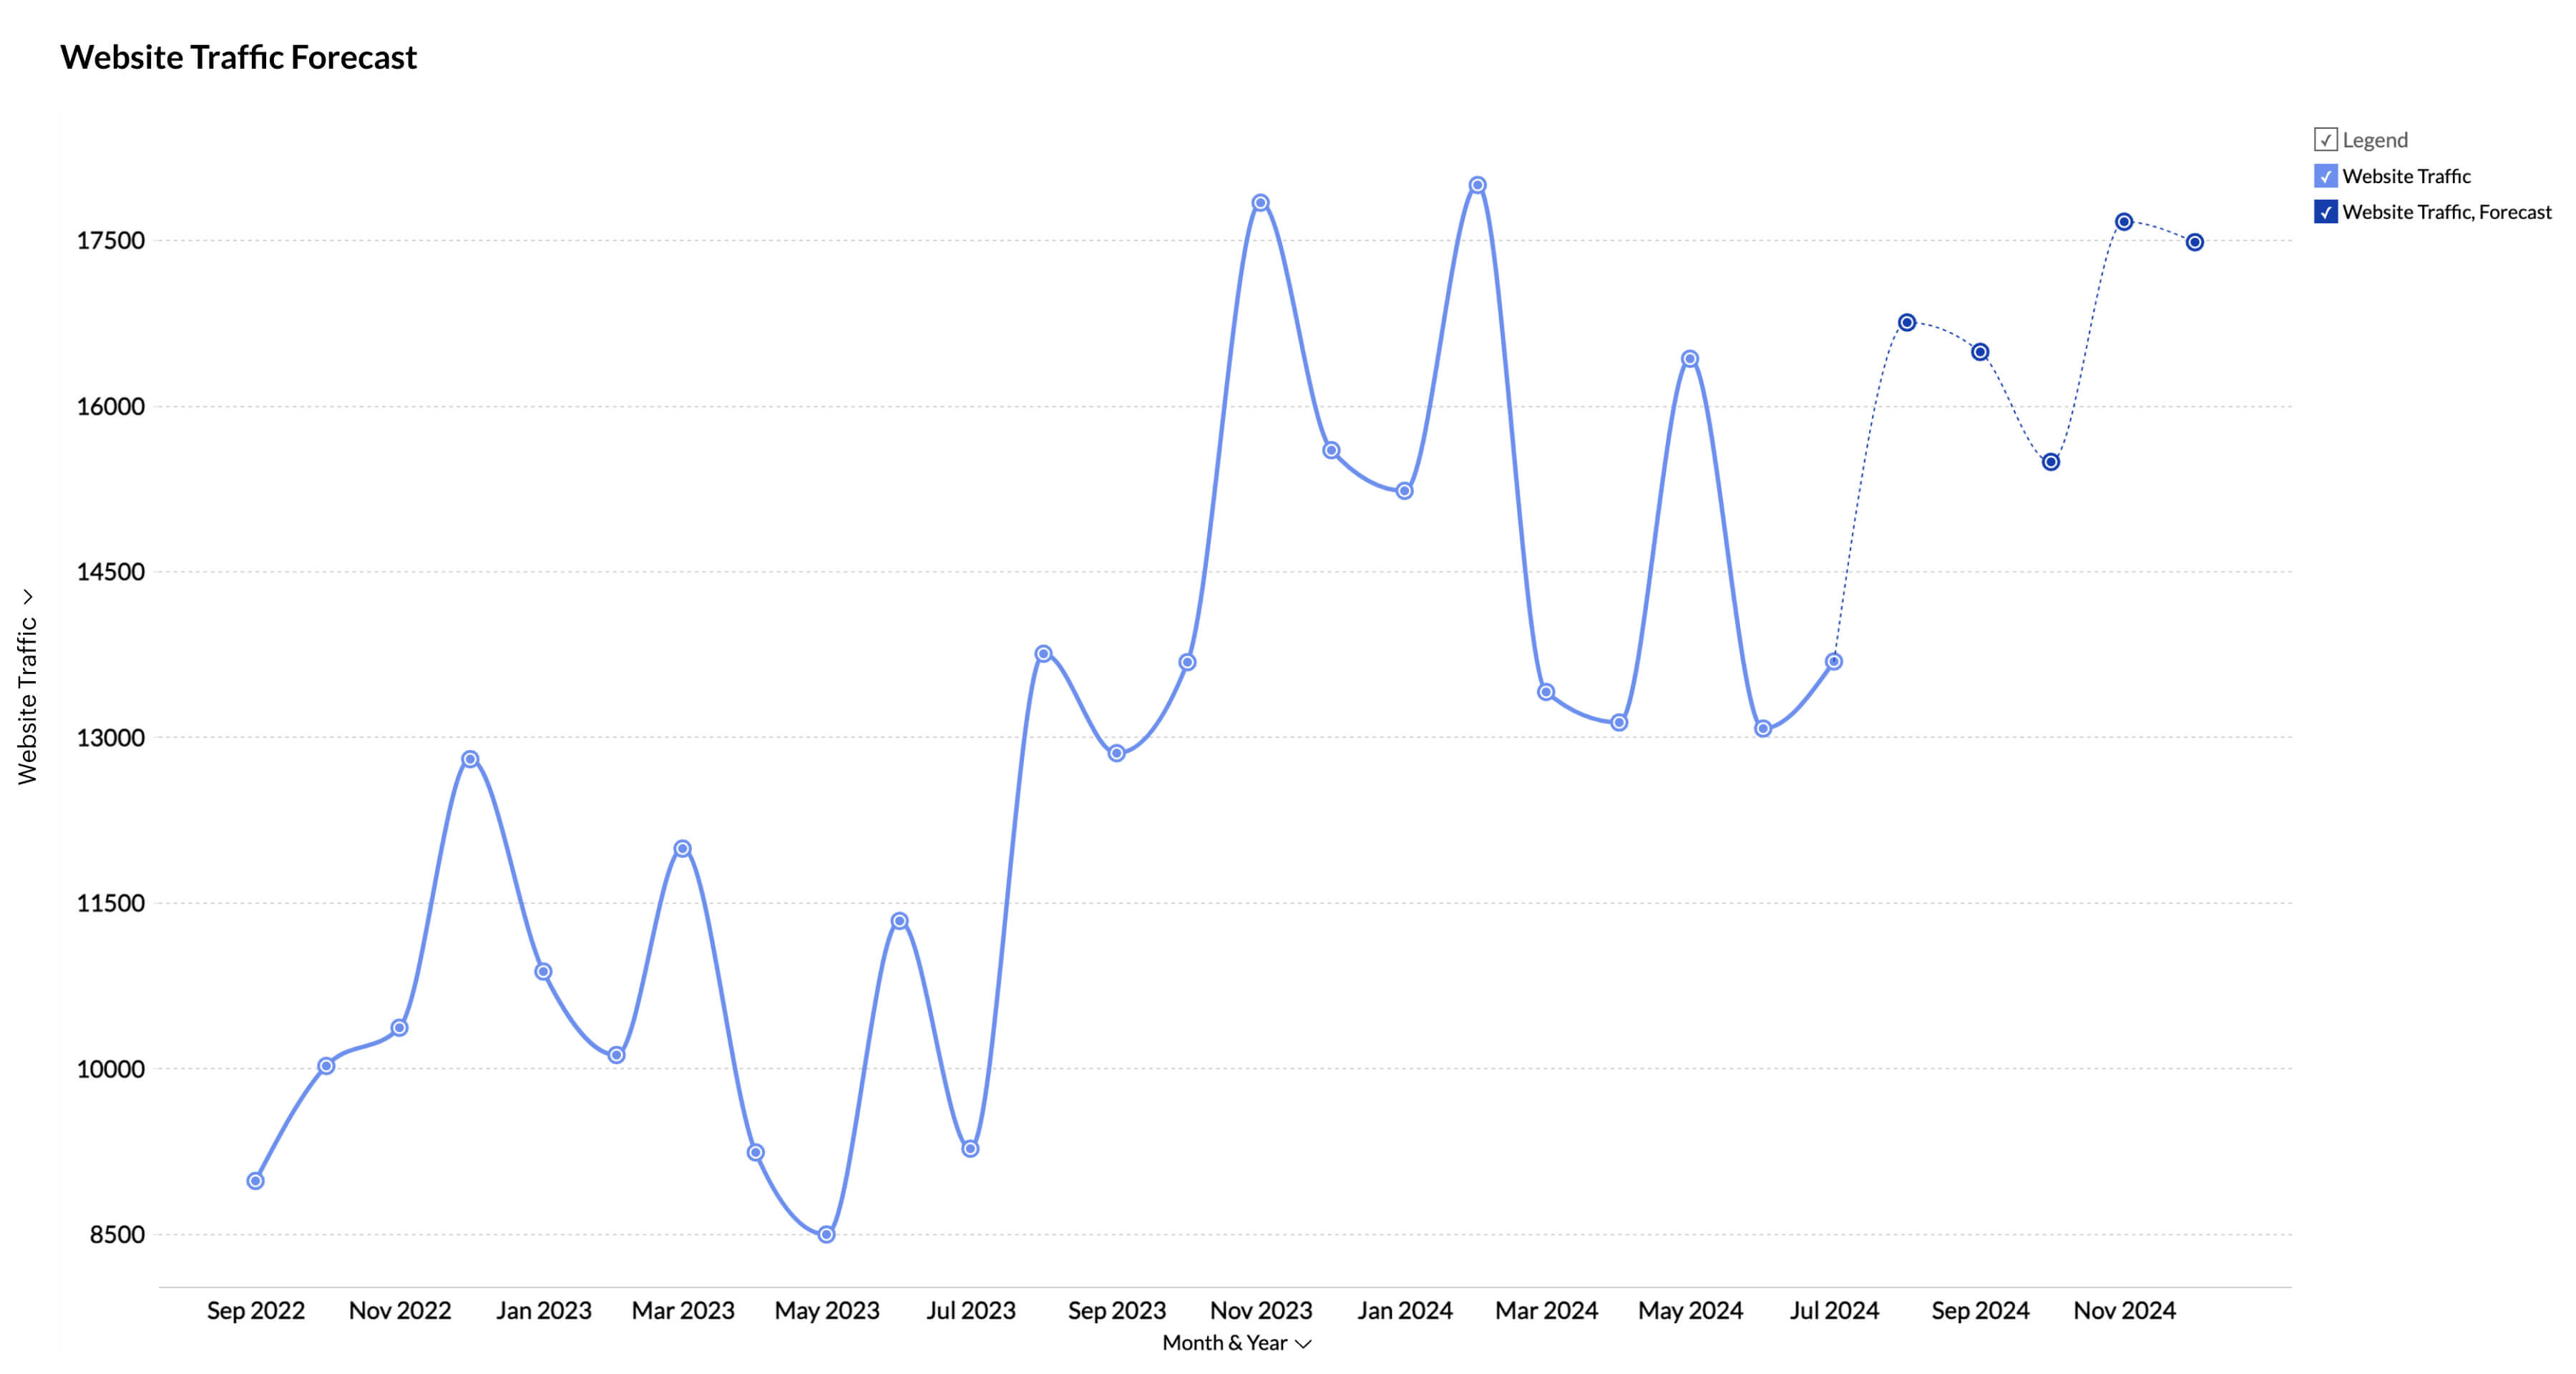
Multivariate forecasting
Our upgraded forecasting engine now accounts for dependent factors to deliver highly accurate and insightful predictions.
Data science & machine learning
AutoML

Code studio

Collaboration & data storytelling
Visual narratives

BI fabric
Create unified BI portals by collating insights from other BI applications, such as Tableau and Power BI. Set up fine-grained access controls on the portal to ensure secure access.

Insights in slideshows
Zia Insights narratives can now be easily integrated into your slideshows, providing contextual enhancements to your data story.

Export as PPT
Export multiple views as a Microsoft PowerPoint presentation. Enhance security by protecting the file with a password.

Extensibility
Other features
Hear from our customers

Alun Rafique
CEO and Co-Founder, Market Dojo

Tom Vogler
Head of Service and Support, IMT Matcher