Dashboard
The dashboard for Functions helps you view the usage statistics of all your functions.
You can view the total number of function calls you have made consumed by the functions that were executed in the selected time duration.
The image below shows the total, utilized, and unutilized credits for your CRM edition.

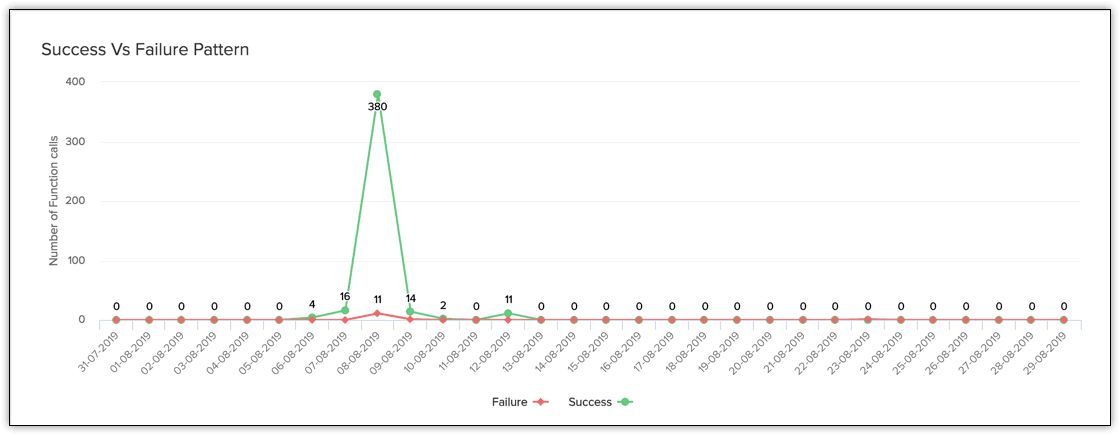
You can also compare the success and failure pattern. This graph gives you the number of function calls that failed or succeeded in the time duration specified.
What can you see on the Dashboard?
Function Calls by Language
Do you want to know how many function calls you have made based on the language the functions are written in? This doughnut chart gives you the stats needed.

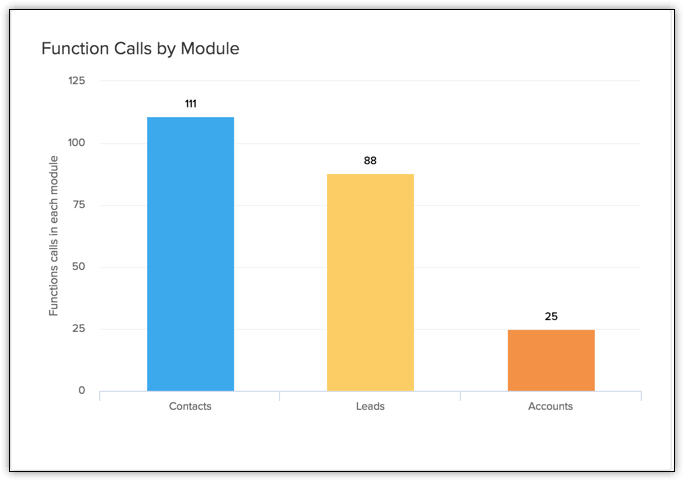
Function Calls by Module
This bar graph depicts the number of function calls made from every module.
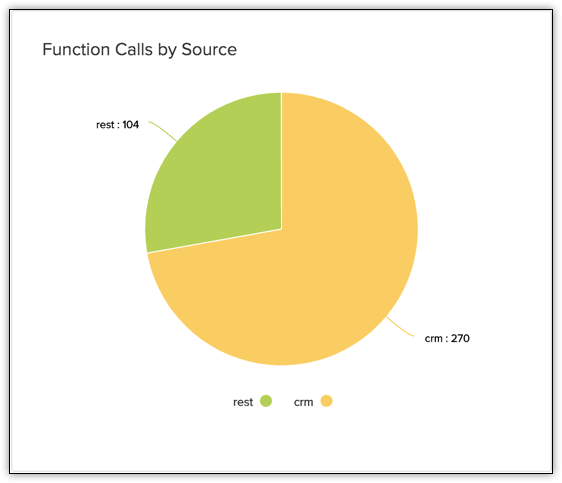
Function Calls by Source
This chart depicts the number of functions executed based on the source of call such as CRM, REST API, and Extensions.
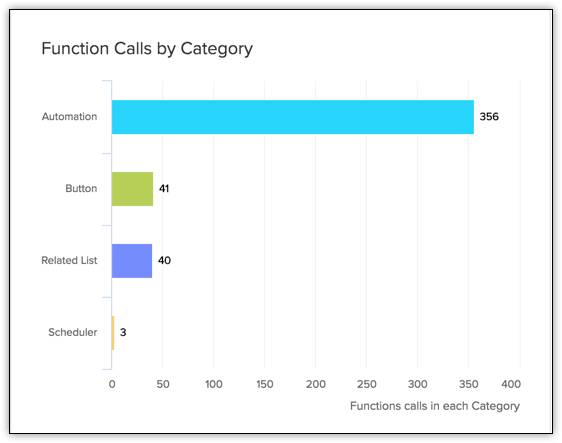
Function Calls by Category
This bar graph depicts the number of function calls made from different categories such as button, automation, REST API etc.
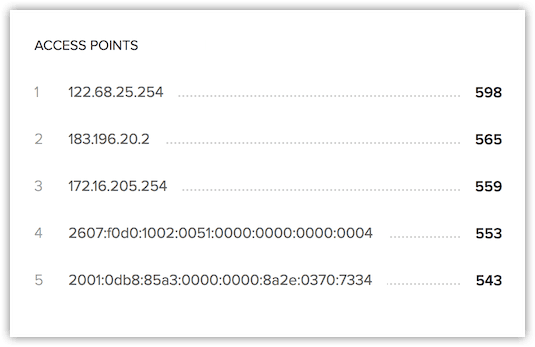
IP Address Based
You can find the statistics based on the User's IP address on the Graph view page. In other words, the stats are displayed based on the Access points of the Users. The top five IP Addresses classified based on number of API calls made from them will be displayed.
