An online freight forwarder tracks its assets and fleet with Zoho Creator
"Our ground team handles hundreds of orders on a daily basis, and we have 360-degree visibility every single day"
Karteek Narumanchi, Associate Director, Blackbuck
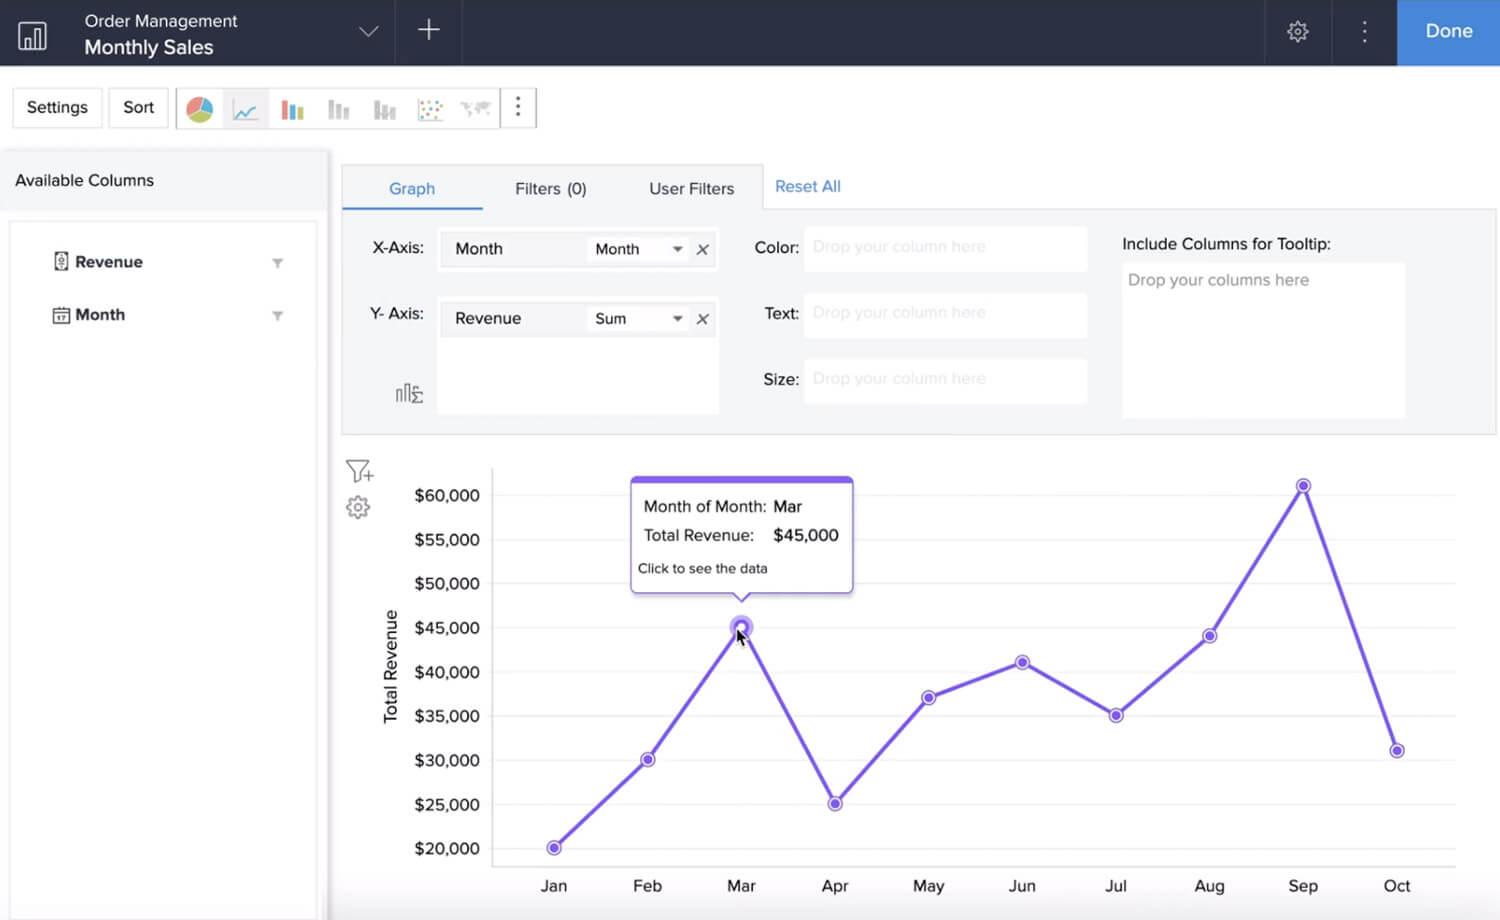
Over 40 types of charts
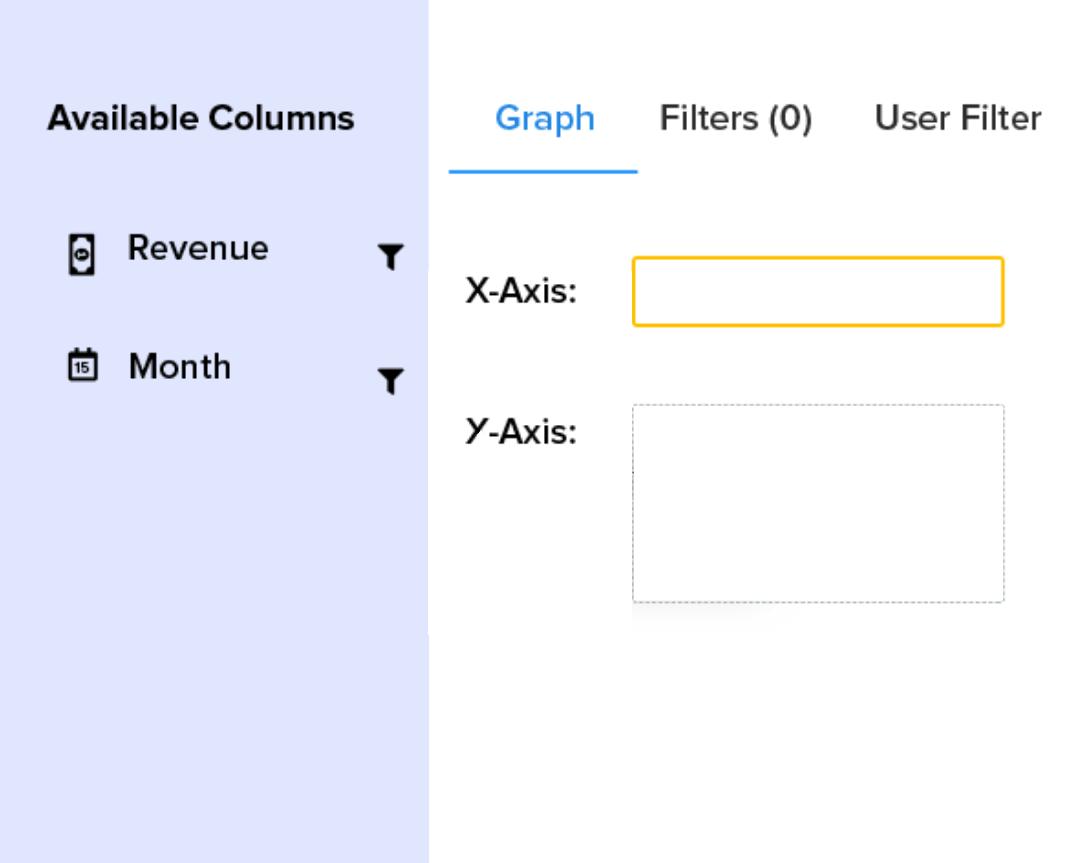
Visualize your data instantly
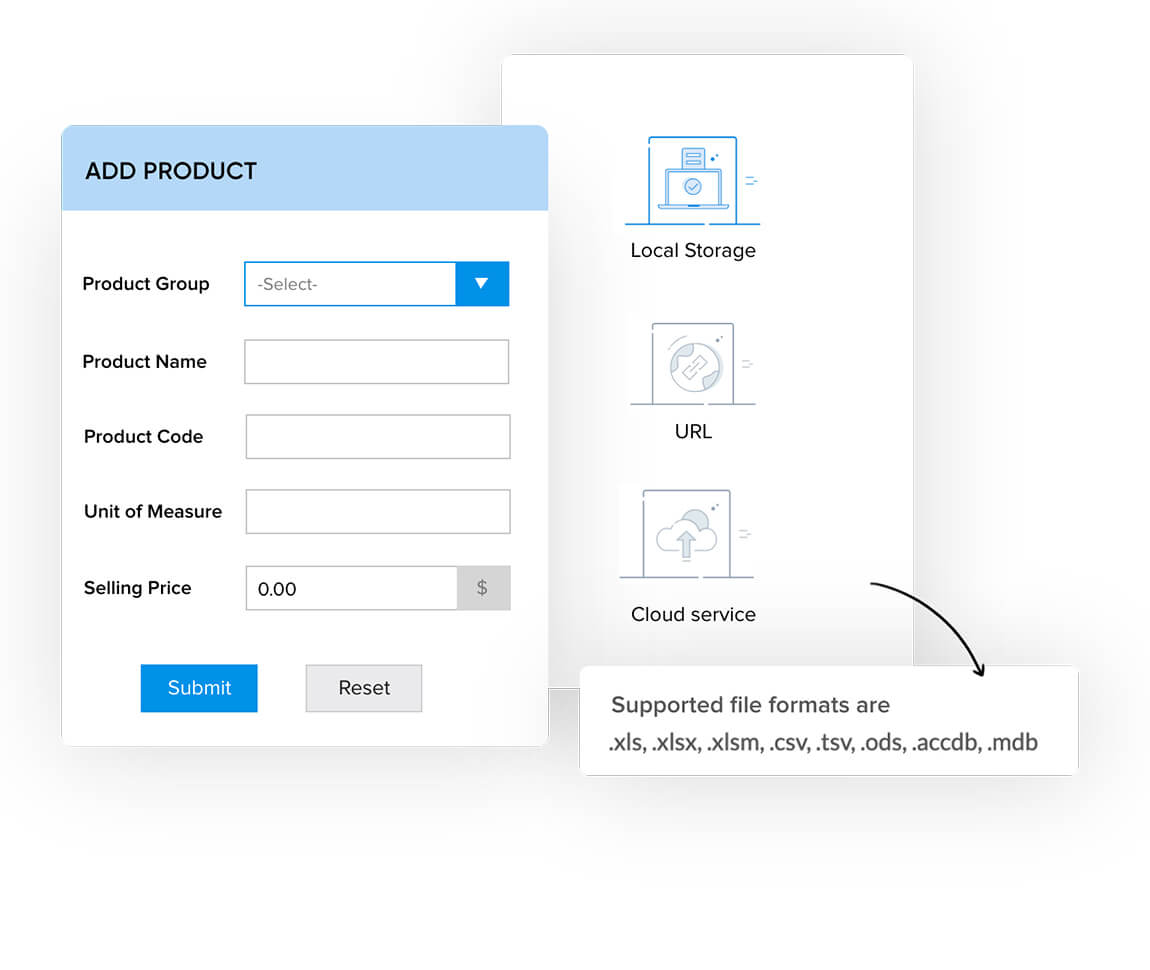
- Collect or import data
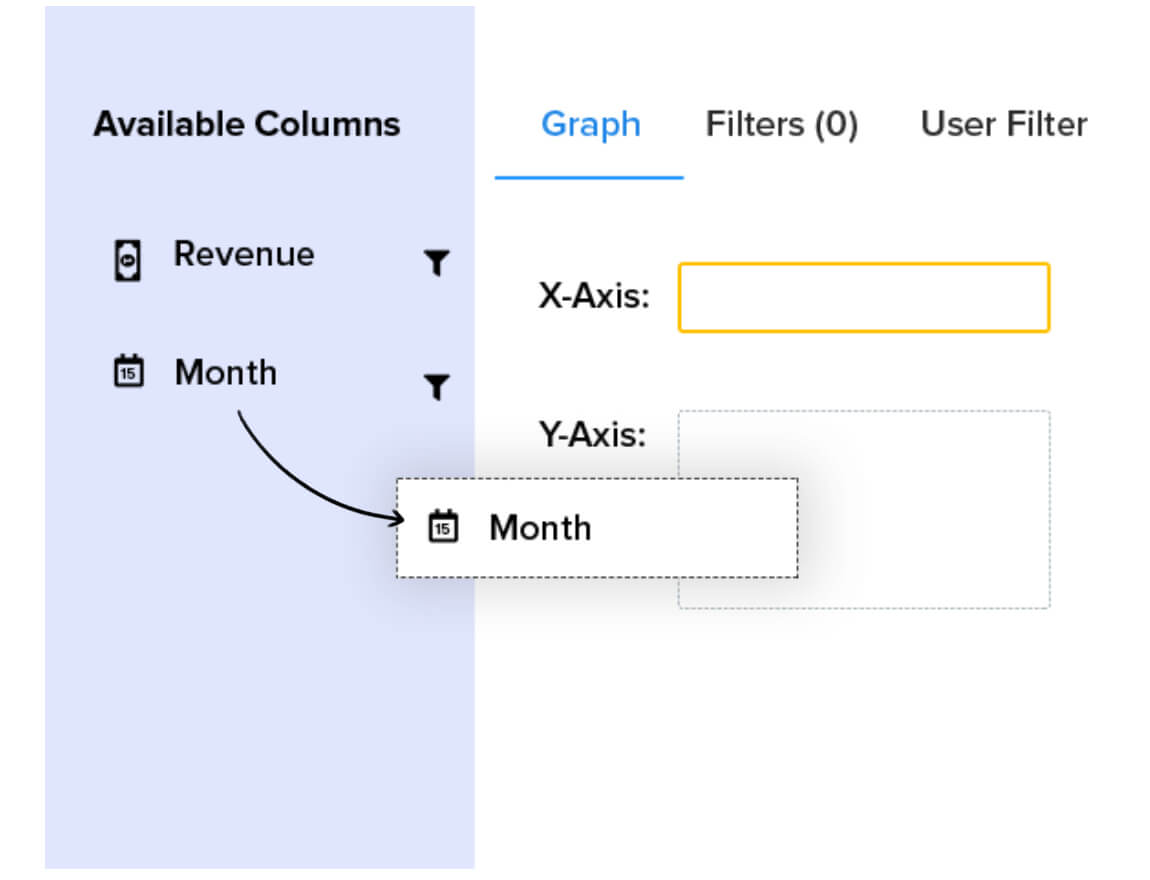
- Drag and drop fields
- Share in a click
- Export, email, or print
- Access on any device
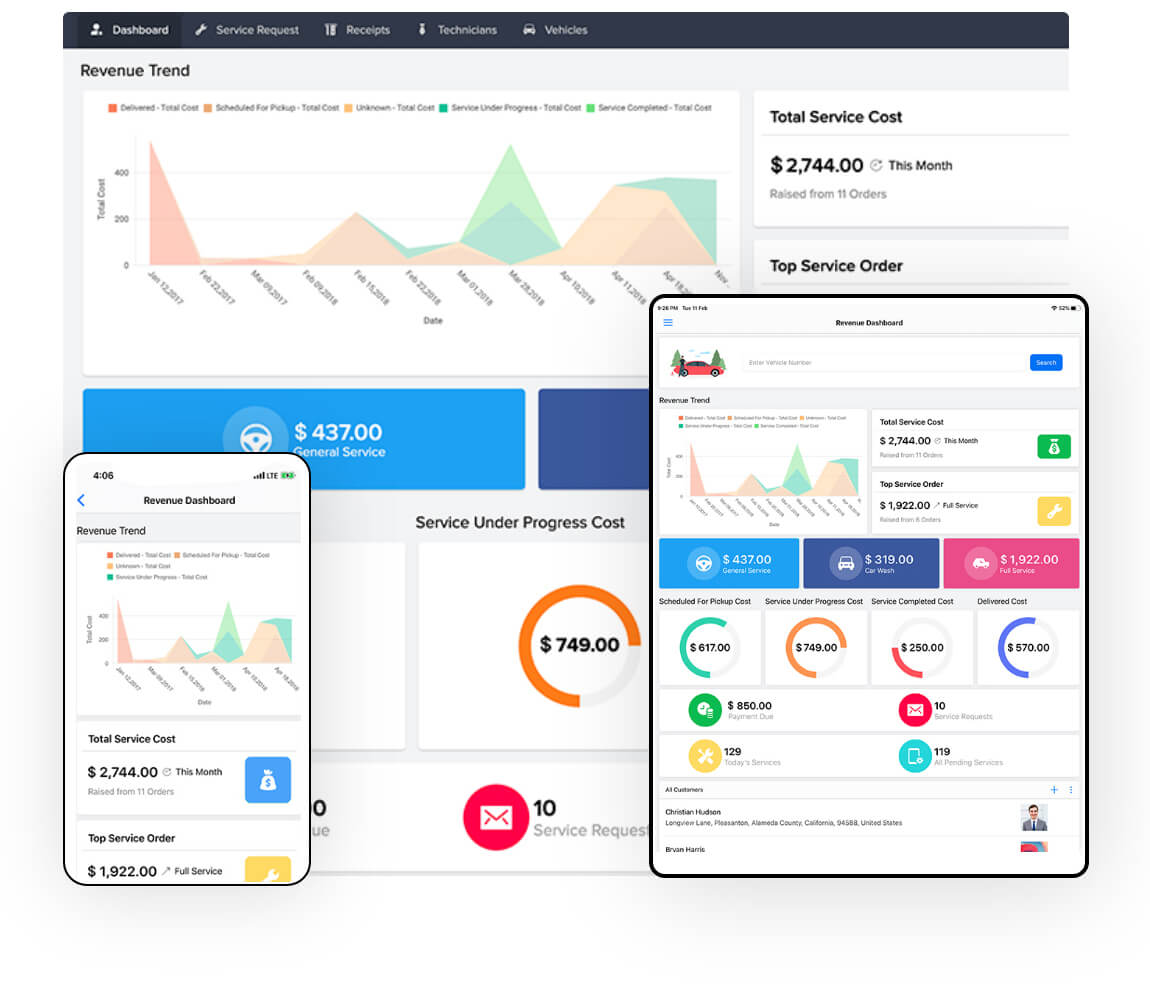






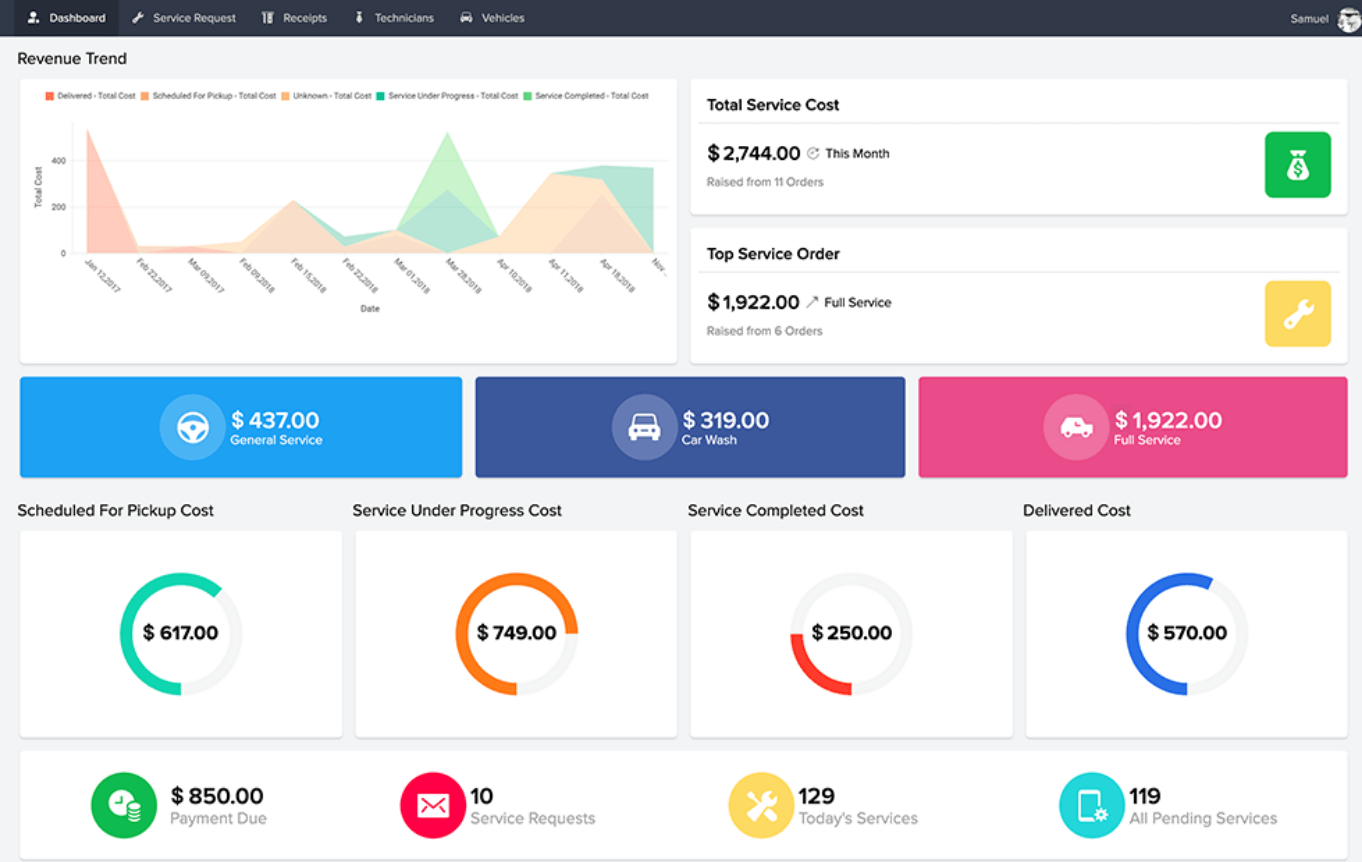
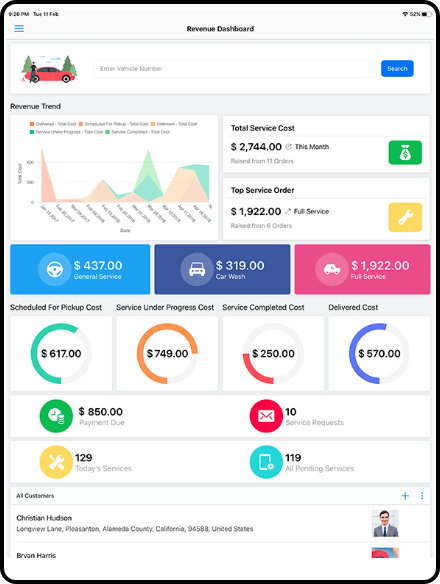
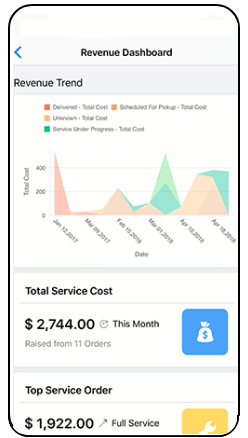
Know where your business stands on its most important metrics
Drill into details
With a single click, dive from overview to granular and discover the root cause driving your numbers.
Highlight crucial data
Color-code your reports in a way that's easy for you to interpret; whether by information, date, or task.
Get alerts when key metrics change
React to small changes before they become big issues by setting thresholds within your data.
Create insightful dashboards for your team
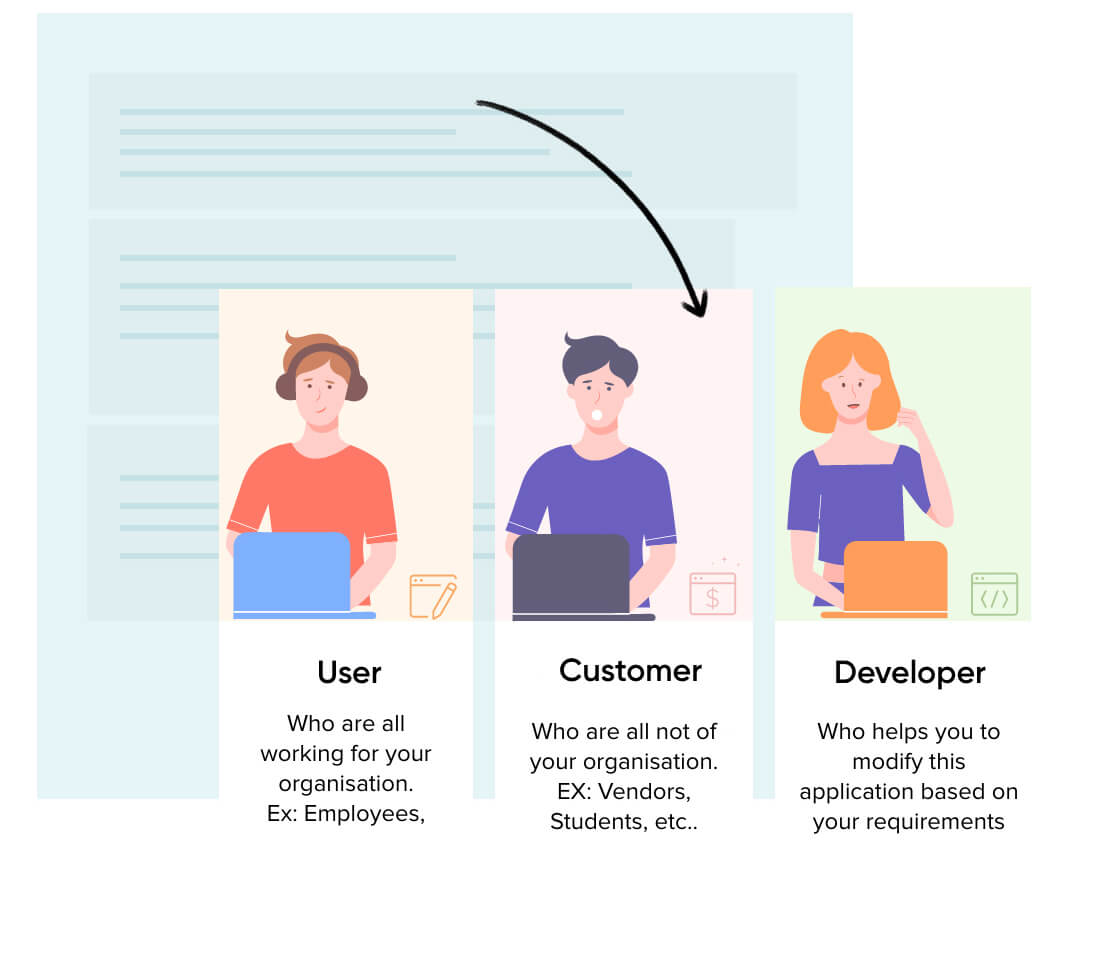
Invite key players to access only the data they need through role-based views.
Enable users to create reports from your data while you retain complete control.
Instantly collaborate with peers on reports using comments.


