Trusted by Great Brands
- Icon
- Icon
- Icon
- Icon
- Icon
- Icon
- Icon
- Icon
- Icon
- Icon
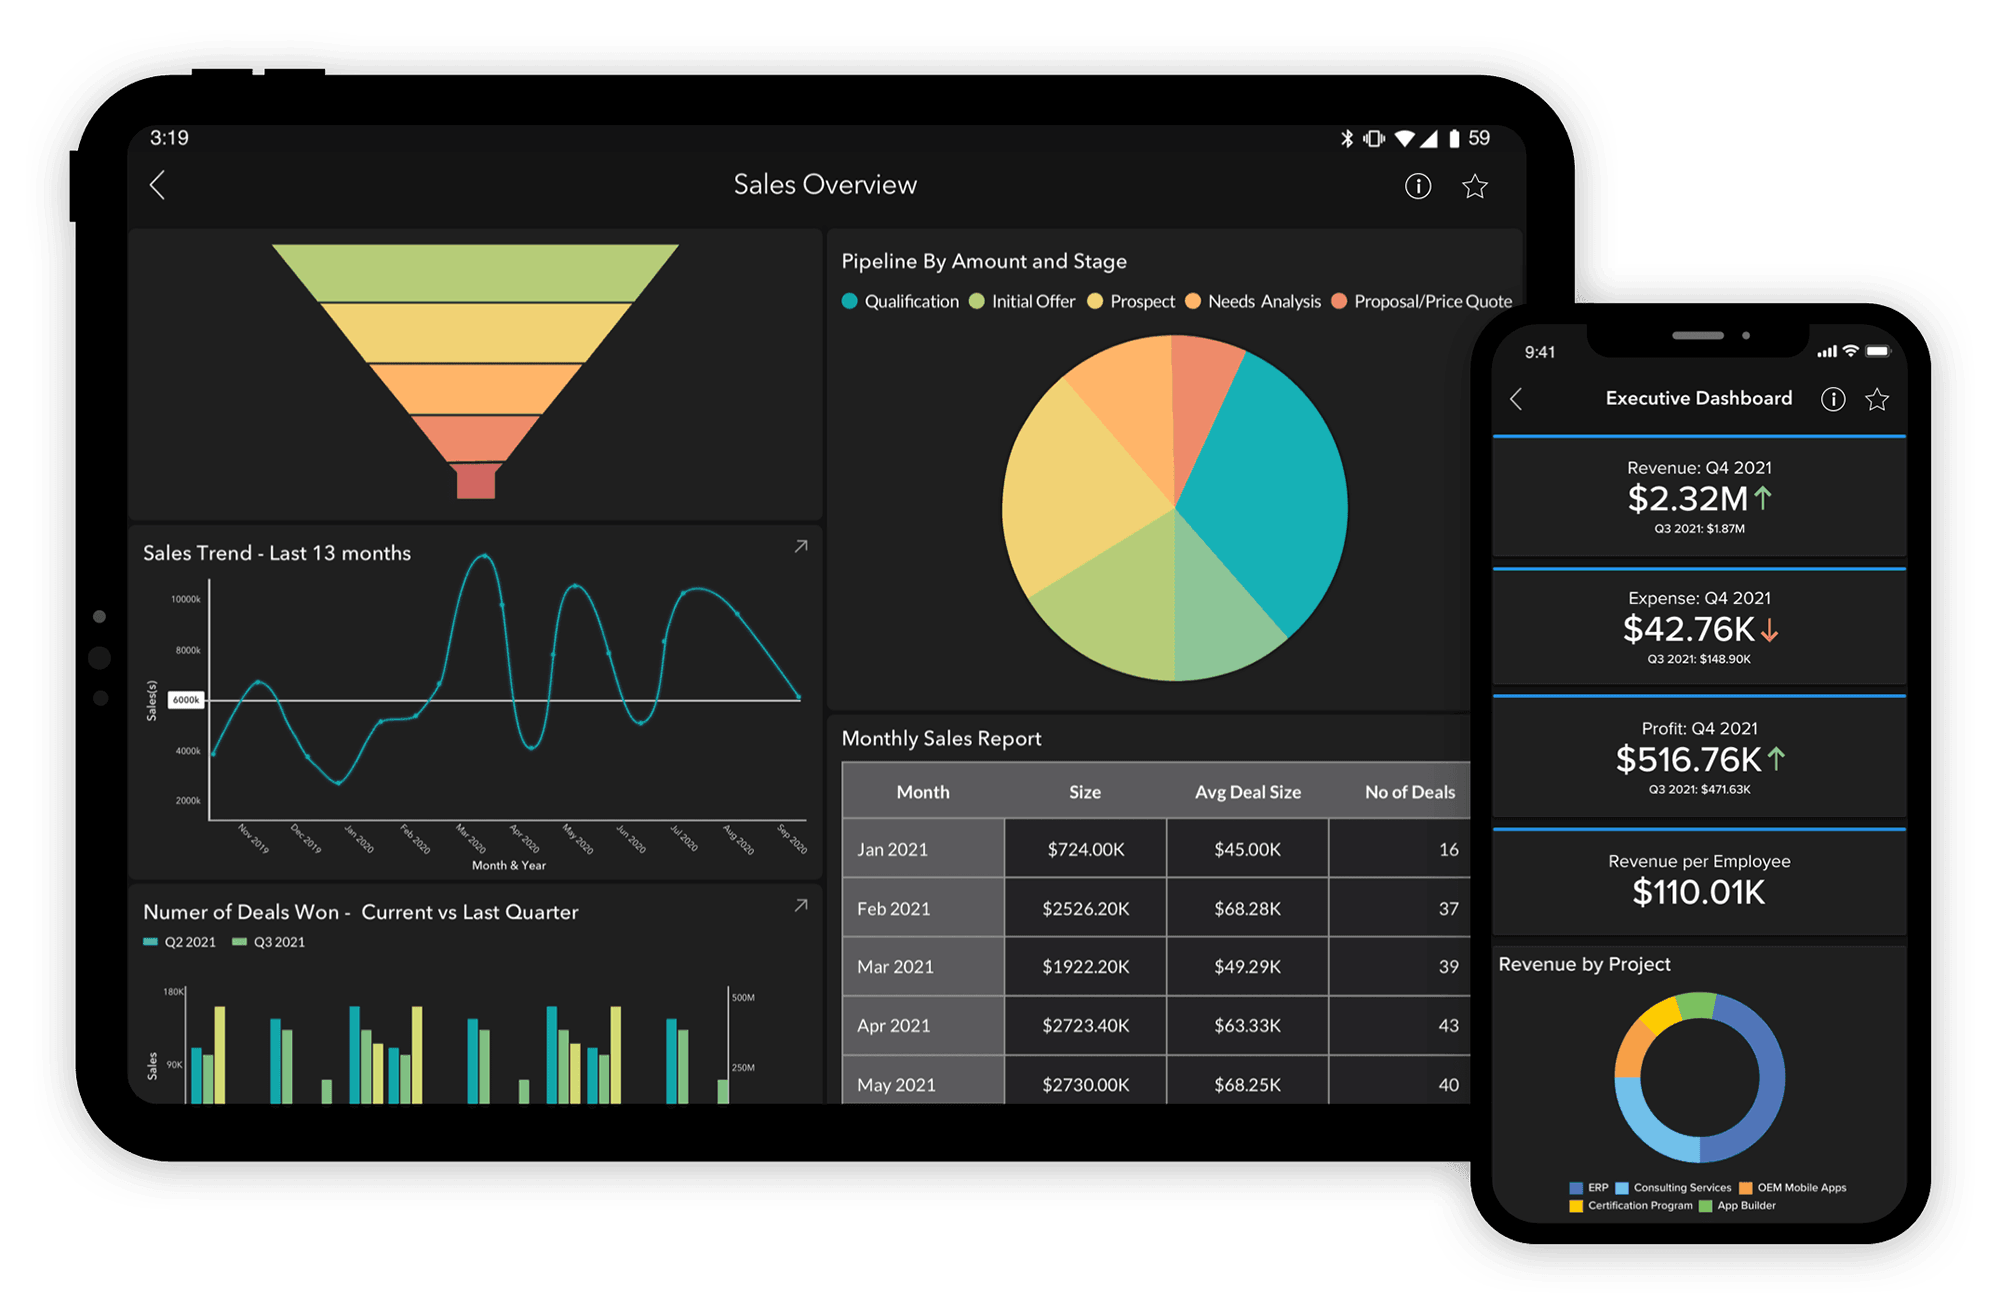
Immersive visualizations
Visualize your data by using a wide variety of charts, pivot tables, KPI widgets and summary/tabular views and dashboards. .
Visual Interactions
Interact with reports and dashboards through an intuitive touch experience to handle actions like drill down, filters, and selection.
Conversational analytics
Converse with Zia using an immersive chat-like interface. Ask questions through voice and get insights in the form of reports and widgets.
Self-Organized Visualizations
Your reports and dashboards are auto-segregated based on type, folders and related views. Favourite the visualizations you like or use the most.
Collaboration over mobile
Share reports and dashboards with fine-grained permissions. Add comments to hold meaningful conversations with peers.


