


Databricks Advanced Analytics
Databricks Advanced Analytics provides a robust solution for comprehensive data analysis. With this integration, you can seamlessly import data from Databricks into Zoho Analytics, to enhance analytical capabilities, streamline data workflows, and facilitate informed decision-making through valuable insights.
This integration comes with a set of pre-built reports that provide important details like the average response time taken for responses, the number of responses received for each survey, and much more.
- Setting up the Integration
- Handling Data Synchronization Failure
- Managing Data Sources
- Data Modeling & Preparation
- Data Visualization/Analysis
- Sharing & Collaboration
- Help & Support
Setting up the Integration
A user with administrator privileges (Account admin, Org admin and Workspace admin) can configure the integration.
Note:
- The initial fetch might take a few minutes depending on the volume of the data to be imported. An email and an in-app notification will be sent, once the initial fetch is complete.
- The setup process can sometimes fail for a variety of reasons. In this case we request you to access the Data source tab and click the Retry link to import again. If the issue persists then write to support@zohoanalytics.com
Data Sync Frequency
Zoho Analytics offers flexible sync schedules to ensure that your data is always up-to-date for effective analysis. These schedules allow you to automate the process of updating your data, ensuring that your analyses are based on the latest information.
- 1 Hour (Enterprise plan only)
- 3 Hours
- 6 Hours
- 12 Hours
- Every day
Handling Data Synchronization Failure
Data synchronization can fail,
- If the data type of a field is changed in the Databricks Application.
- If the Modules and Field selected for analysis are deleted in the source application.
- If the user who configured the integration no longer has permission to access the modules.
In any of the above mentioned cases, the data sync will be paused. You will be notified via email and in- app notification with the exact reason for failure along with the solution.
To resolve the sync failure, delete or restructure the views, or restore the specific modules and fields from the source application. Refer to Data Sync failure and solutions article for more details.
Once you have made the changes, click the Sync now option in the data source tab to resume data sync. If the issue persists, contact support@zohoanalytics.com
Managing Data Sources
The Data Sources tab provides essential information to monitor and manage the integration setup. It also allows you to edit the settings as needed. Users with administrator privileges will be able to view and modify the connection settings.

Data Source Permalink
The Data Source Permalink helps you easily access the data source tab, and this link can be pasted in dashboards so that everyone accessing the dashboard can know about the sync status.

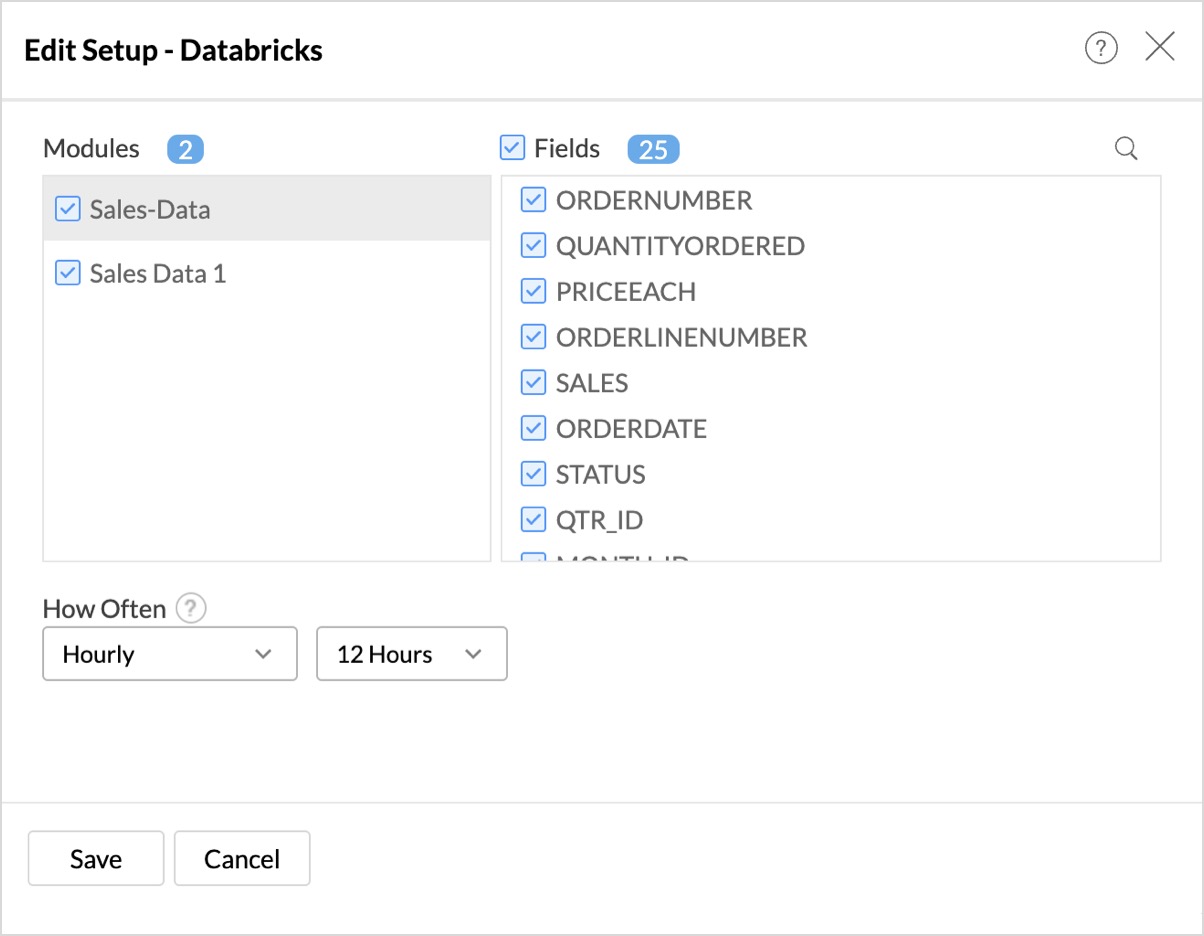
Edit Setup
The Edit Setup tab allows you to add or delete modules or fields, change the schedule interval, and modify other settings specific to the business application.
To modify the settings,
- Click Data Sources > Edit Setup.
- The Edit Setup - Databricks dialog will open. Modify the settings as needed and click Save.

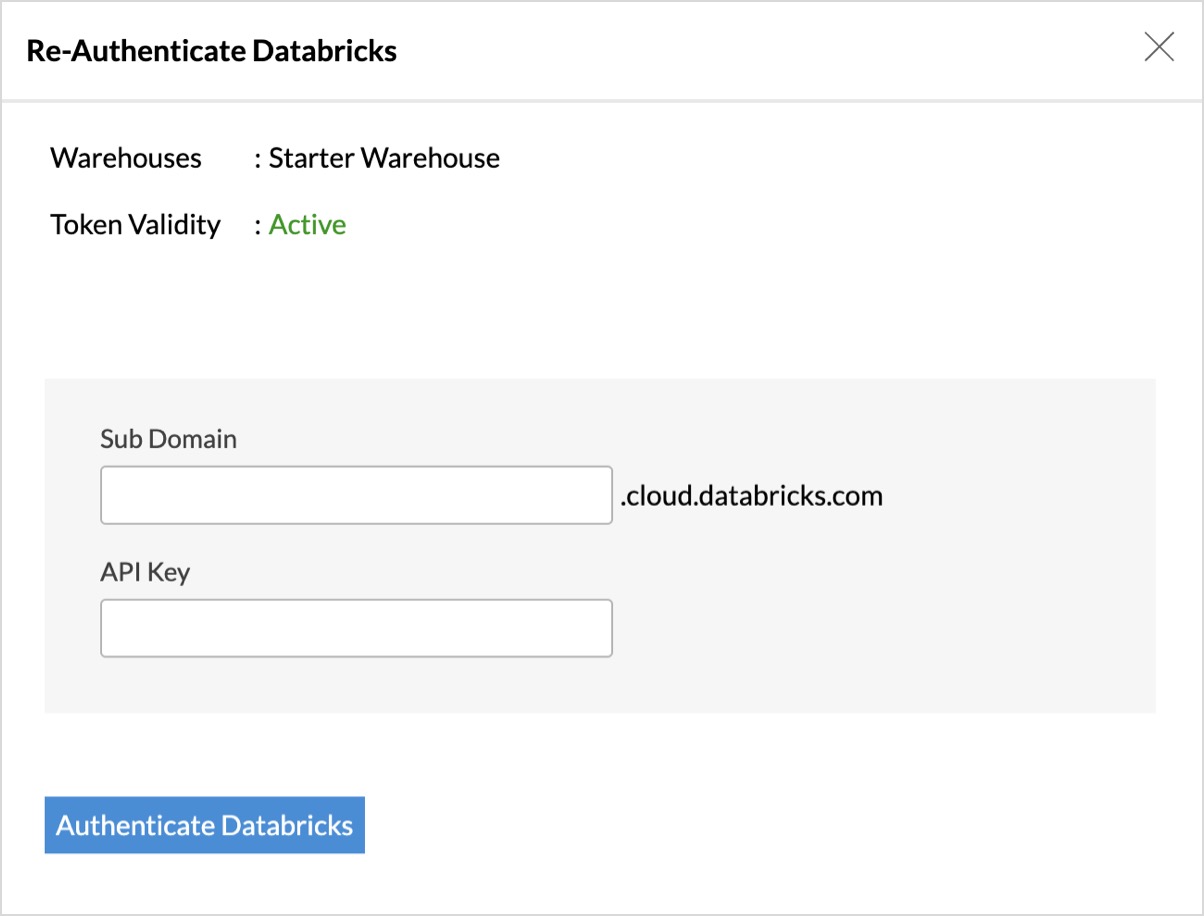
Re- Authenticate
Re-authentication will be helpful when the API key or password is changed. In this case, the data sync will be paused, and the administrator who configure the connector setup must re-authenticate to resume the data sync.
To re-authenticate,
- Click Data Sources > Re-Authenticate.
- The Re-authenticate - Databricks dialog will open. Click Authenticate Databricks.

Sync History
The Sync History tab provides details about the data sync for the last 45 days. A successful data sync is marked in green, and a sync failure is marked in red.
To view the Sync history,
- Click Data sources > Sync History.
- A calendar with the Sync History of the last 45 days will open. The date when the data sync has happened will be highlighted. Hover to view the number of times the data had got synced on a specific date.
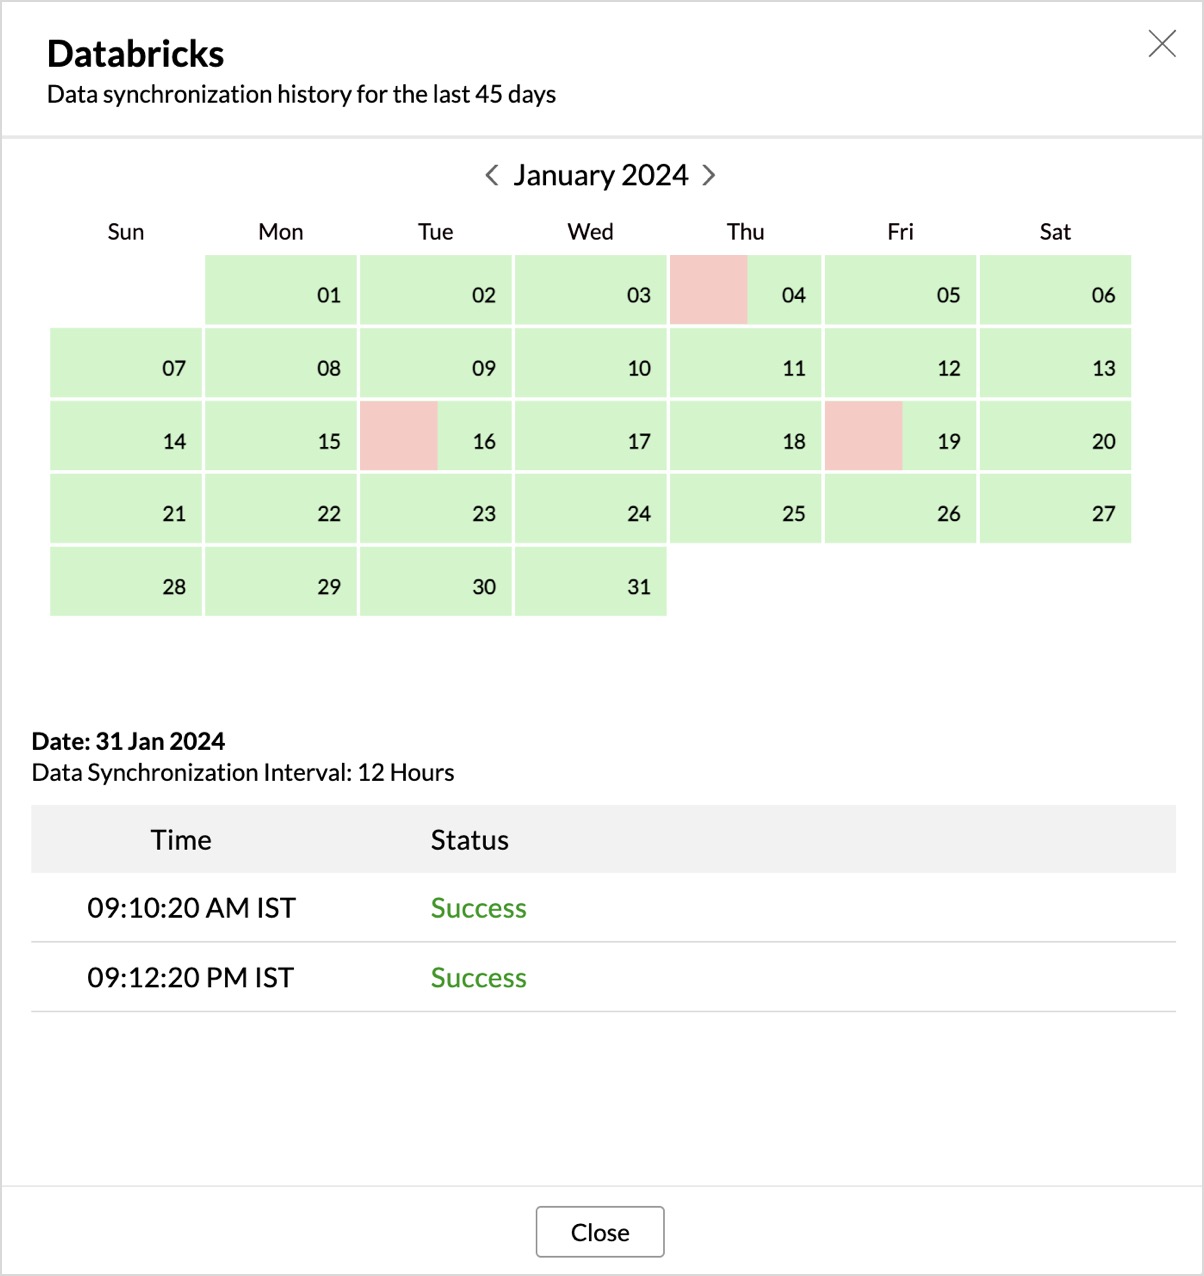
- Click the date to view more details.
- Time - Displays the time when the data is synced.
- Status - Shows whether the sync was a success or a failure.In case of failure, the reason will be displayed. Refer to this page to learn how to resolve the issue and avoid further failure.

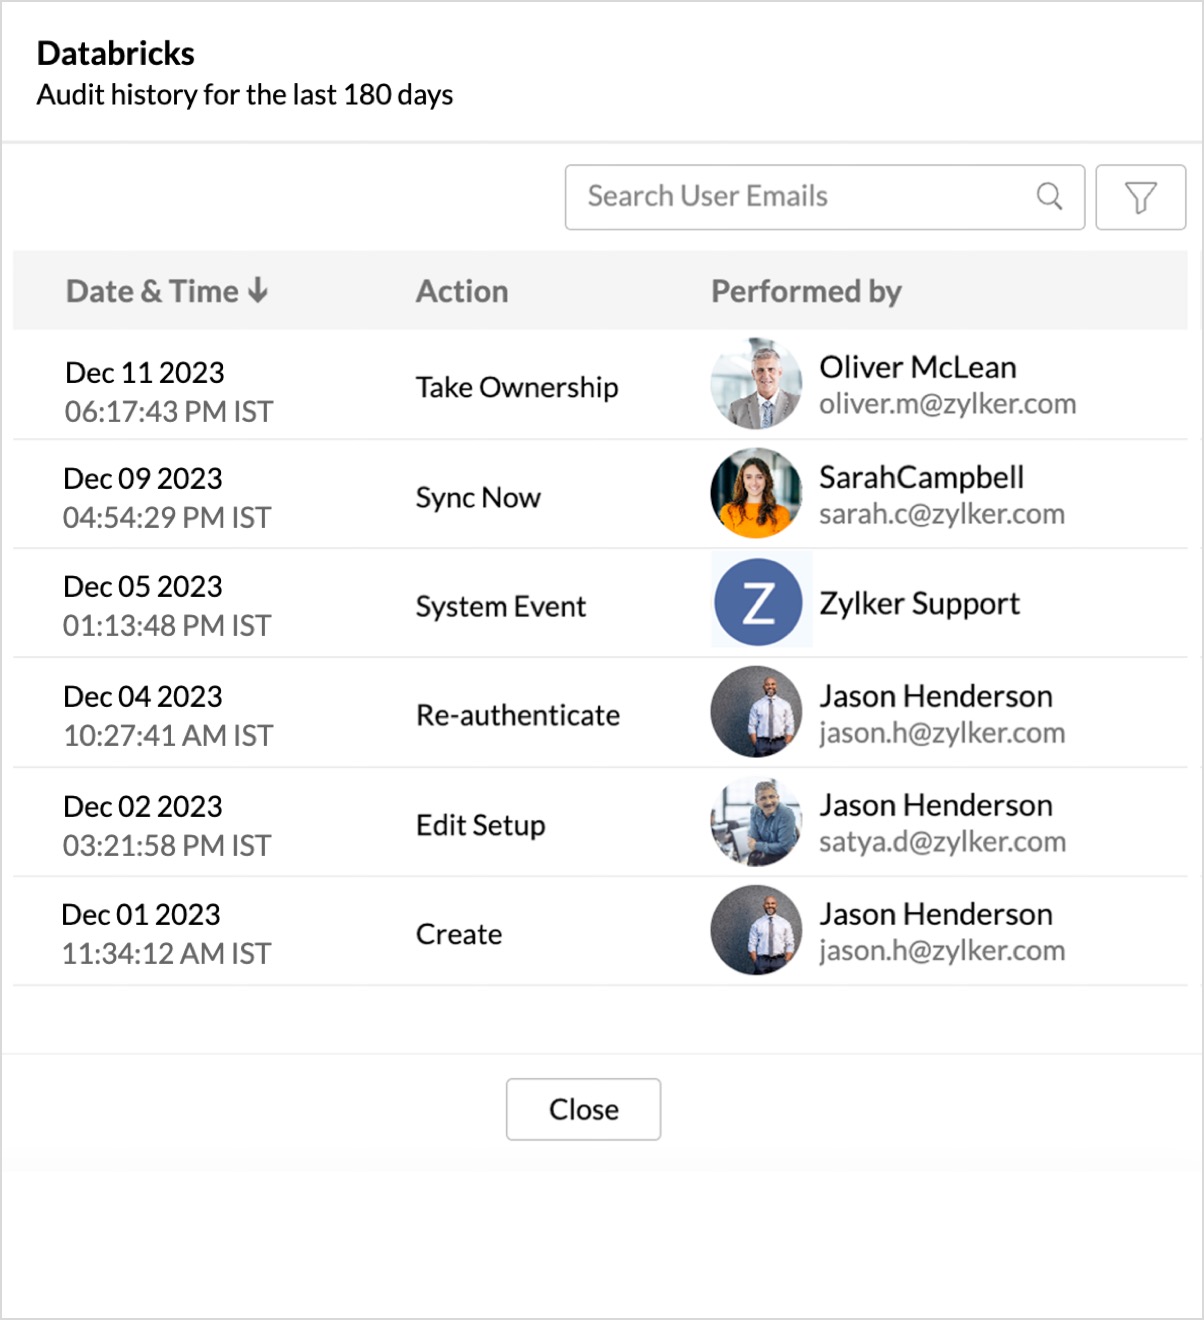
Audit History
Zoho Analytics logs all the user activities and system events within the Databricks workspace. The following actions that are logged in Zoho Analytics,
- User Action: Create, Modules Added, Modules Removed, Fields Added, Fields Removed, Schedule Change and Entities Modified, Delete, Take Ownership, Re-authenticate, Sync Now, Retry.
- System Action: Plan upgrade or downgrade.
To view the audit history,
- Click Data Sources > Audit History.
- A dialog with the activities for the last 180 days will open.

Remove Data Source
Zoho Analytics allows you to remove the integration if needed. Removing the integration will suspend further data synchronization. The data tables and the reports will be available.
Click the Settings icon in the Data Sources tab, and select Remove Data Source from the drop-down menu.

Data Modeling & Preparation
Zoho Analytics allows you to combine data from various sources such as Files, Feeds, Databases and Business Applications for an in-depth analysis. Query Tables allows you to combine data from different tables to create reports.
While blending data from other data sources, Zoho Analytics automatically identifies similar columns and provides suggestions for lookups. Refer to the Joining Tables article for more details.
Data Visualization / Analysis
Zoho Analytics offers a wide range of visualization types to conduct your analysis. Refer to the Creating Reports section to learn more.The below table lists the range of visualizations supported in Zoho Analytics.
| Visualization | Types |
Bar | Stacked bar, Histogram, Horizontal bar |
Stacked Bar | Horizontal Stacked bar, 100% vertical and horizontal stacked bar |
Area | Area with markers, Smooth Area, Smooth area with Markers |
Line and Bar Combination chart | Bar with Line, Bar with Bubble, Bar with Scatter, Bar with Area, Area with Bubble, Line with Bubble and Custom Combination |
Bubble Chart | Bubble Pie, Packed Bubble, Word Cloud |
Stacked Area | Stacked area with markers, Smooth stacked area, Smooth stacked area with markers |
Map | Heat Map, Map Scatter, Map Bubble, Map Pie, Map Bubble Pie, Map Filled, Geo Heat Map |
Tree map | Not Applicable |
Pie | Pie, Ring, Semi Pie, Semi Ring |
Doughnut | Not Applicable |
Matrix View | Pivot table |
Tabular | Summary and Tabular view |
Dashboards and KPI widgets | Single Numeric Widget, Dial Chart Widget Bullet, Chart Widget |
Sharing and Collaboration
- Share data and reports with your colleagues & friends with fine-grained permission
- Enable real-time commenting on a shared view to efficiently collaborate with your users
- Publish reports for wider consumption. Embed reports/dashboards within your websites, web applications, and blogs.
- Export, Email, and Print reports in a variety of formats.
- Use Zoho Analytics mobile apps (optimized for both IOS and Android platform) and access the reports and dashboards on the go.
Help & Support
We offer 24x5 technical support (Monday to Friday). In case if you need our assistance kindly do mail us your questions to support@zohoanalytics.com.
You can also reach out to us on our toll-free numbers.
United States: +1 (888) 900 9646
United Kingdom: +44 (20) 35647890
Australia: +61-2-80662898
India: +91 44 6965 6060