What will I learn?
- What is data storytelling?
- The value of data storytelling: Data communication with context
- How to tell a story with data effectively?
- What are the key elements of data storytelling?
- Data storytelling examples
- Best practices for an effective data storytelling
- Data visualization to enhance data storytelling
Data storytelling
What is data storytelling?
Data storytelling is the process of communicating data insights effectively to a set of audience, through a story or narrative, which will inspire them to make better decisions.
In the business intelligence domain, the term "data storytelling" is becoming popular nowadays as it helps communicate complex data to any type of audience. It enables everyone to pitch in decision-making as they have a better understanding of data.
The value of data storytelling: Data communication with context
Data storytelling is key for effective communication, and it helps improve engagement and decision-making. While we are going to see how to tell a story with data and a few examples, we'll first get to know the values of data-driven storytelling.
- Increases data literacy across the organization:Gone are the times when data was accessed and understood by data analysts only. With data storytelling, everyone can understand what's happening, discover data-driven insights, and uncover trends and patterns.
- Boosts audience engagement and communication:Storytelling is key to building data-driven communication and boosting engagement with the audience. When everyone across the organization understands the data, it will inspire them to speak out their voice and take action.
- Helps identify why and how something happened:While data analytics can help you assess what has happened easily and quickly, data storytelling will help you get answers to questions such as why and how.
- Above all, it communicates insights effectively to all types of audiences:democratizes data across the organization. When enabling both technical and non-technical users to work with and understand data, you can save more time, extract more insights, and, importantly, make better decisions.
How to tell a story with data effectively?
Storytelling with data can influence your audience to take action by providing context to the data. To craft a better story with your data, you can follow the steps below.
Identify your goal
When you initiate the data storytelling process to communicate insights, you will need to identify what you are trying to accomplish with your data story. A data story is not just a visual representation of data; however, it should engage your stakeholders and explain the insights so that they can understand the context better.Understand your audience
Identifying and understanding your audience is the basic step of storytelling, and data storytelling isn't an exception. You can craft a good data story only when you completely understand your audience, i.e., identifying their level of technical knowledge - whether they are a novice or an expert - their background, and the story elements that they are interested in.Analyze data and extract insights
Before jumping right into crafting a narrative, you will need to analyze the data yourself and find the key insights that you want to communicate to your audience. This process involves right from understanding your data to data preparation.Come up with a compelling narrative
Creating a compelling narrative is the core of data storytelling. A narrative is not just presenting data to the audience. It should engage them and take them on a journey.Choose appropriate visualizations
To keep your audience engaged, data visualization is your go-to solution. It helps in understanding the data better and identifying data trends and outliers.Use text wherever necessary
To provide context to your visualizations, you can add text at appropriate places. You cannot convey everything with a visualization. You can give a title and subtitle to your reports and charts to let your audience know the purpose of a particular report. Plus, you can annotate charts and reports to explain key points.Structure your story
The structure for your data story needs to be linear. You will need to arrange your visualizations in a particular order that tells a story. You can craft the data story based on different layers and then unveil it gradually as the story proceeds. This way, your audience will linearly consume the information.Polish your data story and present it
Like writing a regular story, you should also polish your data story until it becomes clear. Remove everything that adds no value and present data that really matters to your stakeholders. When it's done, you are ready with your data story.
You can then analyze the data and extract insights that will make sense to your audience and will help them in data-driven decision-making. For data analysis, you can choose BI solutions like Zoho Analytics.
Like we used to hear stories, data storytelling too can be linear. Start with what's happening and explain why it's happening. Then, unfold your insights gathered that will help them understand the data better.
To accomplish this, you will need to use appropriate visualizations for your data stories. The visualizations can include bar graphs, pie charts, infographics, line and scatter charts, and many more. If you are in confusion about choosing the right visualization type, you can refer to our chart picker guide and get accustomed to visualizations. A robust data visualization software offers extensive options to present data in a variety of formats.
What are the key elements of data storytelling?
Effective data storytelling comprises three key elements. With these key elements, you can craft a compelling data story that will result in action from your audience. Here are those key elements:
- Data:It's the base pillar of a data story. You understand the data, clean and enrich it with data preparation, and analyze it to derive meaningful insights.
- Narrative:You use a narrative to communicate the insights gathered effectively to your audience. The narrative should be written based on the data, and it should educate your audience on the data and its importance
- Visualization:Visualizations can further enhance your data story and keep your audience engaged. Make sure your visualizations are not overpowering and use them to take your audience on a journey.
Data storytelling examples
Each data story is unique in terms of data, narrative, and visualization. However, to get started with your data storytelling journey, we have put together a few data storytelling examples that will inspire you to create yours.
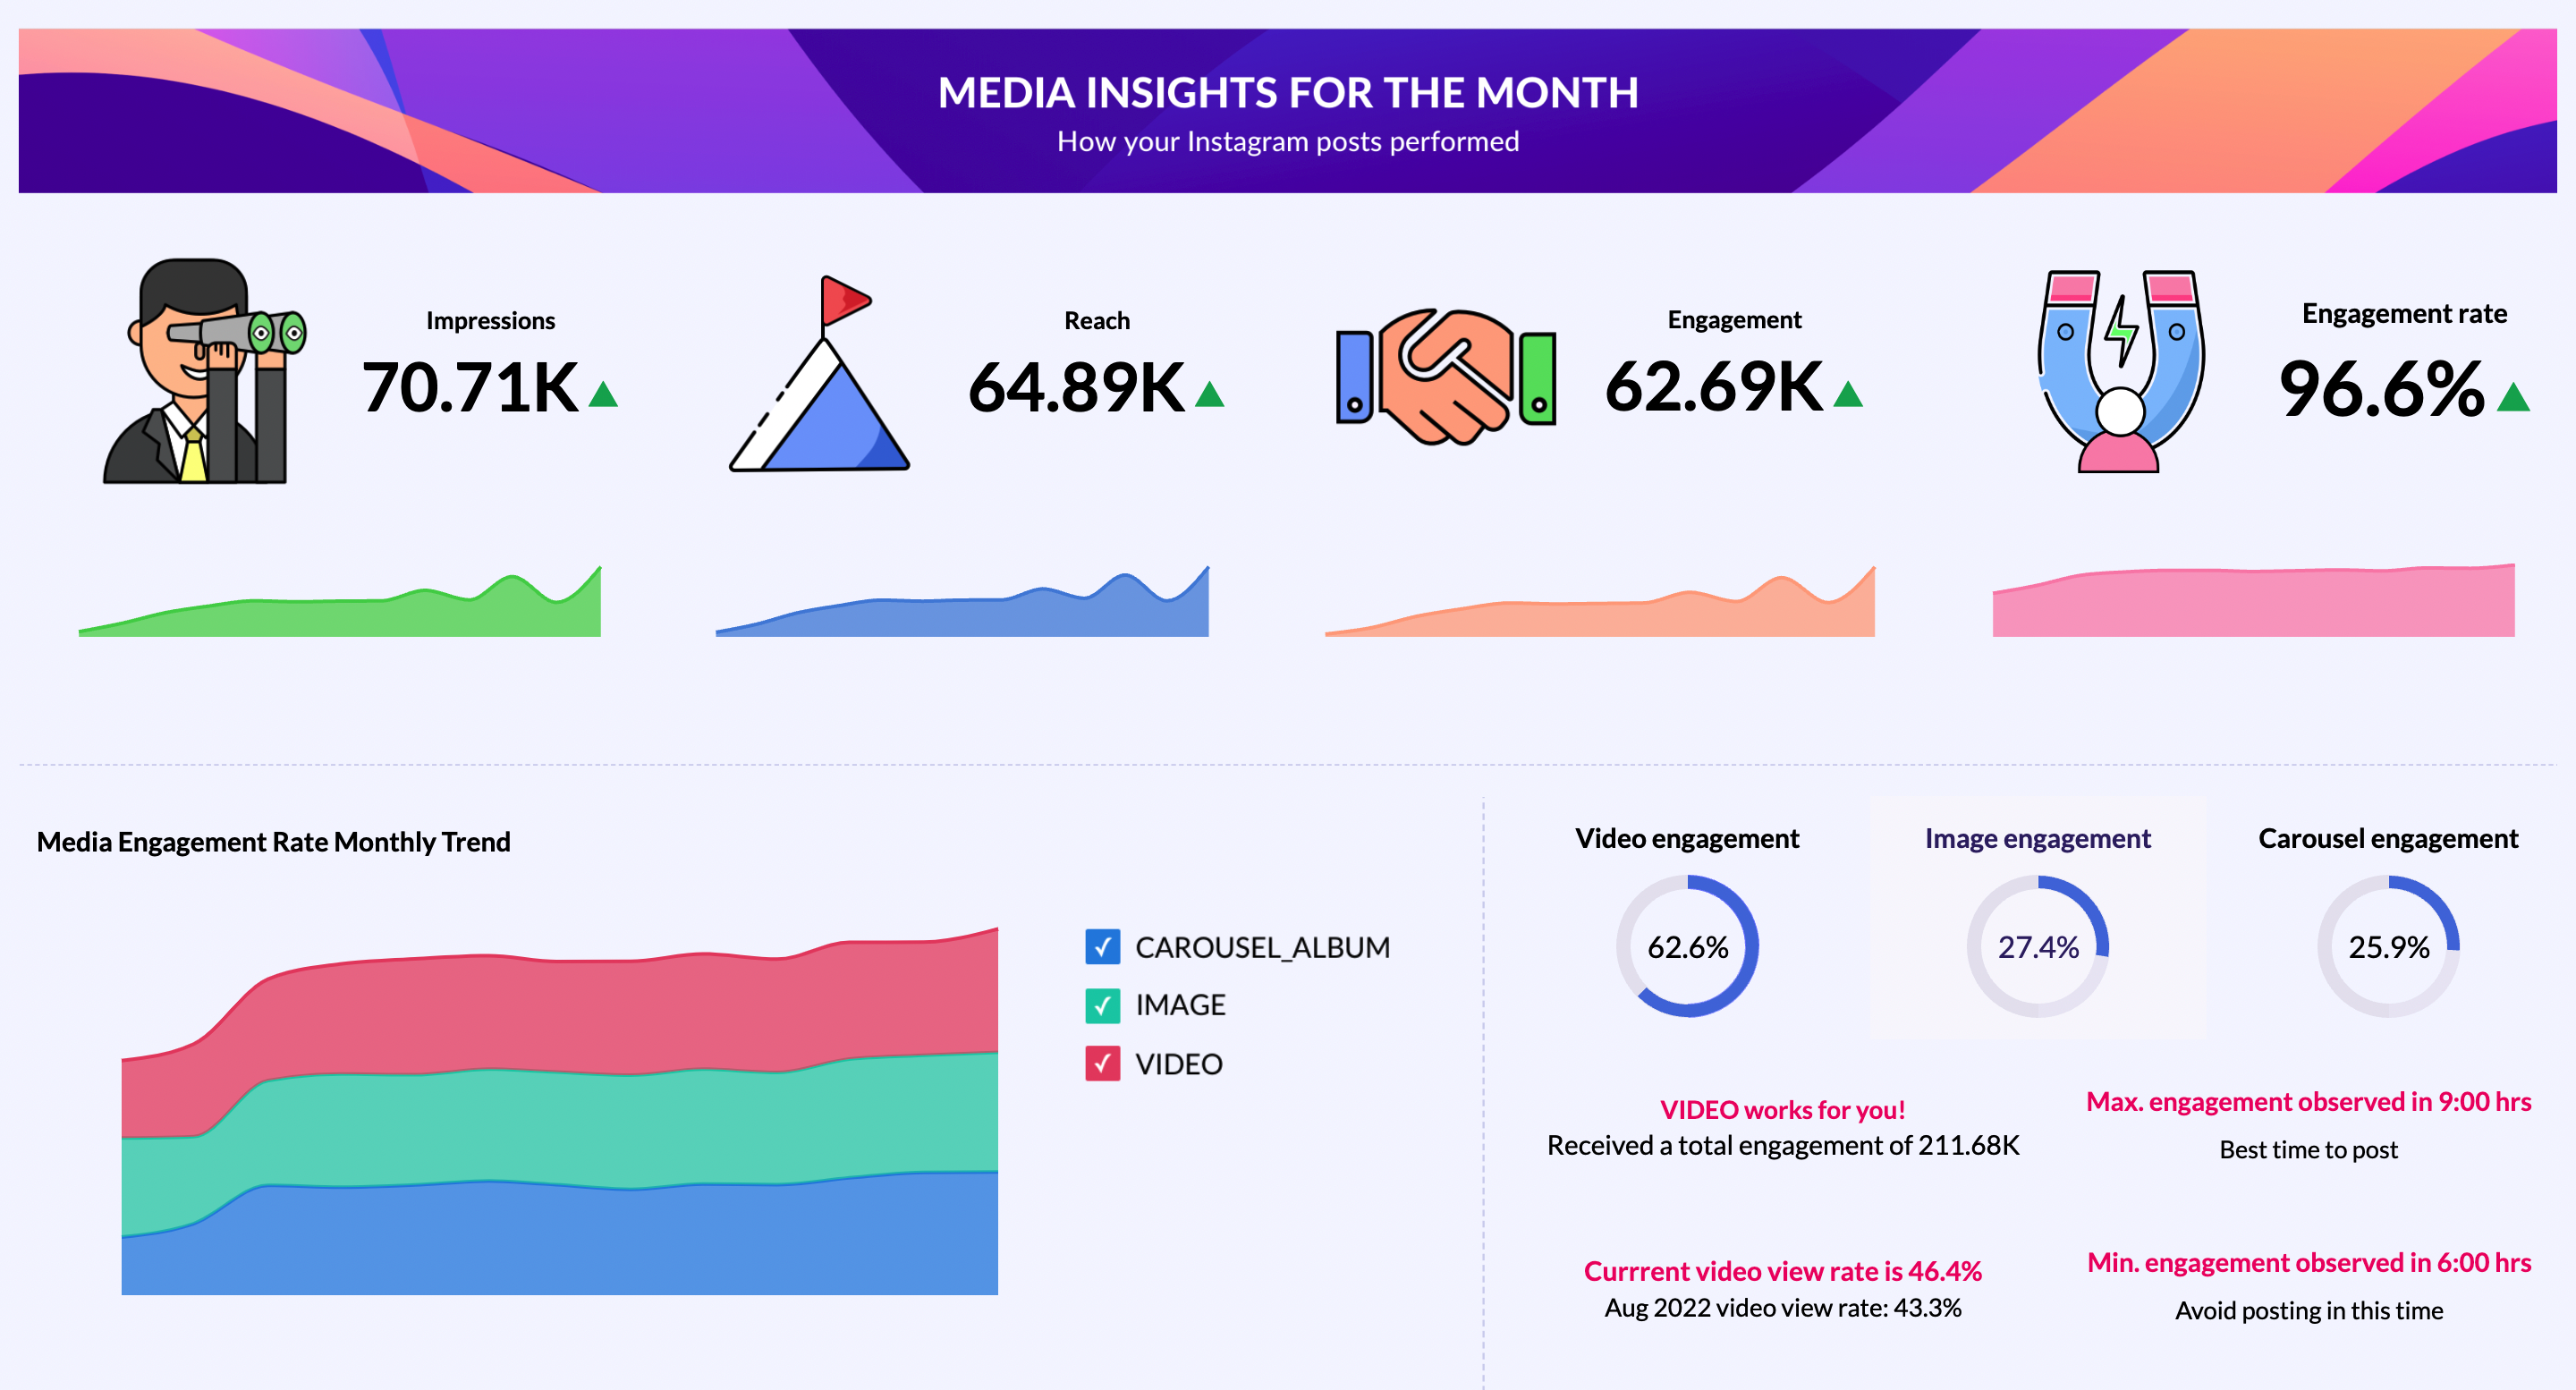
- Instagram storytelling dashboard
The following is a storytelling dashboard that can be used by social media managers and agencies to present their Instagram findings as a narrative. You can present this data story to your managers and clients and let them understand how the Instagram profile is performing.
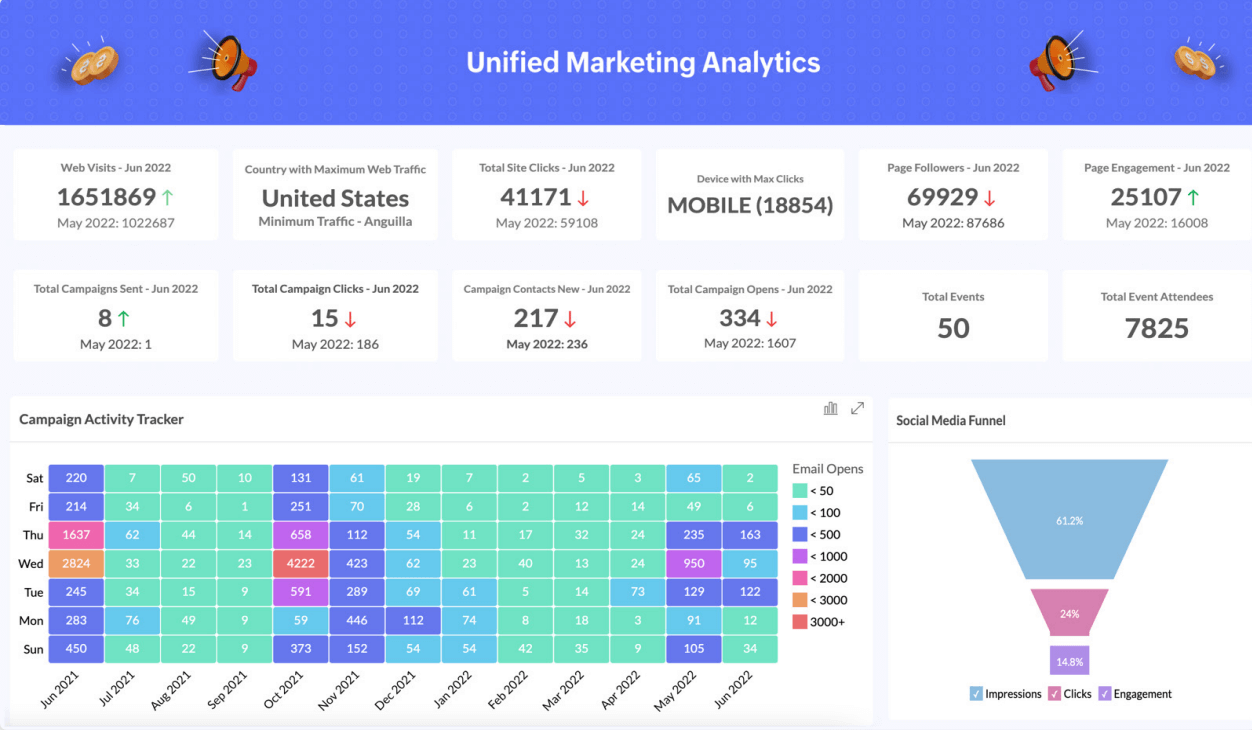
- Marketing storytelling dashboard
Today's businesses generate a lot of data, which can be used for marketing purposes. However, not everyone in the organization can understand and derive insights from the technical data. That's when a marketing data story can help.
Here's a marketing data visualization dashboard that will help every type of audience understand the trends and insights.
- Automated insights
You cannot present your findings and insights to your stakeholders every time they access the data. At this time, automated insights can help them derive insights with ease.
For instance, you have prepared the data, converted it into a meaningful visualization, and shared it with your stakeholders. With automated insights, they don't have to be dependent on you to derive insights from the reports. Insights can be derived from visualizations at the click of a button.
Business intelligence software like Zoho Analytics helps users to derive key insights from reports and charts using artificial intelligence. Zoho Analytics, with its Zia Insights feature, lets users get meaningful insights in a single click. Below is an example for your reference:
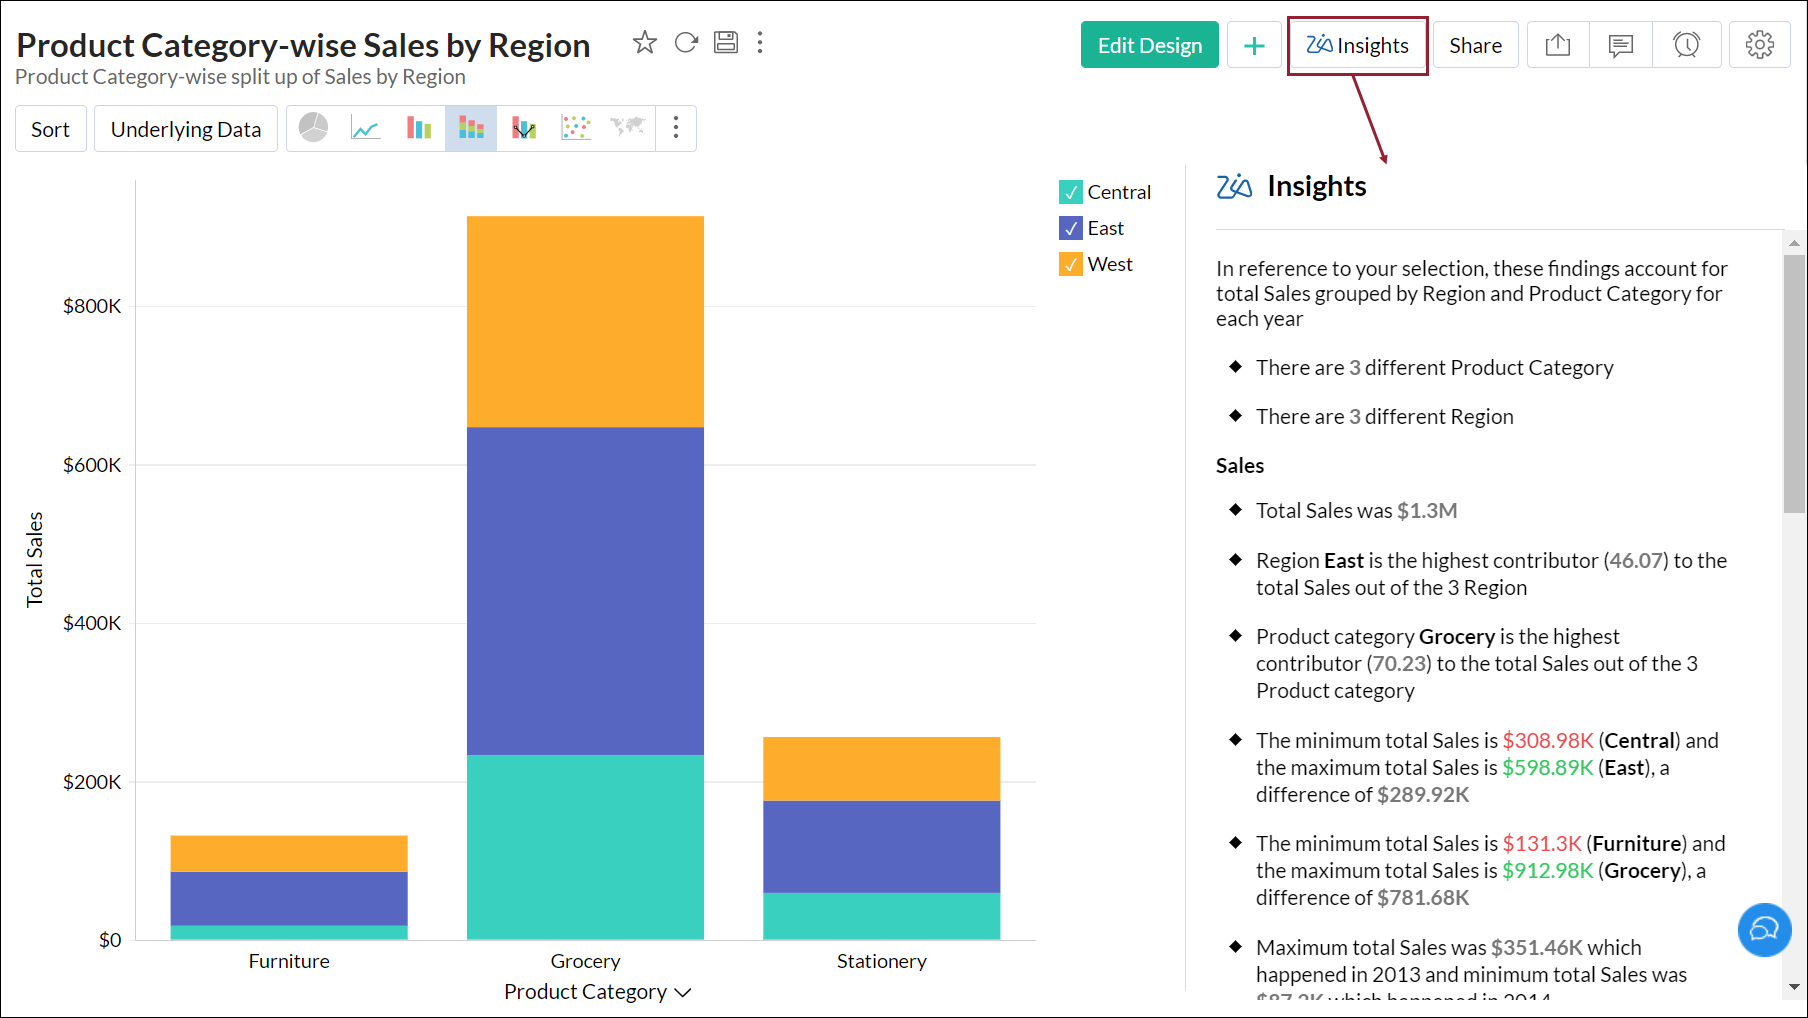
You can get automated insights in the form of a narrative for the visualizations you choose in one click with Zia Insights.
Likewise, non-technical users can also derive insights from raw data with the help of conversational analytics. Zoho Analytics offers a powerful feature called Ask Zia where users can ask questions related to data in natural language, and it will retrieve answers in the form of KPIs and reports.
Below is an example of how easy it is to get answers from raw data using Ask Zia:
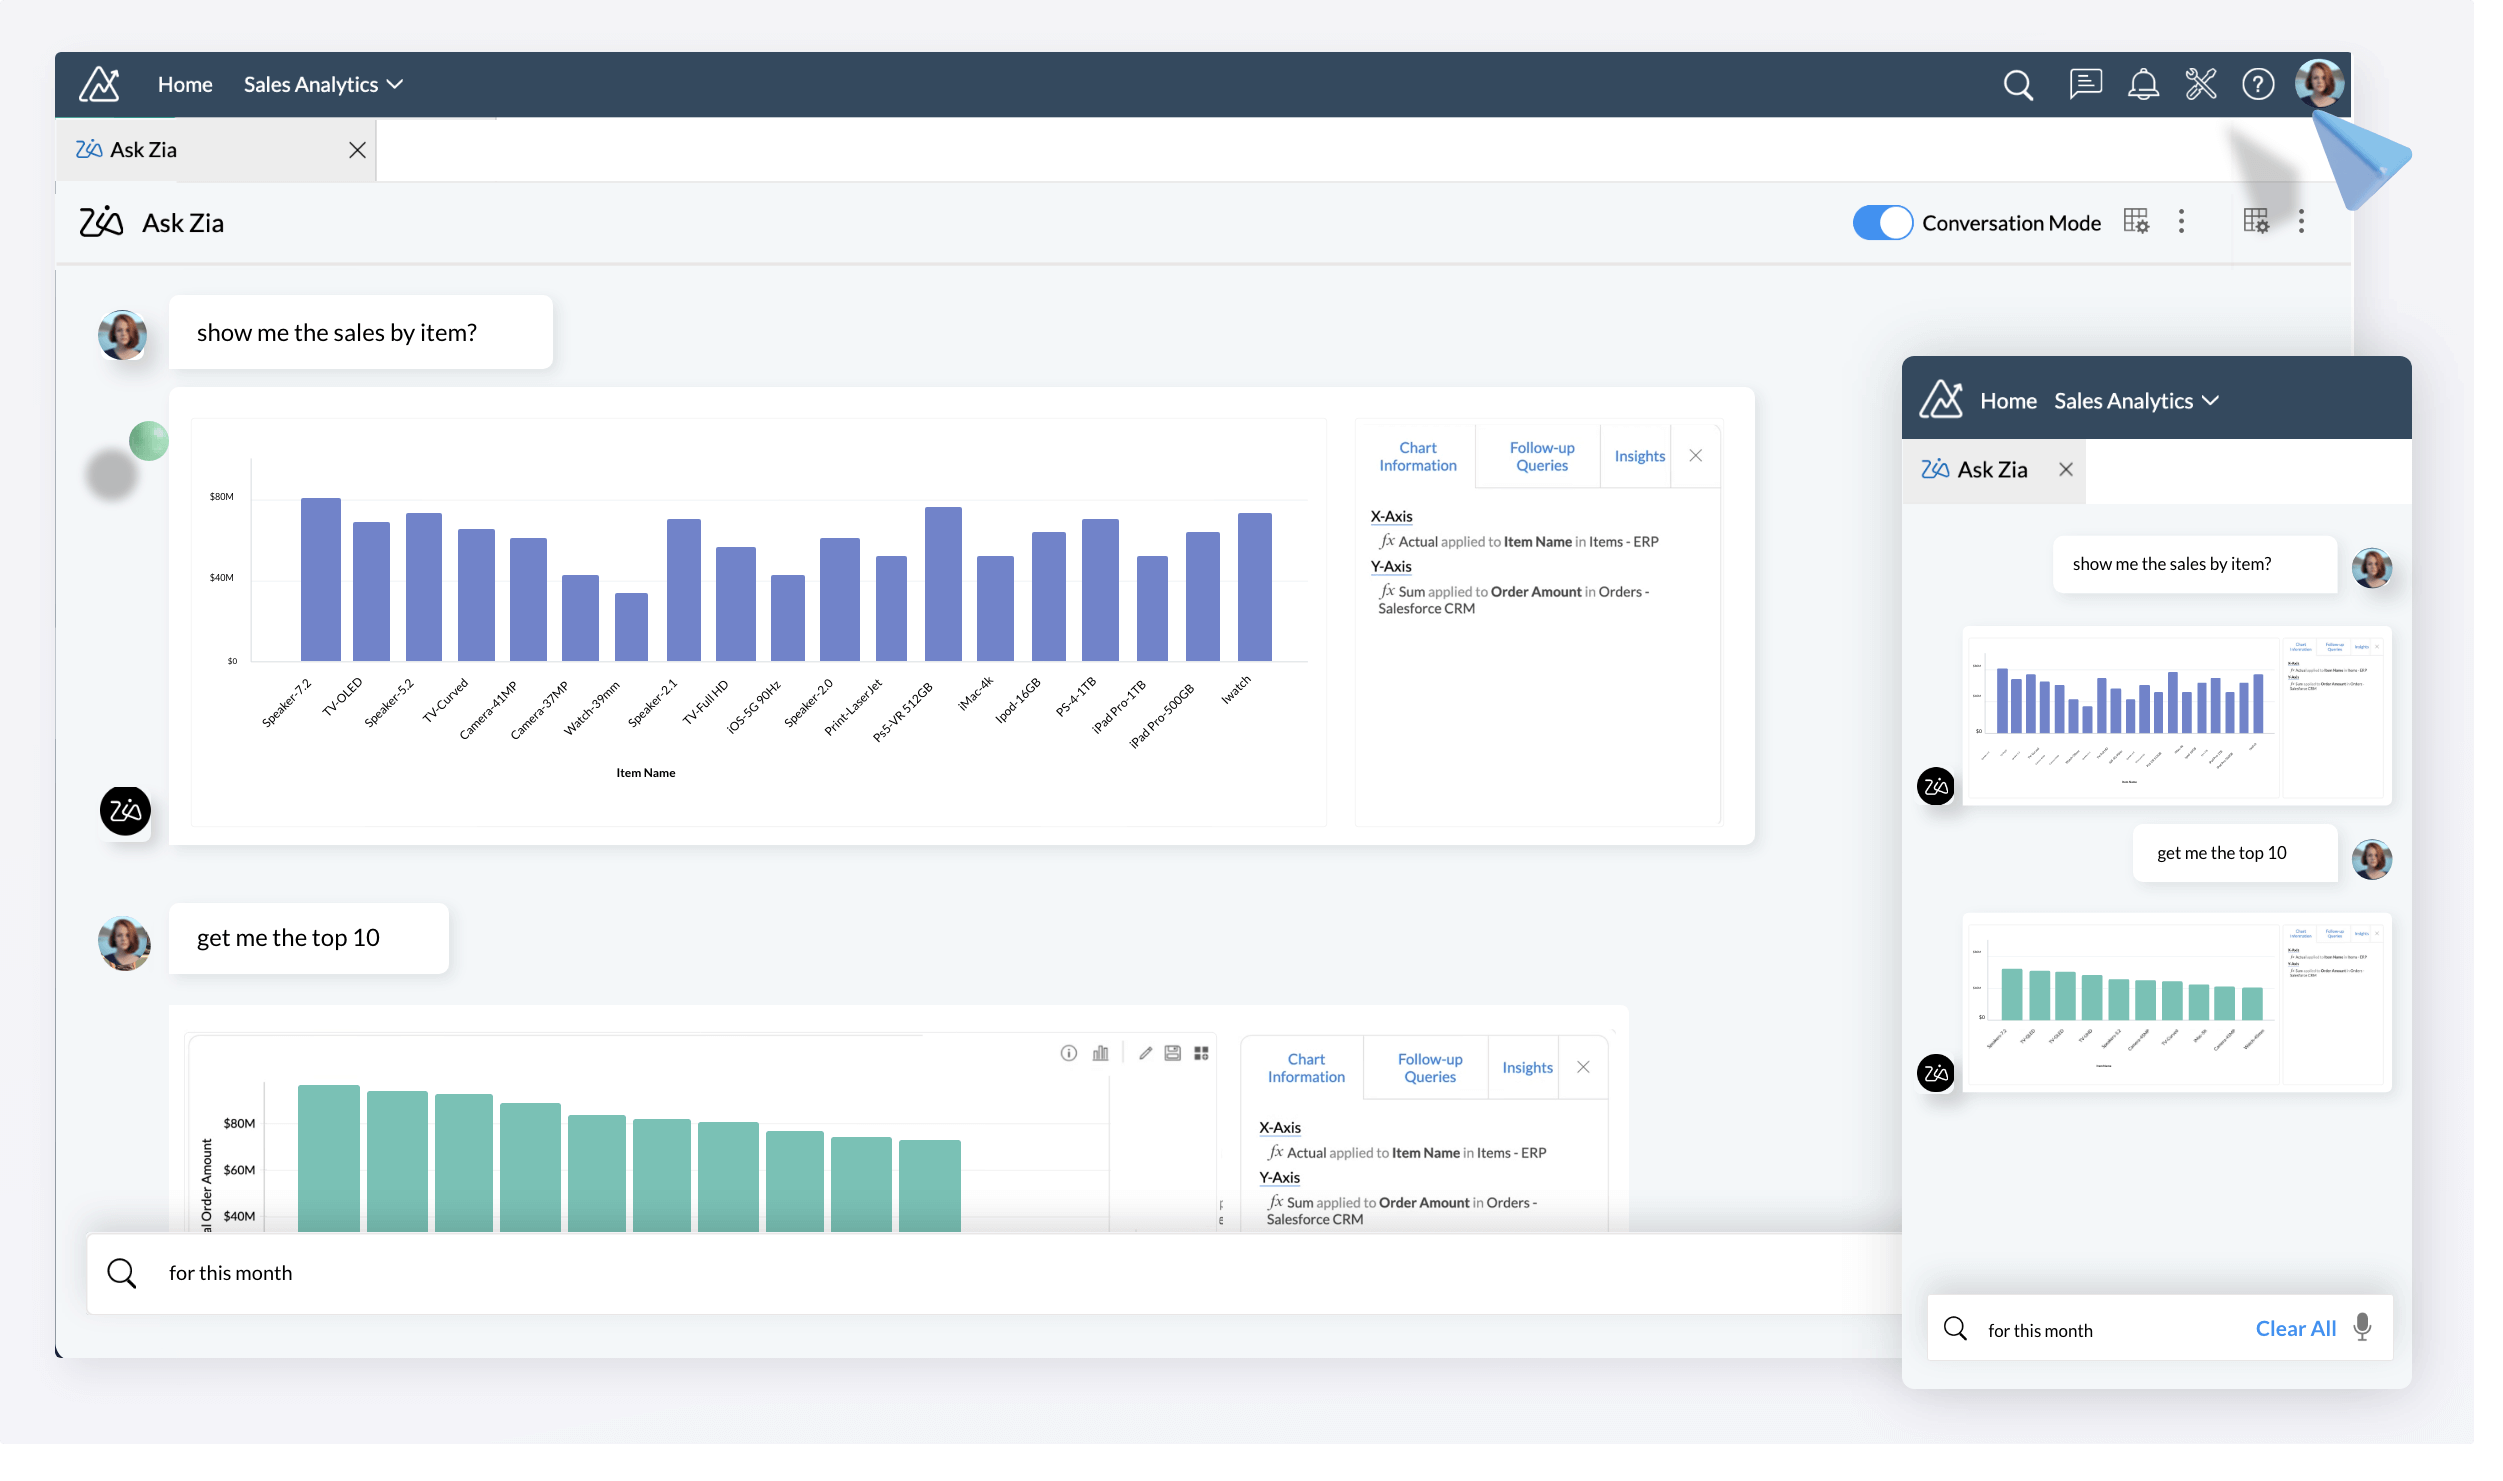
You can simply type out (or even speak out) your questions and get relevant answers as reports.
- Keep visualizations simple:You can use a flat theme with the required white space to avoid clutter. Ensure your data story does not look crowded and allows your audience to understand the data with no hassles.
- Use colors and fonts effectively:Finding the perfect balance between color and font usage plays a vital role in designing a data story. Use appropriate colors that are not overpowering and normal fonts. To sum up, give more importance to data and use colors and text as supporting factors.
- Understand data and present with context:When you have a good understanding of your data, you can analyze and derive insights better. Context is key to data storytelling. So, you should present with context as your audience is reliant on your data story to understand and make decisions.
- Include a call to action:The main goal of data storytelling is enabling the audience to take action based on your insights. So, adding a call to action to your storytelling dashboard will inspire your stakeholders to provide value based on their understanding.
- You have raw marketing data from multiple sources and you want to communicate insights from this data to your stakeholders to create marketing strategies. You prepare the data and make it analysis-ready.
- Create visualizations using the prepared data, identify trends and data outliers, and extract insights.
- Craft a narrative and arrange visualizations to create a data story. Add text, KPI widgets, and images to complement your data story.
- The audience will likely spend less time understanding the data.
- So, focus on what's important.
- And, communicate the insights clearly.


Best practices for an effective data storytelling
Getting started with a data storytelling strategy can look complex when you are completely new. To simplify your learning process, we have put together a few data storytelling techniques to follow.
Data visualization to enhance data storytelling
Combining and balancing data, narrative, and visualization is the best way to build an effective data story.
There are best data visualization tools available to help you do everything to craft a compelling data story. Modern self-service BI solutions like Zoho Analytics help you along the journey right from preparing your data to understanding and analyzing data to visualizing data up until creating a data story.
For example, here's the journey of creating data stories with Zoho Analytics.
Raw data | Data visualization | Data storytelling |
|---|---|---|
 |  |  |
Points to note:
Ready to start your data storytelling journey and communicate insights effectively?
Sign up with Zoho Analytics for free, start creating compelling data stories, and inspire your stakeholders to take action.
SIGN UP FOR FREE