About the application
To help you access your surveys and collect responses on the go, we're elated to announce the launch of the first-ever iPhone and iPad applications for Zoho Survey.
How can I get this application on my iOS device?
Our app is available on iPhone and Android devices. You can download the iOS app from the App Store.
What comes with this release?
Currently, you can use the application to launch and close surveys, or to view reports. We also support landscape and portrait views for the application on iPad.
How do I access the application?
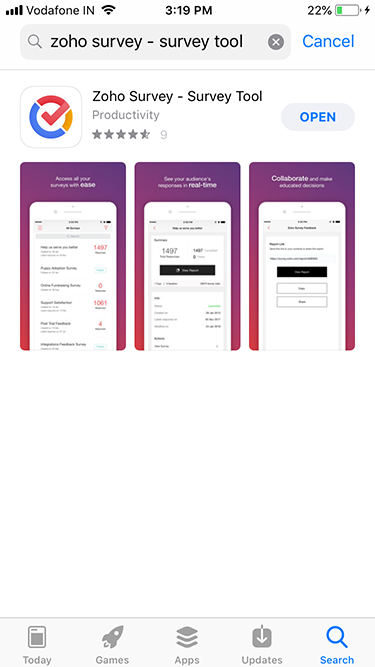
- Install the application on your iOS device.
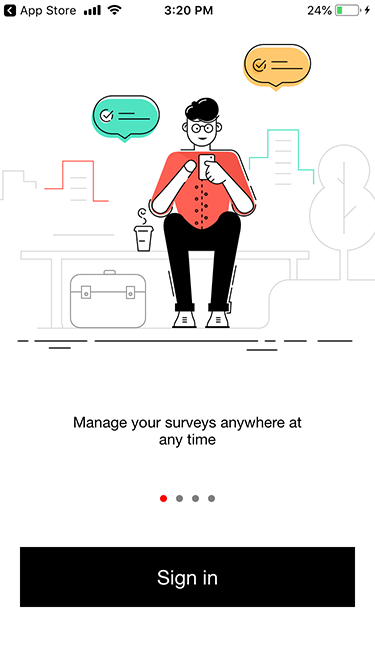
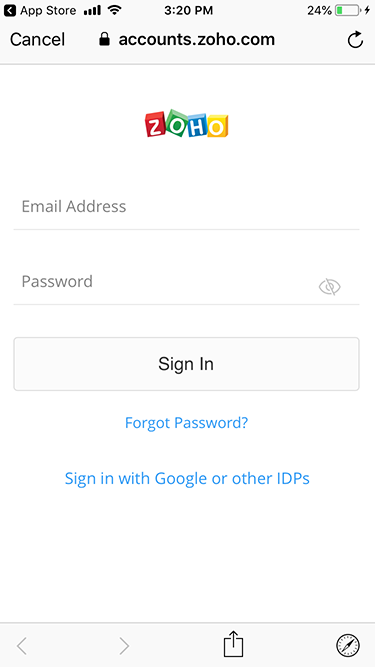
- Sign in by using your Zoho Corp credentials. You will be taken to the All Surveys page.
All Surveys
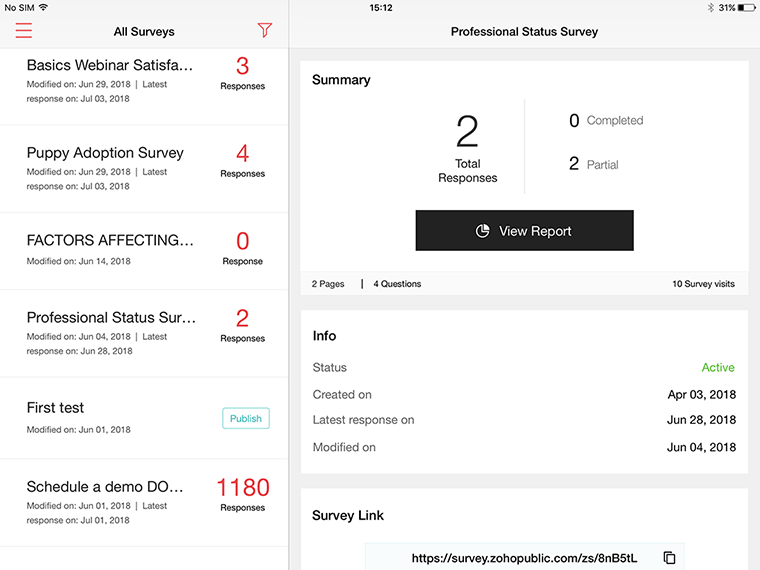
All the surveys you have created will be listed on the All Surveys page. Published surveys will have the survey modification date, latest response date, and total number of responses displayed along with the survey names. Surveys that are yet to be published will have the survey modification date and a Publish button prompting you to launch your survey.
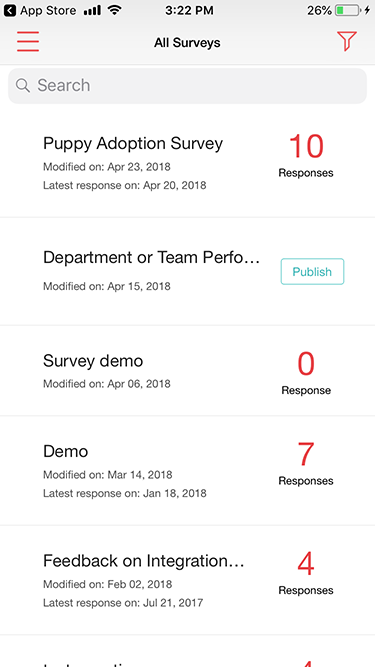
What do I do here?
- Swipe right or tap
 on the All Surveys page to access the dashboard
 - Tap the Search bar to search for surveys
- View the list of surveys in your account
- Tap
 to filter your surveys
 - Tap the surveys to see a summary of the survey
- Swipe down to refresh the page
Dashboard
The dashboard provides you with all the information regarding your departments and surveys, all in one place. There are quick access links to various functionalities of the application from a single screen.
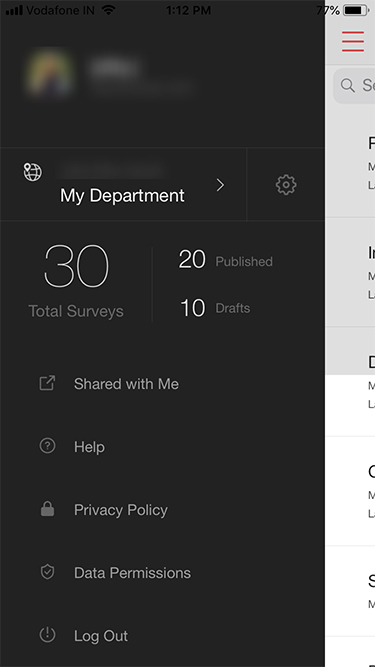
You can perform the following actions on the dashboard:
- View your account details
- Select a department
- Access your plan details
- View the total number of surveys in your account
- View the number of surveys you have published
- View the number of draft surveys you have in your account
- Access surveys that have been shared with you
- Read the user guide
- Read our privacy policy
- Enable/disable data permissions
- Log out from the application
Department
Departments, or groups, are specifically designed for teams to collaborate on surveys. With Zoho Survey, you can create and maintain departments and user accounts, and share surveys and reports with the organization members. However, these are features that are exclusive to Enterprise customers.
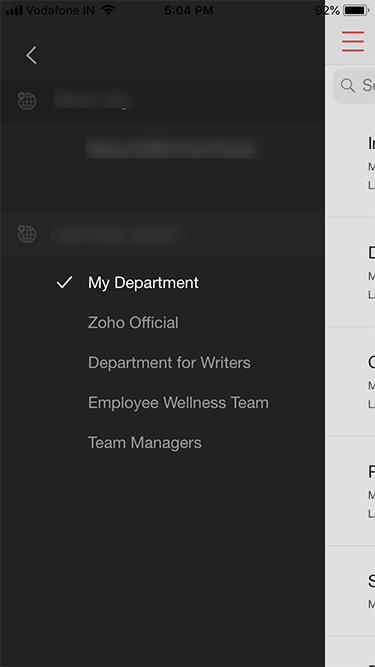
How do I select a department?
- Swipe right or tap
 on the All Surveys page.
 - Tap the department in use. You'll be able to see a list of all the surveys in the selected department, as well as the departments you are a part of. You can find the total number of surveys, the number of published ones, and the number of draft surveys in this department.
Settings
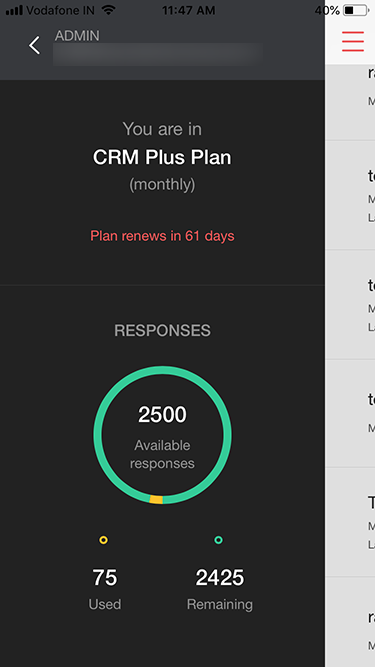
Access the Settings icon to see which plan you are in, how many responses you have in total, how many you have used so far, and to how many more are left in your user account.
Shared Surveys
Tap Shared with Me to take a look at the surveys that have been shared with you. Published surveys will have the name of the person who shared the survey with you, the survey modification date, the date on which you received the latest response, and the total number of responses displayed along with the survey names. The ones that are yet to be published will have the name of the person who shared the survey with you, the survey modification date, and a Publish button prompting you to launch your survey.
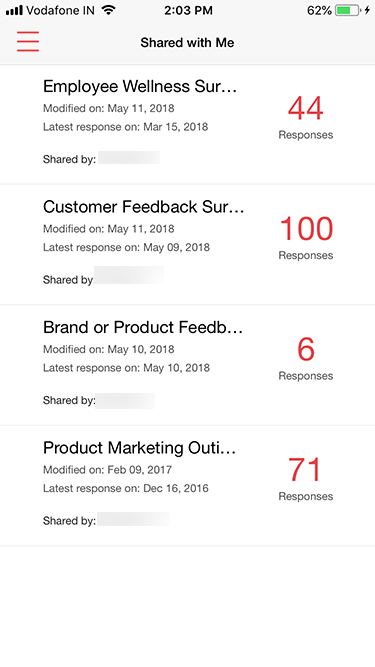
What do I do here?
Tap the surveys to see a summary of the survey.
Help
Tap Help to read our user guide. The help section has detailed step-by-step instructions you can follow to make your survey creation process hassle-free.
Privacy Policy
Tap Privacy Policy to read Zoho's privacy policy.
Data Permissions
For being GDPR compliant, we would need your consent for accessing any of your data. For this, when you log on to Zoho Survey app for the first time, or when you do a first update of the product (for existing users), you'll be prompted with the following screen asking for your consent. You can change the permissions you have entered at a later point also by accessing the Data Permissions option in the Dashboard.
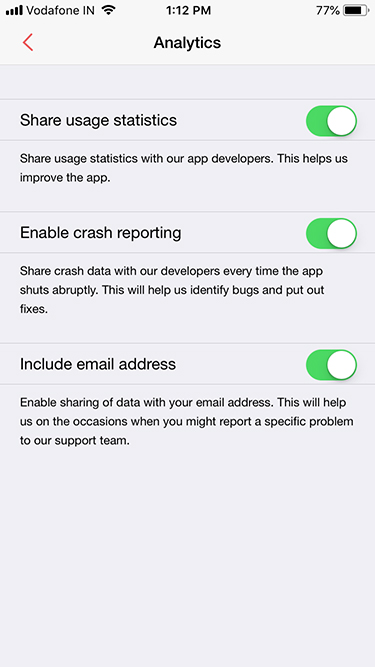
Tap Data Permissions to enable or disable permissions to access your data.
- Share usage statistics: To share your usage statistics with our app developers to help them improve the app.
- Enable crash reporting: To share your app crash data with our app developers to help them identify and fix bugs.
- Include email address: To share usage statistics and crash reporting data to your email address to offer better support. This gets enabled only if you turn on Share usage statistics or Enable crash reporting.
Log Out
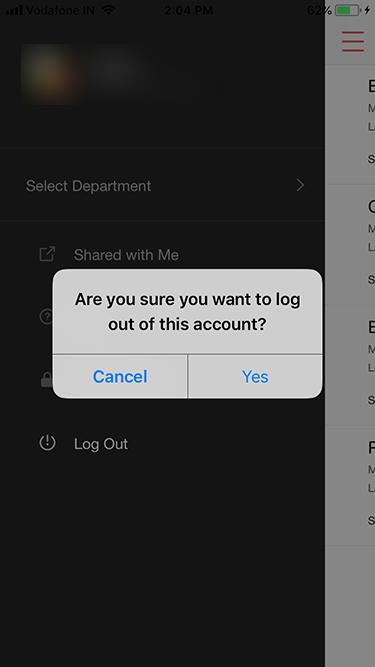
Tap Log Out, then tap Yes in the confirmation box that follows to move out of the application.
Reports
Get updates about your responses in real time with Zoho Survey's reporting tools to analyze the trends and make better business decisions. Customize reports and set up a schedule to deliver them, or compare different reports and filter your responses by the criteria you set. You can view a summary of all responses, or view them individually.
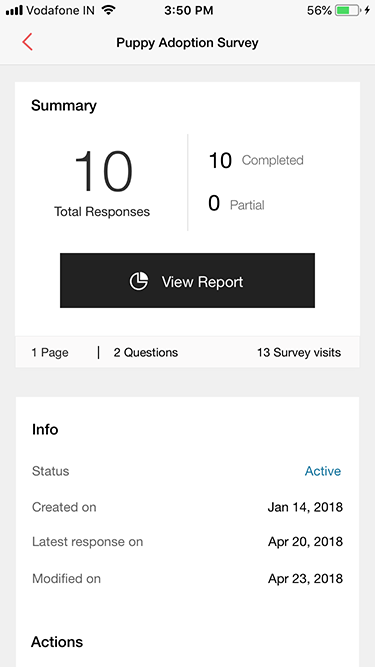
Table of Contents
- Default Report
- Custom Report
- Trend Report
- Cross-tab Report
- Individual Responses
- Share Report
- Schedule Report
- Delete Responses
How do I view the reports of a survey?
- Tap the published survey you want to select on the All Surveys page.
- Tap View Report to view the report in detail.
- Tap
 , or swipe left, to apply filters to manage your search results. You can filter your responses based on the time you received them, the collectors used, or the type of responses you received. You can apply the following filters here:
- All Responses
- Today's Responses
- Partial Responses
- Completed Responses
What do I do here?
- Tap
 and select + to create a new filter
 - Tap Clear Filter after a filter has been applied to remove all filters applied to the report
- Tap [i] in the top banner to take a look at the conditions you have applied in the filter
- Tap
 to share a report, schedule a report, or delete responses
How do I create a new filter?
- Tap
 and select the + icon.
 - Type a name for your filter in the Name field.
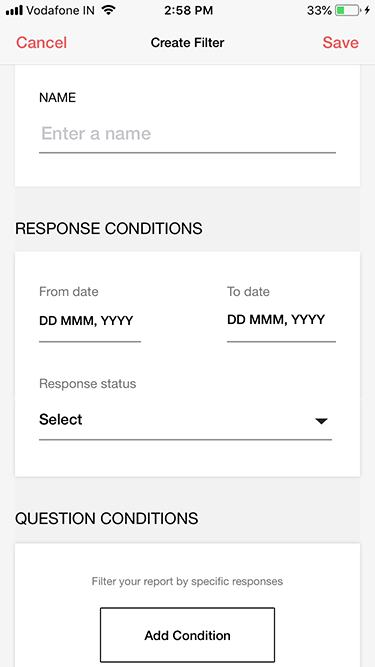
- Tap From date and To date to select a time range in the Response Conditions section to view the responses in a particular time period.
- Tap the scroll to select a date, month, and year in the From date and To date fields respectively.
- Tap Done to save the selection.
- Long press the date and tap Reset to reset the selection.
- Tap the checkboxes to select the response status.
- Select All
- Completed Responses
- Partial Responses
- Select Disqualified Responses if you want to filter and view the responses that do not fit your specific criteria. Read more on this.
- Tap Done.
- If you have multiple collectors, tap the Collector List dropdown to select collectors for your filter. If you have only one collector, it will be selected by default and this field will not be displayed.
- Tap Add Condition and select questions to set a logic for your filter.
- Tap + to add more conditions.
- Swipe left to delete a condition.
- Tap the question to change the question. However, it wouldn't work if you try changing the question while editing the question you have selected.
- Tap Done to save the selection.
- Tap All if you want to match all the conditions, or tap Any if you do not want to match any of them.
- Tap Save. Your new filter will be added to the filter options.
What are the different kinds of reports?
- Default: To view the default report page
- Custom: To create customized reports
- Trend: To view and compile statistics by date
- Cross Tab: To view a comparison of two multiple choice questions to determine how they are interrelated
- Individual: To view individual response reports
Default and Custom Reports
The default report displays a detailed report for each question in charts and figures. Tap  when you are in the reports section to view the default report.
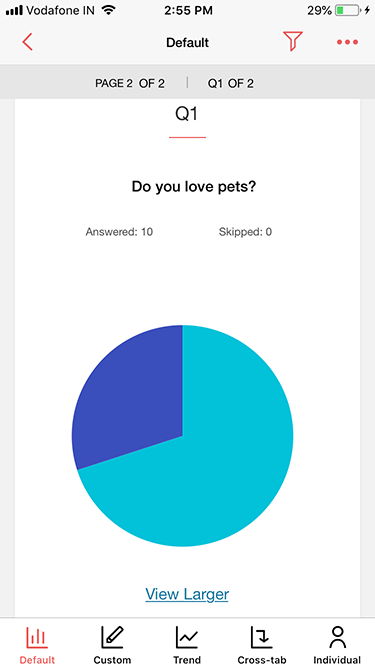
You can select the questions that you need and create custom reports. This report can be shared with your colleagues and can be selected under filters to view responses for a selected set of questions.
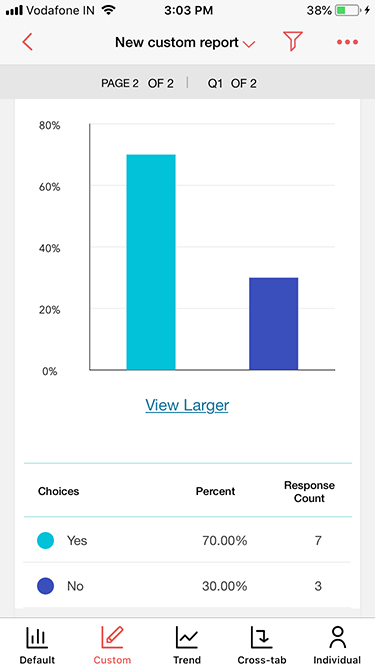
How do I view a custom report?
- Tap
 in the reports view to navigate to the survey’s custom reports.
 - Tap the down arrow in the top banner and a list of available custom reports will be displayed.
- Tap the custom report you want to view.
What can I do here?
- Filter the report based on specific conditions
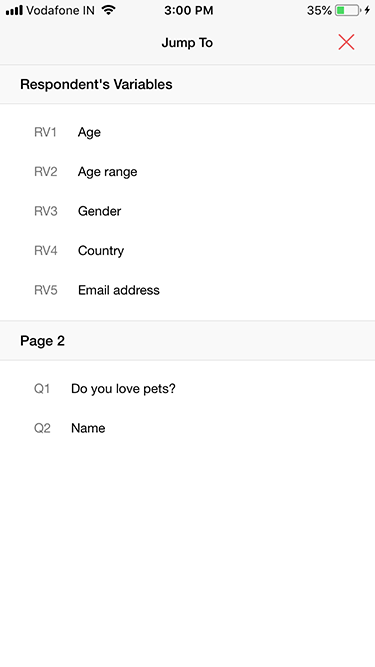
- Tap the page number banner to jump to any page or question

- View the number of people who answered and skipped each question
- View the responses of closed-ended questions of your survey summarized into charts and data
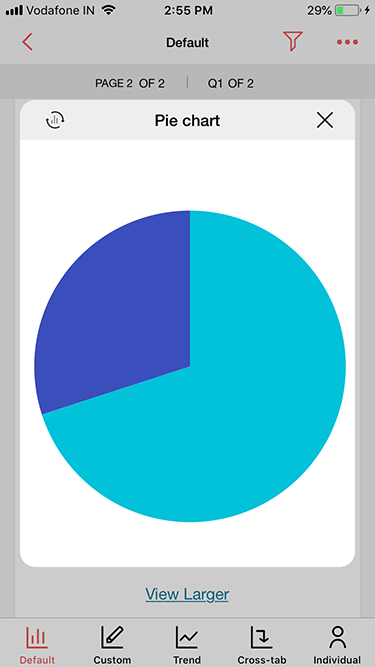
- Tap View Larger on the iPhone app to have a closer look at any chart
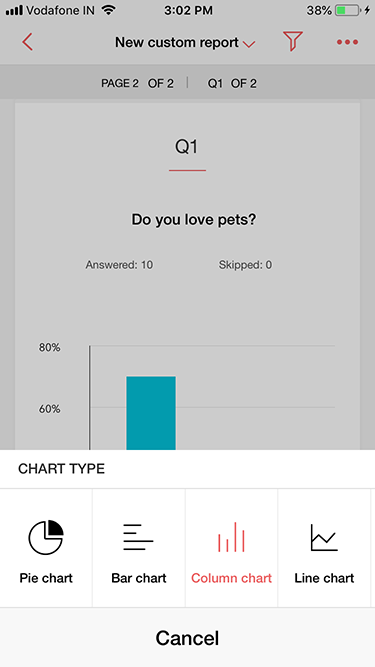
- Tap the chart to change the chart type
- Tap the
 knob in the iPad application to view statistical data
- Tap Show Responses to view a list of all responses for any open-ended question
- Swipe left on each response (except for Full Name and Contact Information questions) and tap View Full Response to take a look at the individual responses completely
- For all Full Name and Contact Information questions, tap each response to view the individual responses completely
- For Single Line, Multiple Lines, Calendar, Email, and Numeric questions, tap the responses to copy and share them through various apps on your device
- For Email questions, tap the responses to navigate to the mailbox where you can compose an email to that particular email address
- For Signature and File Upload questions, tap the responses to view the file content
How do I create a new custom report?
- Tap
 in the reports view to navigate to the survey’s custom reports.
 - Tap New Custom Report or tap
 and select Create Report.
 - Type a name for your report in the Name field.
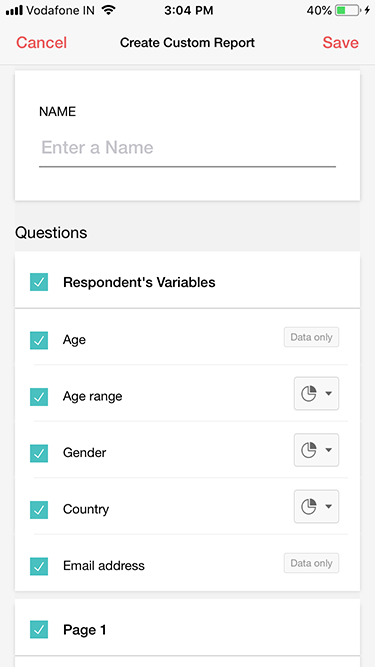
- Tap the checkboxes to select the questions, variables, and cross-tab reports you would like to include in your custom report.
- Tap
 to change the chart type for any closed-ended question.
 - Tap Save. Your new custom report will be added to the dropdown list of custom reports.
How do I edit a custom report?
- Tap
 in the reports view to navigate to the survey’s custom reports.
 - Tap the down arrow in the top and a list of available custom reports will be displayed.
- Tap the custom report you want to edit.
- Tap
 .
. - Tap Edit Report.
- Tap Save after you have edited the report.
How do I delete a custom report?
- Tap
 in the reports view to navigate to the survey’s custom reports.
 - Tap the down arrow in the top and a list of available custom reports will be displayed.
- Tap the custom report you want to delete.
- Tap
 .
. - Tap Delete.
Trend Report
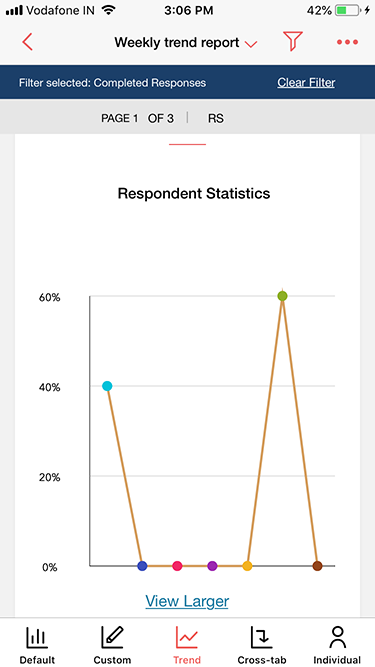
Trend reports show you the changes in the responses you receive over a particular time period. The default trend reports will show you the changes until today, by day, week, month, or quarter.
How do I view the trend reports?
- Tap
 in the reports view to navigate to the survey’s trend reports.
 - Tap the down arrow in the top and a list of available trend reports will be displayed.
- Tap the trend report you want to view.
What can I do here?
- Filter the report based on specific conditions
- Tap the page number banner to jump to any page or question

- View the number of people who answered and skipped each question
- View the trends of responses to your survey summarized into charts and data
- Tap the chart to change its type
- Tap View Larger on the iPhone app to have a closer look at any chart
- Tap the
 knob in the iPad application to view statistical data
How do I create a trend report?
- Tap
 in the reports view to navigate to the survey’s trend reports.
 - Tap
 and select Create Report.
 - Type a name for your report in the Name field.
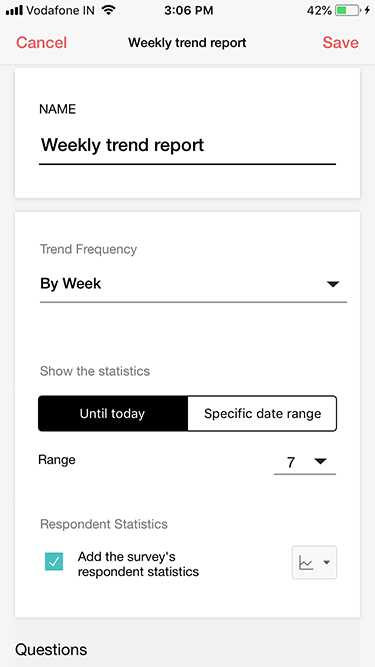
- Tap the dropdown to select a trend frequency for your graph.
- Tap either of the following to select a trend statistic date range.
- Tap Until Today to display the trend statistics through the present.
- Tap the Range dropdown to select the range.
- Tap Specific Date Range to select a time range.
- Tap to select dates in the calendars and tap the scroll to select a date, month, and year respectively.
- Long press the date and tap Reset to reset the selection.
- Tap Until Today to display the trend statistics through the present.
- Tap the Add the survey's respondent statistics checkbox to include these statistics in the report.
- Tap the checkboxes to select the variables and questions you want to include in the report.
- Tap
 to change the chart type for any question.
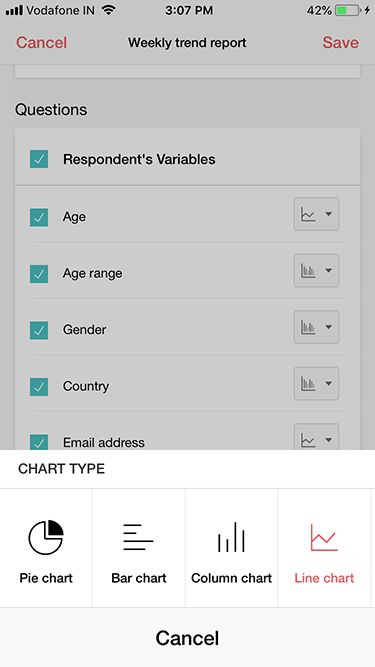
- Tap Save. Your new report will be added to the dropdown list of trend reports.
How do I edit a trend report?
- Tap
 in the reports view to navigate to the survey’s trend reports.
 - Tap the down arrow in the top and a list of available trend reports will be displayed.
- Tap the trend report you want to edit.
- Tap
 .
. - Tap Edit Report.
- Tap Save after you have edited the report.
How do I delete a trend report?
- Tap
 in the reports view to navigate to the survey’s trend reports.
 - Tap the down arrow in the top and a list of available trend reports will be displayed.
- Tap the trend report you want to delete.
- Tap
 .
. - Tap Delete.
Cross-tab Report
Cross-tab reports are used to compare two questions and analyze their correlation. These reports can be shared and can also be selected by filter to show the data. You can create cross-tab reports with multiple columns with charts and tables shown for each row and column. Also, cross-tab columns now support open-ended and matrix type questions, except for matrix dropdown, matrix textbox, and text field (heading or description).
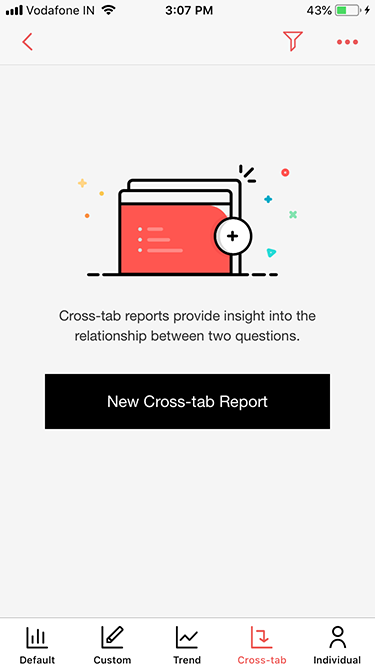
How do I view the cross-tab reports?
- Tap
 in the reports view to navigate to the survey’s cross-tab reports.
 - Tap the down arrow in the top and a list of available cross-tab reports will be displayed.
- Tap the cross-tab report you wish to view.
What can I do here?
- Filter the report based on specific conditions
- View the number of people who answered and skipped each question
- View the cross-tab of two closed-ended questions summarized into charts and data
- Tap the chart to change its type
- Tap View Larger on the iPhone app to have a closer look at any chart
- Tap the
 knob in the iPad application to view statistical data
How do I create a cross-tab report?
- Tap
 in the reports view to navigate to the survey’s cross-tab reports.
 - Tap New Cross-tab Report or tap
 and select Create Report.
 - Type a name in the Name field.
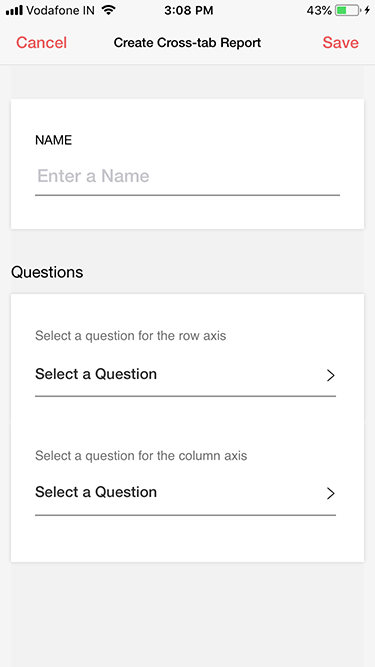
- Tap Select a Question to select questions for the row axis and column axis respectively.
- Tap Save. Your new report will be added to the dropdown list of cross-tab reports.
How do I edit a cross-tab report?
- Tap
 in the reports view to navigate to the survey’s cross-tab reports.
 - Tap the down arrow in the top and a list of available cross-tab reports will be displayed.
- Tap the cross-tab report you wish to edit.
- Tap
 .
. - Tap Edit Report.
- Tap Save after you have edited the report.
How do I delete a cross-tab report?
- Tap
 in the reports view to navigate to the survey’s cross-tab reports.
 - Tap the down arrow in the top and a list of available cross-tab reports will be displayed.
- Tap the cross-tab report you wish to delete.
- Tap
 .
. - Tap Delete.
Individual Responses
You can view the individual responses for each of your survey questions in this section. The respondent's IP address, and the date they responded, and the completion status of the responses will also be displayed here. If the respondent hasn't answered a question, it will be shown as Skipped.
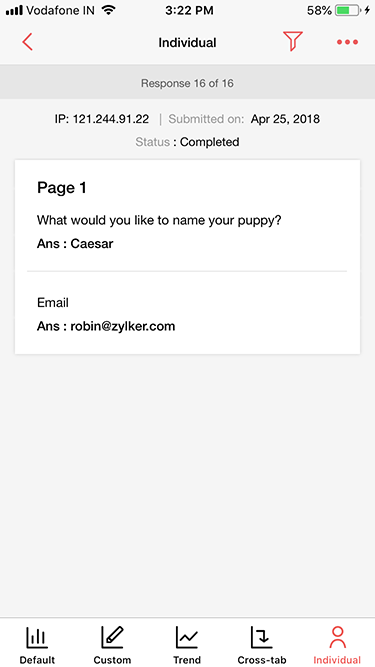
How do I view individual responses?
Tap  in the reports view, to navigate to the survey’s individual responses.
What can I do here?
- Filter the report based on specific conditions
- Tap the response banner or swipe to the left and right to navigate to any response based on the respondent's IP address, the date they responded, and the time they took to complete the survey
Share Report
Share your reports with colleagues, survey respondents, organizations, or the public. You can also secure shared reports with a password.
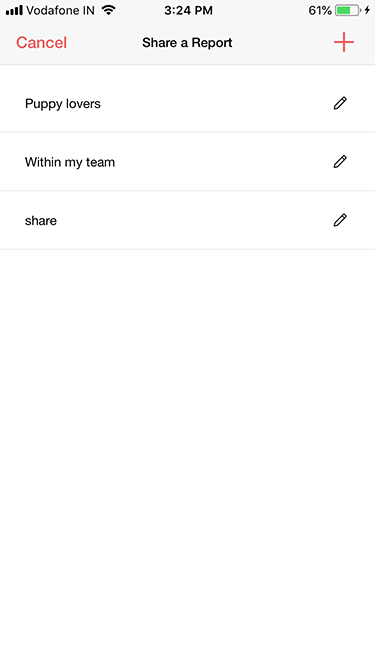
How do I share a report?
- Tap
 in the reports view, and select Share Reports.
 - Tap Create Report.
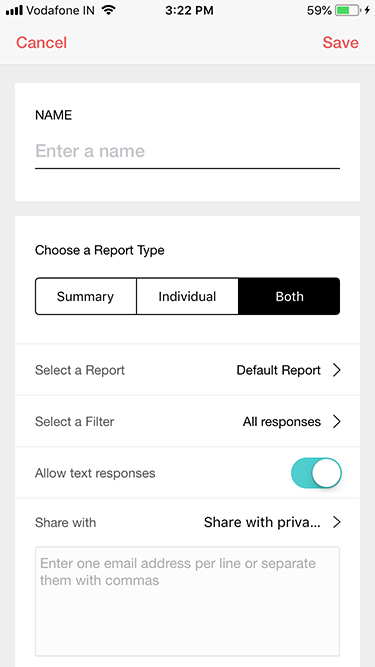
- Type a name for your report in the Name field.
- Tap to select one of the Choose a Report Type options:
- Summary - Tap this option if you just want a summary of your responses.
- Tap Select a Report and tap to select the report you want to share.
- Tap Select a Filter to select a filter.
- Tap to enable or disable the option to Allow Text Responses. When enabled, it shares the text responses to open-ended questions with your report's summary. These options will not be available if you select Individual sharing.
- Tap Share with and select an audience.
- Share with private user: Tap this option to share your report privately with individual users by typing the users' email addresses. Once the survey is shared, an email will be sent to the user with the survey link.
- Share with the organization: Tap this option to share your report with your organization.
- Share with the public: To make your report publicly accessible. Search engines will also be able to crawl this report.
- Share with password: Tap this option to secure your report so that only users who have the password can access it. Type your chosen password into the Enter Password field.
- Individual - Tap this option to see the details of each individual response.
- Select a Filter: You can apply the following filters here:
- All Responses
- Today's Responses
- Partial Responses
- Completed Responses
- Share with: Tap to select an audience.
- Share with private user: Tap this option to share your report privately with individual users by typing the users' email addresses. Once the survey is shared, an email will be sent to the user with the survey link.
- Share with the organization: Tap this option to share your report with your organization.
- Share with the public: To make your report publicly accessible. Search engines will also be able to crawl this report.
- Select a Filter: You can apply the following filters here:
- Both - Tap this option to see the summary and the individual response details.
- Tap Select a Report and tap to select the report you want to share.
- Tap Select a Filter to select a filter.
- Tap to enable or disable the option to Allow Text Responses. When enabled, it shares the text responses to open-ended questions with your report's summary. These options will not be available if you select Individual sharing.
- Tap Share with and select an audience.
- Share with private user: Tap this option to share your report privately with individual users, and type the users' email addresses. Once the survey is shared, an email will be sent to the user with the survey link.
- Share with the organization: Tap this option to share your report with your organization.
- Share with the public: To make your report publicly accessible. Search engines will also be able to crawl this report.
- Share with password: Tap this option to secure your report so that only users who have the password can access it. Type your chosen password into the Enter Password field.
- Summary - Tap this option if you just want a summary of your responses.
- Tap Save. A web link will be generated.
- Tap View Report to view the report in the browser.
- Tap Copy to copy the web link.
- Tap Share and select the applications that appear in the pop up to share your survey through various social media platforms or applications.
How do I edit a shared report?
- Tap
 in the reports view, and select Share Report. A list of shared reports will come up, if you've created them before.
 - Tap
 next to the shared report you wish to edit.
 - Tap Save after you have edited the report.
How do I view a shared report?
- Tap
 in the reports view, and select Share Report.
 - Tap the shared report you want to view the link of.
- The web link of the shared report will be displayed.
- Tap View Report to view the report in the browser.
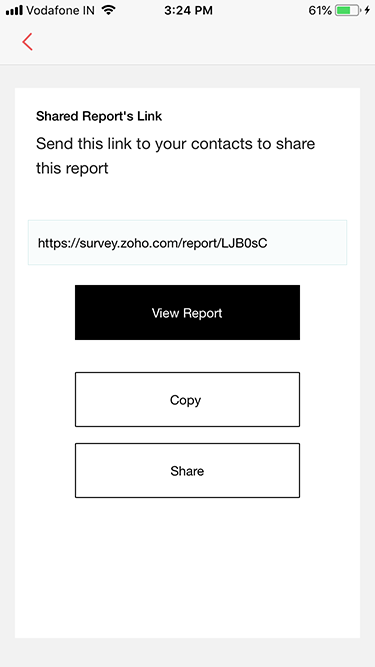
- Tap Copy to copy the web link.
- Tap Share and select the applications that appear in the pop up to share your survey through various social media platforms or applications.
- Tap View Report to view the report in the browser.
Schedule Report
Schedule your reports to be delivered to specific users daily, weekly, or monthly.
How do I schedule a report?
- Tap
 in the reports view, and select Schedule Reports.
 - If you haven't created a scheduled report before, tap Create Report.
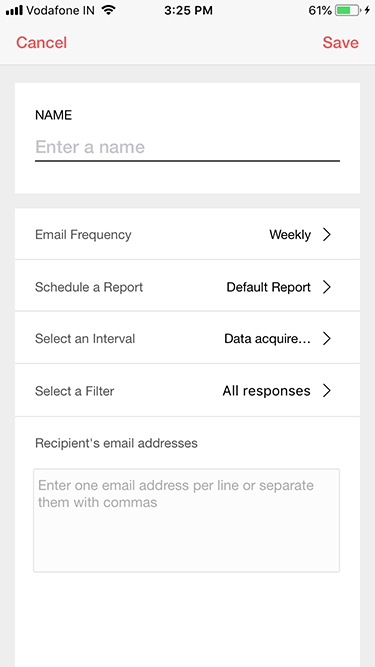
- Type a name for your report in the Name field.
- Tap Email Frequency to select a frequency to email your reports: Daily, Weekly, Monthly.
- Tap Schedule a Report and select the type of report you want to schedule.
- Tap Select an Interval.
- Tap All data to receive all responses.
- Tap Data acquired within frequency interval to receive responses for a specific time period.
- Tap Select a Filter to set a filter for reports. You can apply the following filters here:
- All Responses
- Today's Responses
- Partial Responses
- Completed Responses
- In the Recipient's email addresses box, type the email addresses of the recipients, one per line or separated by commas.
- Tap Save.
How do I edit a scheduled report?
- Tap
 in the reports view, and select Schedule Report. A list of scheduled reports will come up if you've created them before.
 - Tap the scheduled report you wish to edit.
- Tap Save after you have edited the report.
Delete Responses
Delete the responses of your survey in bulk. You can reset your survey by deleting all your responses, or by deleting a filtered list of responses.
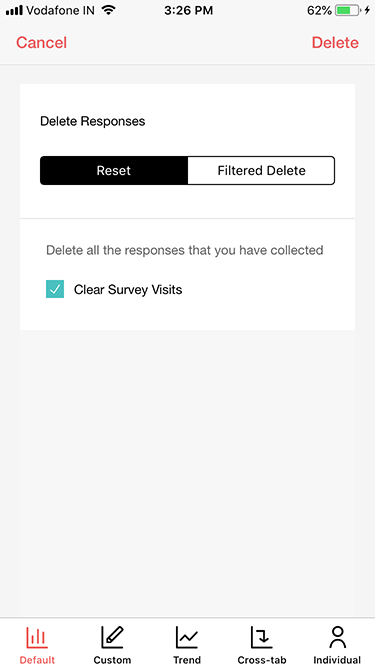
How do I bulk delete responses?
- Tap
 in the reports view, and select Delete Responses.
 - Tap the type of deletion you wish to perform.
- Tap Reset if you wish to delete all responses the survey has collected.
- Uncheck the Clear Survey Visits checkbox if you wish to clear the number of visits for your survey from your reports.
- Tap Filtered Delete if you wish to delete a filtered list of responses.
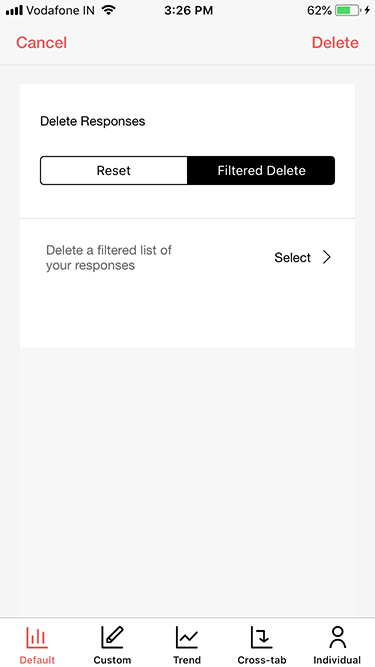
- Tap Delete a filtered list of your responses and tap the filter you wish to apply to your bulk deletion.
- Tap Reset if you wish to delete all responses the survey has collected.
- Tap Delete.
Note: Deleted responses can't be recovered.
Search
Find surveys by typing keywords into the search bar on the All Surveys page.
Filter
Apply filters to manage your search results. Tap  and you can apply the following filters on the All Surveys page.
- All Surveys
- Published
- Drafts
- Closed
You can click Cancel to remove any selected filters.
Summary
Tap any survey and you will be directed to the summary of the survey. Surveys that are yet to be published will list the number of pages and questions in your survey, and the date on which it was created. Published surveys will have the total number of responses, details on the number of completed and partial responses, and the number of pages, questions, and survey visits. It also lists out the status of the survey, its creation date, latest response date, and modified date.
What can I do here?
In unpublished surveys:
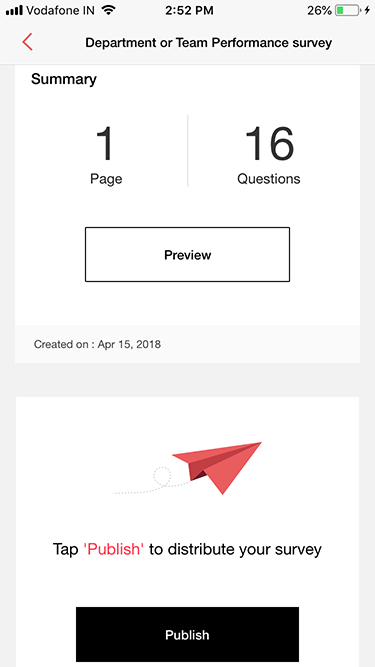
- Tap
 to go back to the previous page
 - Tap Preview to view the survey
- Tap Publish to launch your survey
The web link for the survey will be generated, where you can perform the following actions:
- Tap Access Survey to go to the survey live form
- Tap Copy to copy the web URL
- Tap Share and select the applications that appear in the pop-up to share your survey through various social media platforms or applications
In published surveys:

- Tap View Report to view the report in detail.
- Tap
 to go back to the previous page
In iPad, the survey link will be displayed in the Survey Link section.
- Tap View Survey to access the survey
- Tap the copy icon to copy the link
- Tap Share Survey to share your survey through various apps
In iPhone, you can perform the following in the Actions section:
- View Survey - Tap this to access the web link of the survey
- Tap Access Survey to go to the survey live form
- Tap Copy to copy the web URL
- Tap Share and select the applications that appear in the pop up to share your survey through various social media platforms or applications
- Tap Close Survey to stop receiving responses for the survey


 on the All Surveys page to access the
  to share a report, schedule a report, or delete responses
 in the reports view to navigate to the survey’s custom reports.


 knob in the iPad application to view statistical data


 to change the chart type for any closed-ended question.
 in the reports view to navigate to the survey’s trend reports.

 in the reports view to navigate to the survey’s cross-tab reports.

 next to the shared report you wish to edit.


 to go back to the previous page