- HOME
- Work Management
- The best Excel alternative to manage business expenses
The best Excel alternative to manage business expenses
- Last Updated : January 6, 2025
- 513 Views
- 5 Min Read

From the late 80s until today, Microsoft Excel has a solid reputation for number crunching, and has garnered millions of users worldwide. From record-keeping and invoicing to people management and performance reporting, businesses have relied on Excel. However, modern businesses need more than just spreadsheets to manage their business expenses. They need streamlined workflows, automation, data visualization, and more. Sadly, Excel falls short of these expectations.
This blog will explore a better Excel alternative to manage business expenses, covering the benefits and shortcomings of the popular tool compared to the alternative.
Why is Excel so popular?
Ease of use
Excel has a simple grid interface with rows and columns to store data. Users can start working on it straight away without learning to code or write database queries. It also offers a wide range of keyboard shortcuts to navigate faster. Overall, it makes it easier for users to manage data.
Cost-effective
Excel is a part of the Microsoft Office suite. So, when users purchase a one-time license, they get lifetime access to Excel. This makes it an easy option for individuals and startups to manage their monthly expenses on spreadsheets.
Customization
An Excel sheet can be customized to fit your needs. You can use expense tracker templates or start from scratch. You can create custom expense categories, use conditional formatting to highlight specific data, and add custom filters for easy tracking and sorting.
Powerful formulas
Excel has both built-in formulas and custom formulas for number crunching. These formulas eliminate manual effort and human errors. For example, you can track expense deadlines using the date formula. By setting custom rules, you can define thresholds for spending. You can also use IF-ELSE functions to return values based on multiple conditions.
Data analysis
Excel has graphs, charts, and diagrams to visualize and analyze data. So, it is easier to analyze monthly, quarterly, and annual expenses. It can also generate pivot tables based on trends and patterns.
Limitations of Excel
Difficulty in establishing bi-directional relationships between sheets
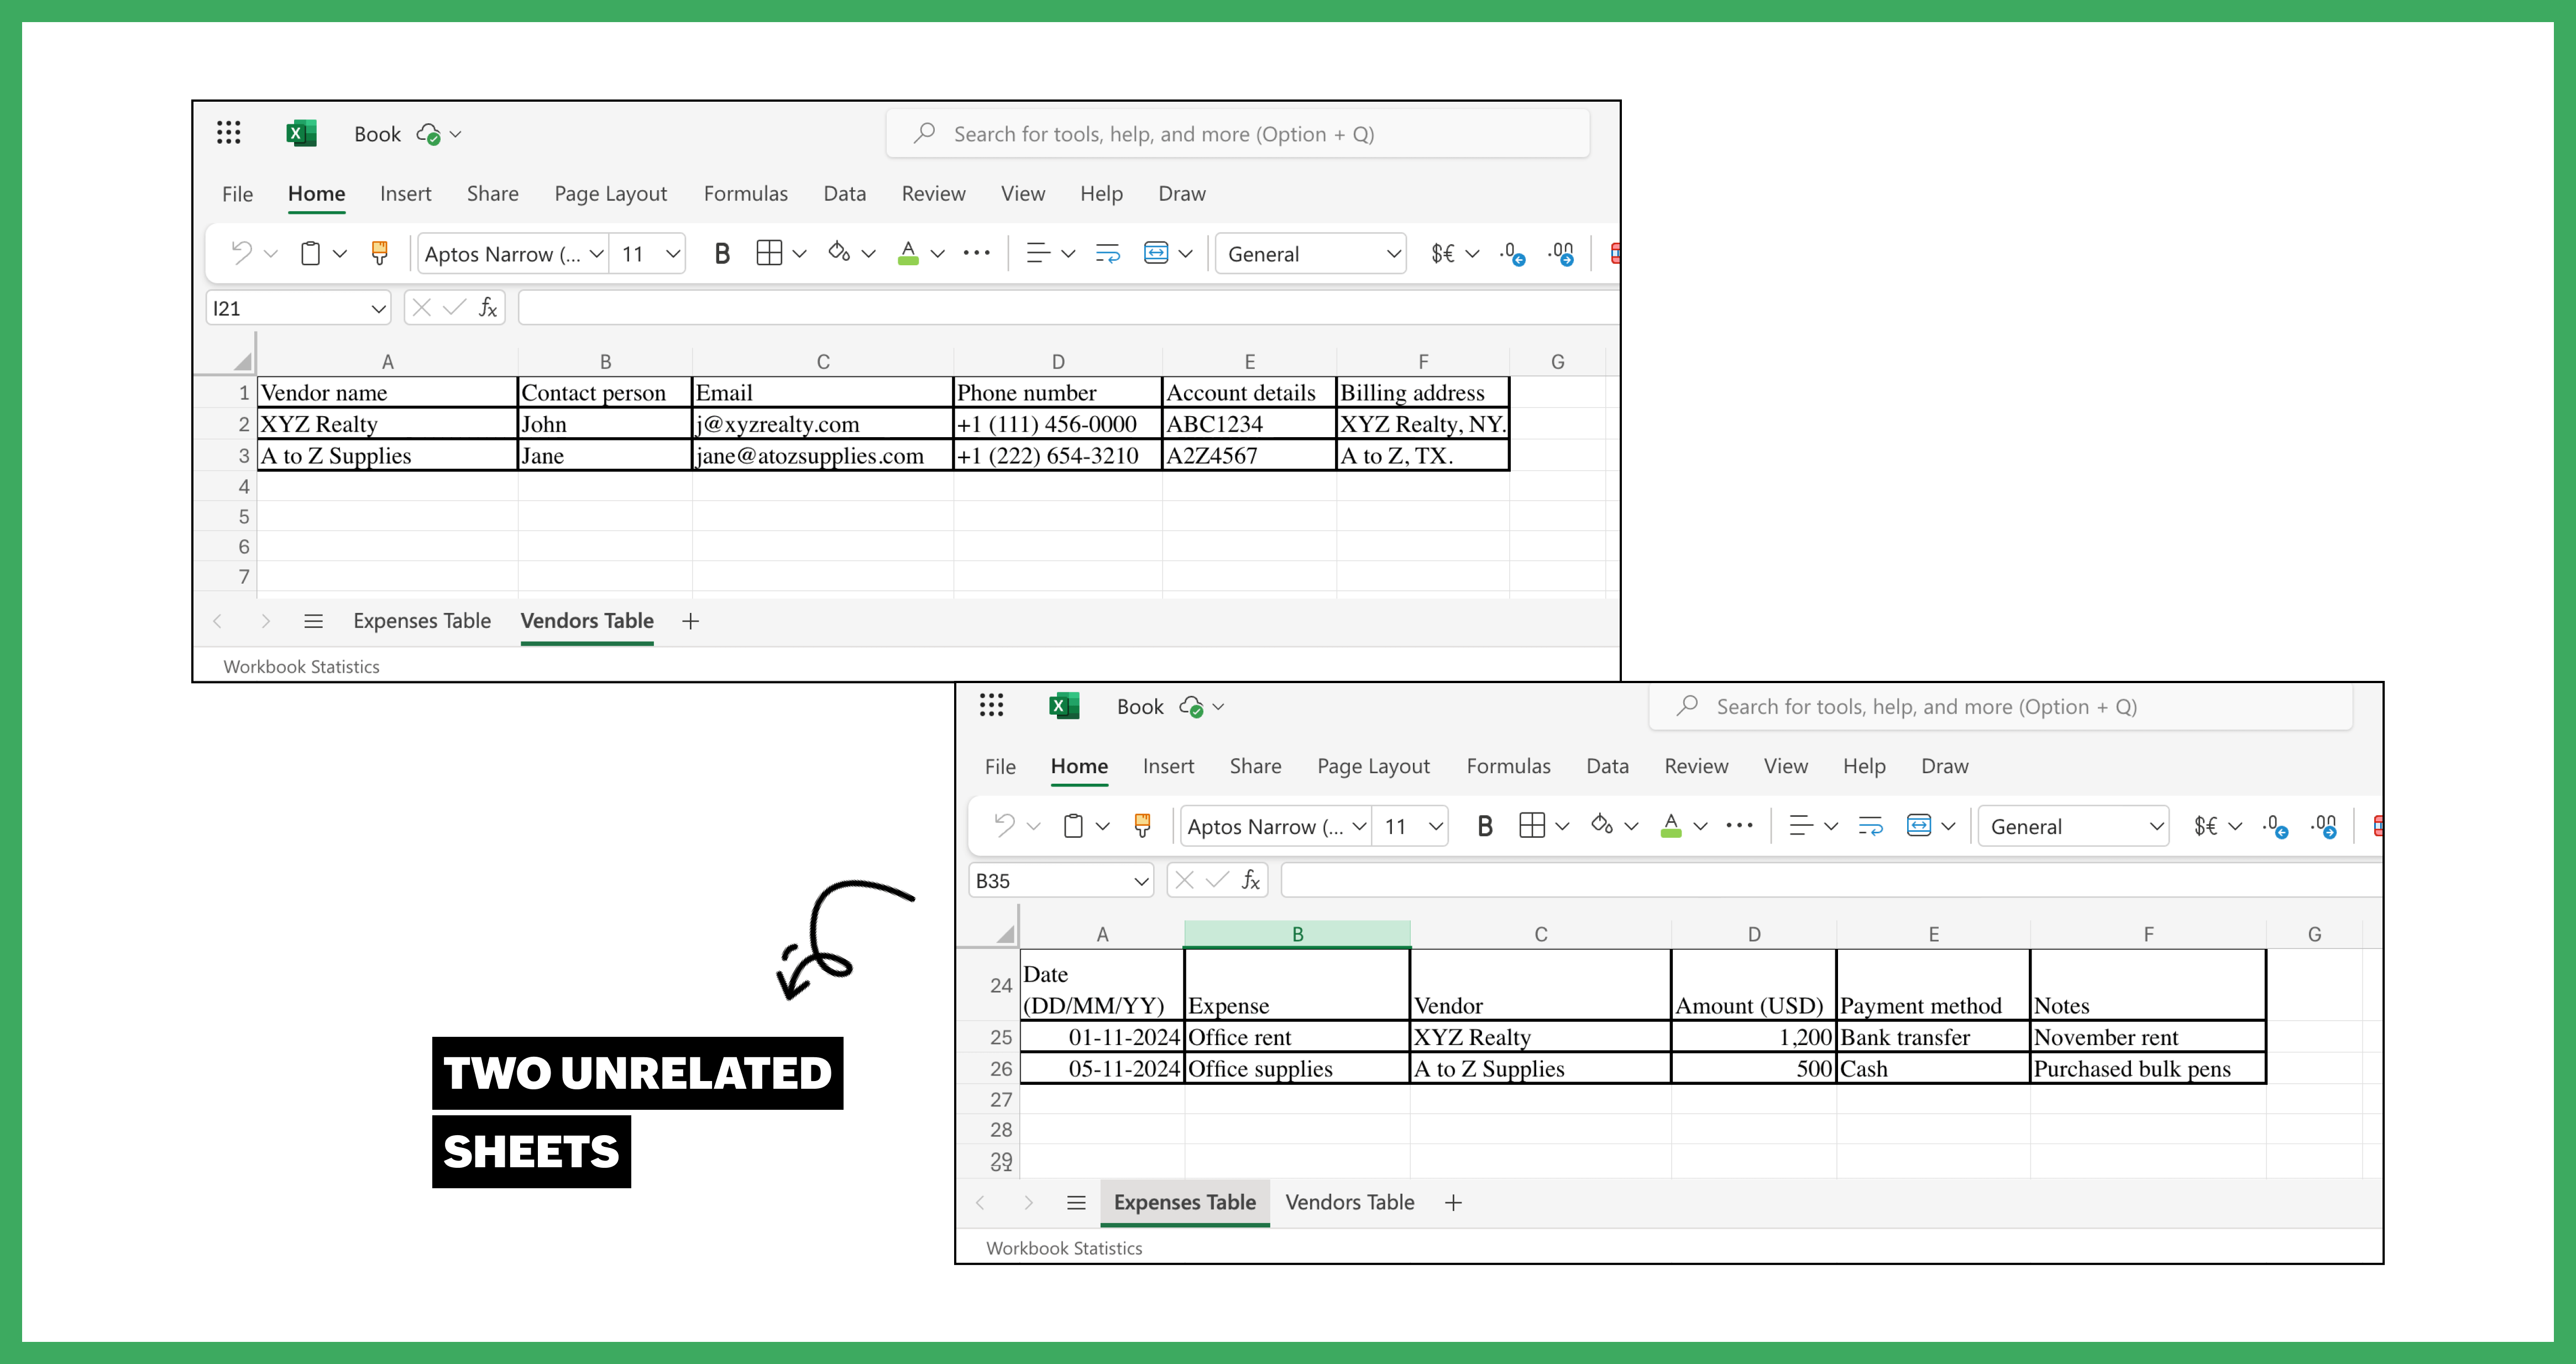
Let's assume you have an Excel sheet to track your expenses and vendors' data. It will look something like this.

You need to establish a bi-directional relationship between the tables, so that when you make changes in one, they will be reflected in the other as well. If you update the vendor's details on the Vendor tab, it should automatically be updated on the Expenses tab. However, Excel does not natively support bi-directional relationships. So, you will be forced to update the vendor details manually on both tabs. The only other workaround is integrating your Excel data with Power BI for relational functionality. The lack of native bi-directional relationships in Excel is one of the many reasons businesses opt for other alternatives.
Outdated data visualizations
While Excel provides basic charts, graphs, and diagrams to visualize data, it lacks advanced views like calendar, gallery, and Kanban. This limits users to view their data in a rigid one-dimensional view.
Manual data entry
Adding expenses and cash flows manually in an Excel sheet is tedious and prone to human errors. As the dataset increases, it becomes harder to scale. It also leads to data discrepancies and resource drain.
No built-in automation
Excel does not have native automation capabilities. Users have to rely on external tools or set up conditional formulas to handle various scenarios. This can complicate the spreadsheet, especially when handling multiple conditions.
Limited collaboration
Excel allows real-time collaboration only in its web version. Managing business expenses requires cross-functional teams to work on datasets. With limited collaboration capabilities, version control issues arise when multiple collaborators try to update data simultaneously. This is risky as accidental deletion and data overwriting can lead to data loss.
Inconvenient mobile app
The Excel mobile application is only suitable for simple use cases, but managing monthly expenses comes with complex needs. It is cumbersome to view large sets of data in the grid format on a small screen. The absence of calendar, Kanban, and gallery views makes it hard to summarize and interpret your data. As a result, you’ll find yourself scrolling through endless rows and columns when you're on the go.
Why Zoho Tables is a better Excel alternative for managing business expenses
Familiar interface
Zoho Tables has the look and feel of a spreadsheet. This makes it easier for Excel users to adapt to Zoho Tables easily. It combines the familiar grid layout with advanced features that can fit advanced use cases. The fully responsive design provides a seamless experience across various devices.
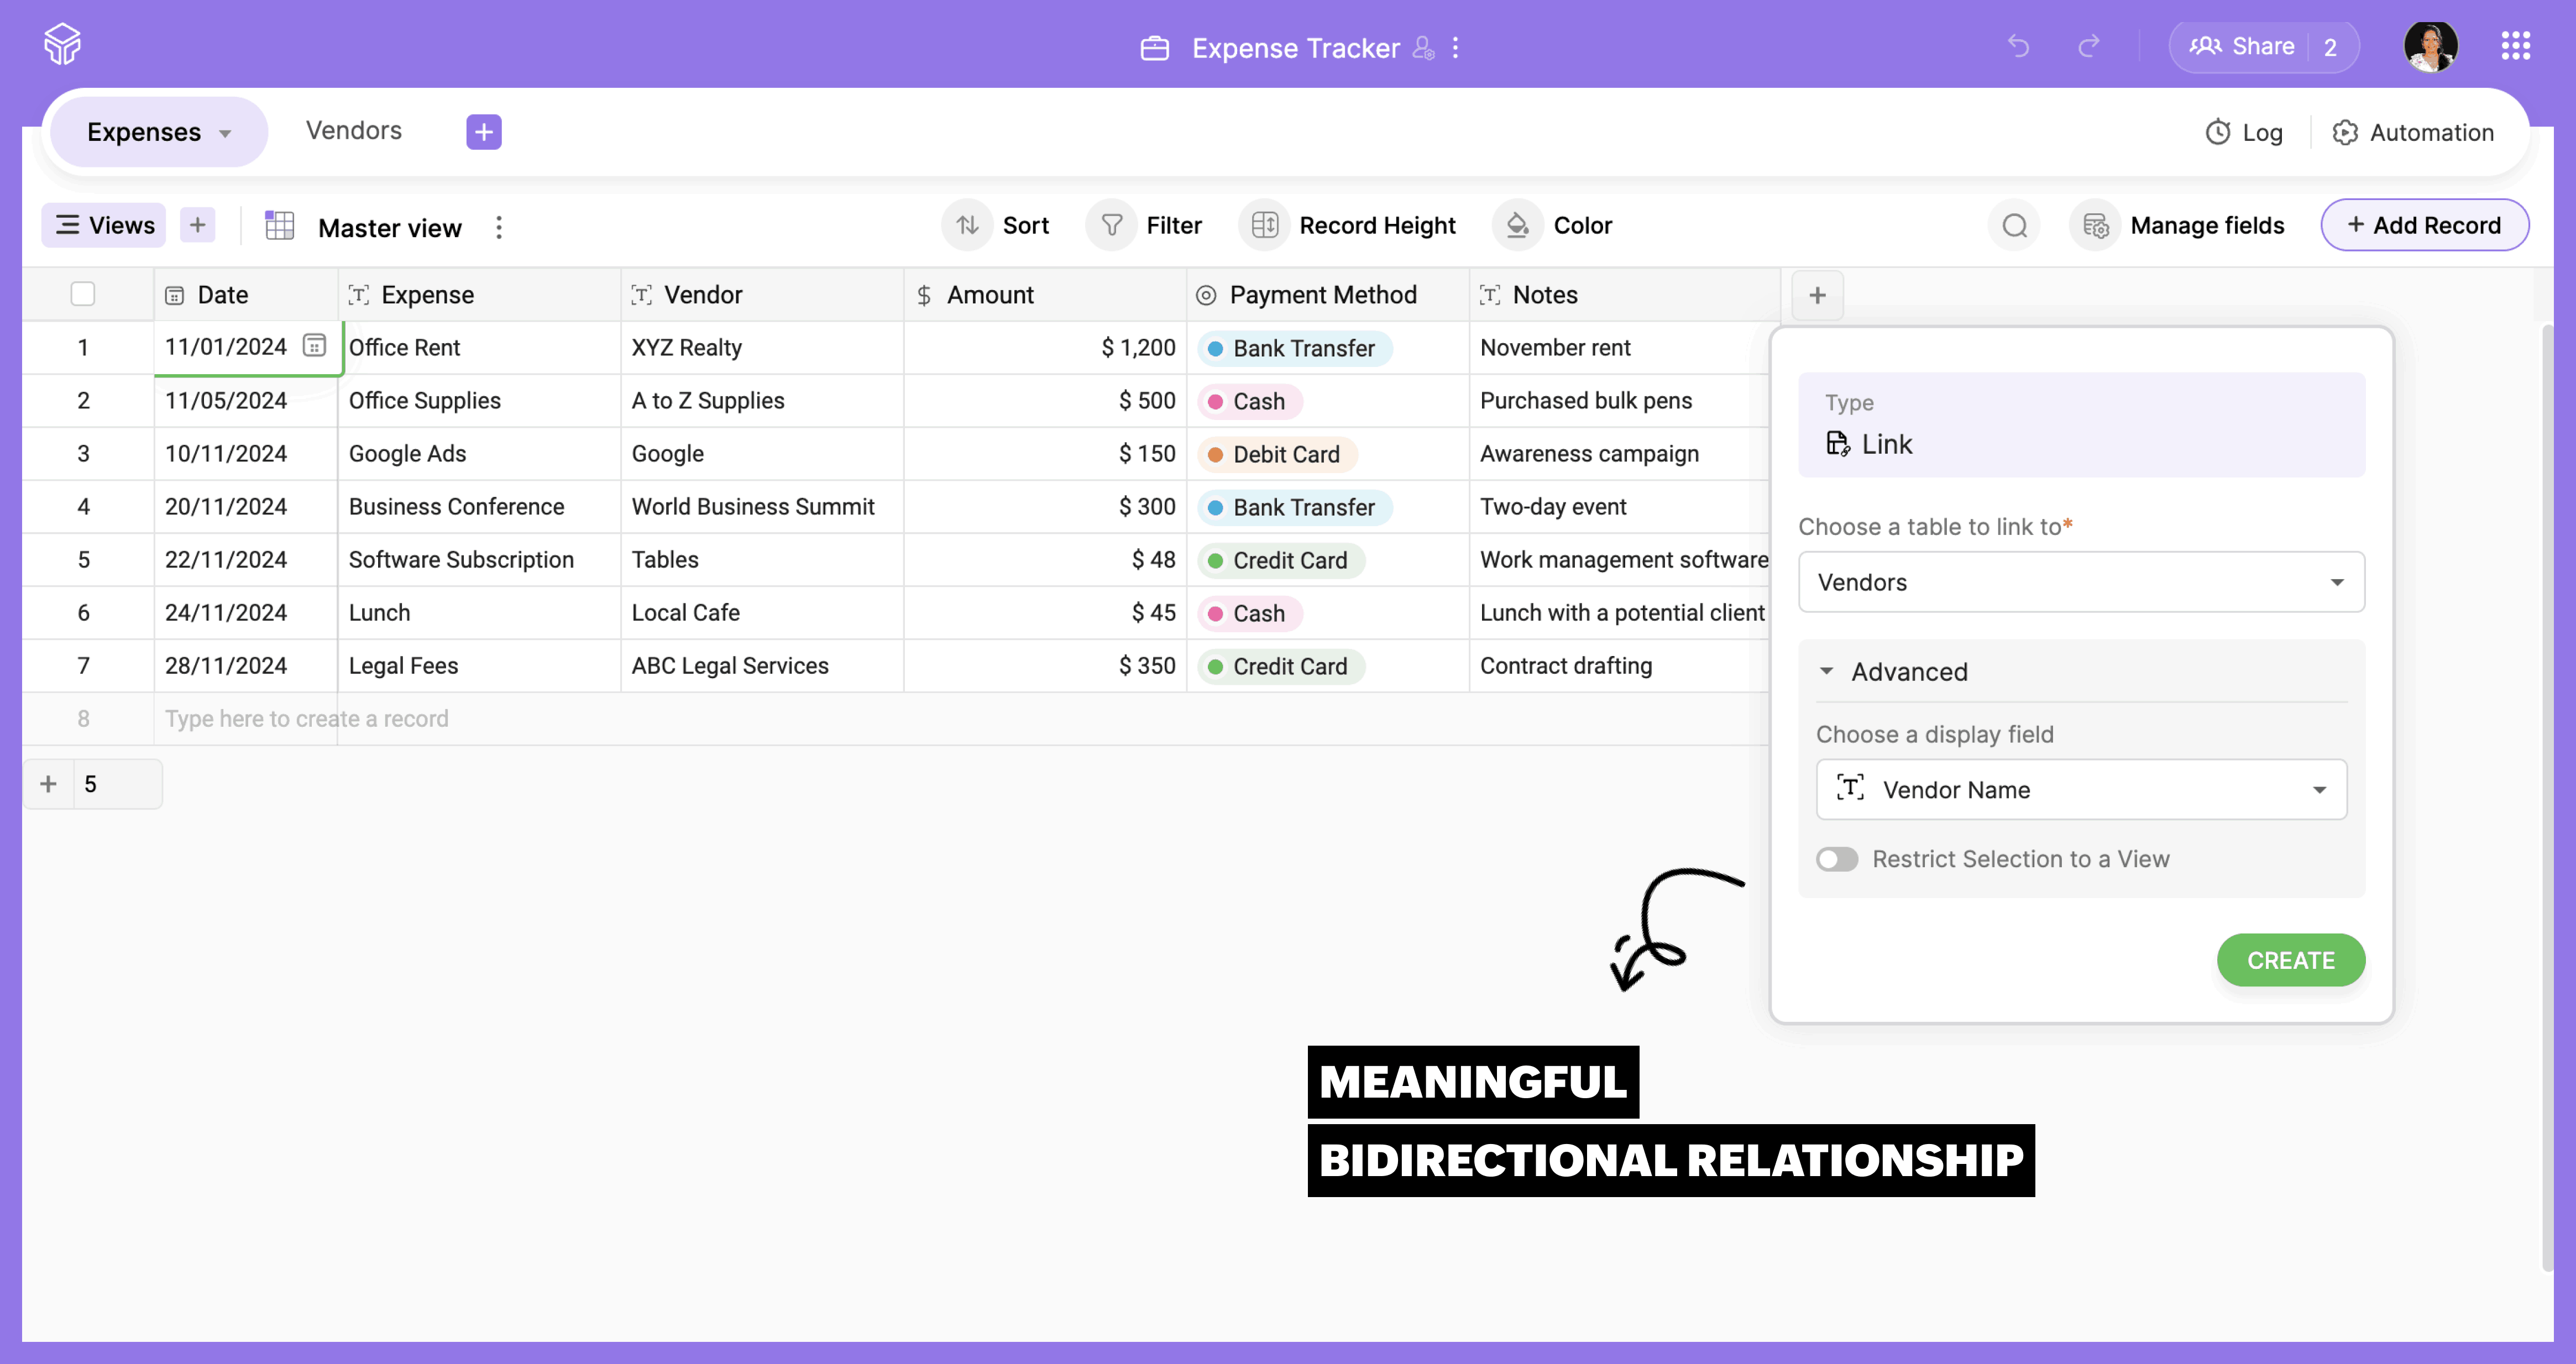
Bi-directional relationship between tables
Zoho Tables has powerful relational database capabilities. It lets you establish links between tables. When you update data in one table, the change reflects on the other table automatically. This prevents data conflicts and duplication. Once you link the tables, you can view the related data to get the context of the record without moving to the other table.

Simple automation
Zoho Tables has built-in automation. Using simple logic, you can set triggers to perform an action when a condition is met. You can automate sending emails, updating records, or deleting records when a condition is met. This eliminates working on repetitive tasks.
Seamless collaboration
Multiple users can work at the same time without data overlaps. They can share files, add comments, update records, and check version history. The admin can give different levels of access to collaborators like a manager, editor, data maintainer, commenter, and viewer. They can either share the entire table or just a view. This prevents unauthorized access and keeps sensitive data safe.
Advanced data visualization
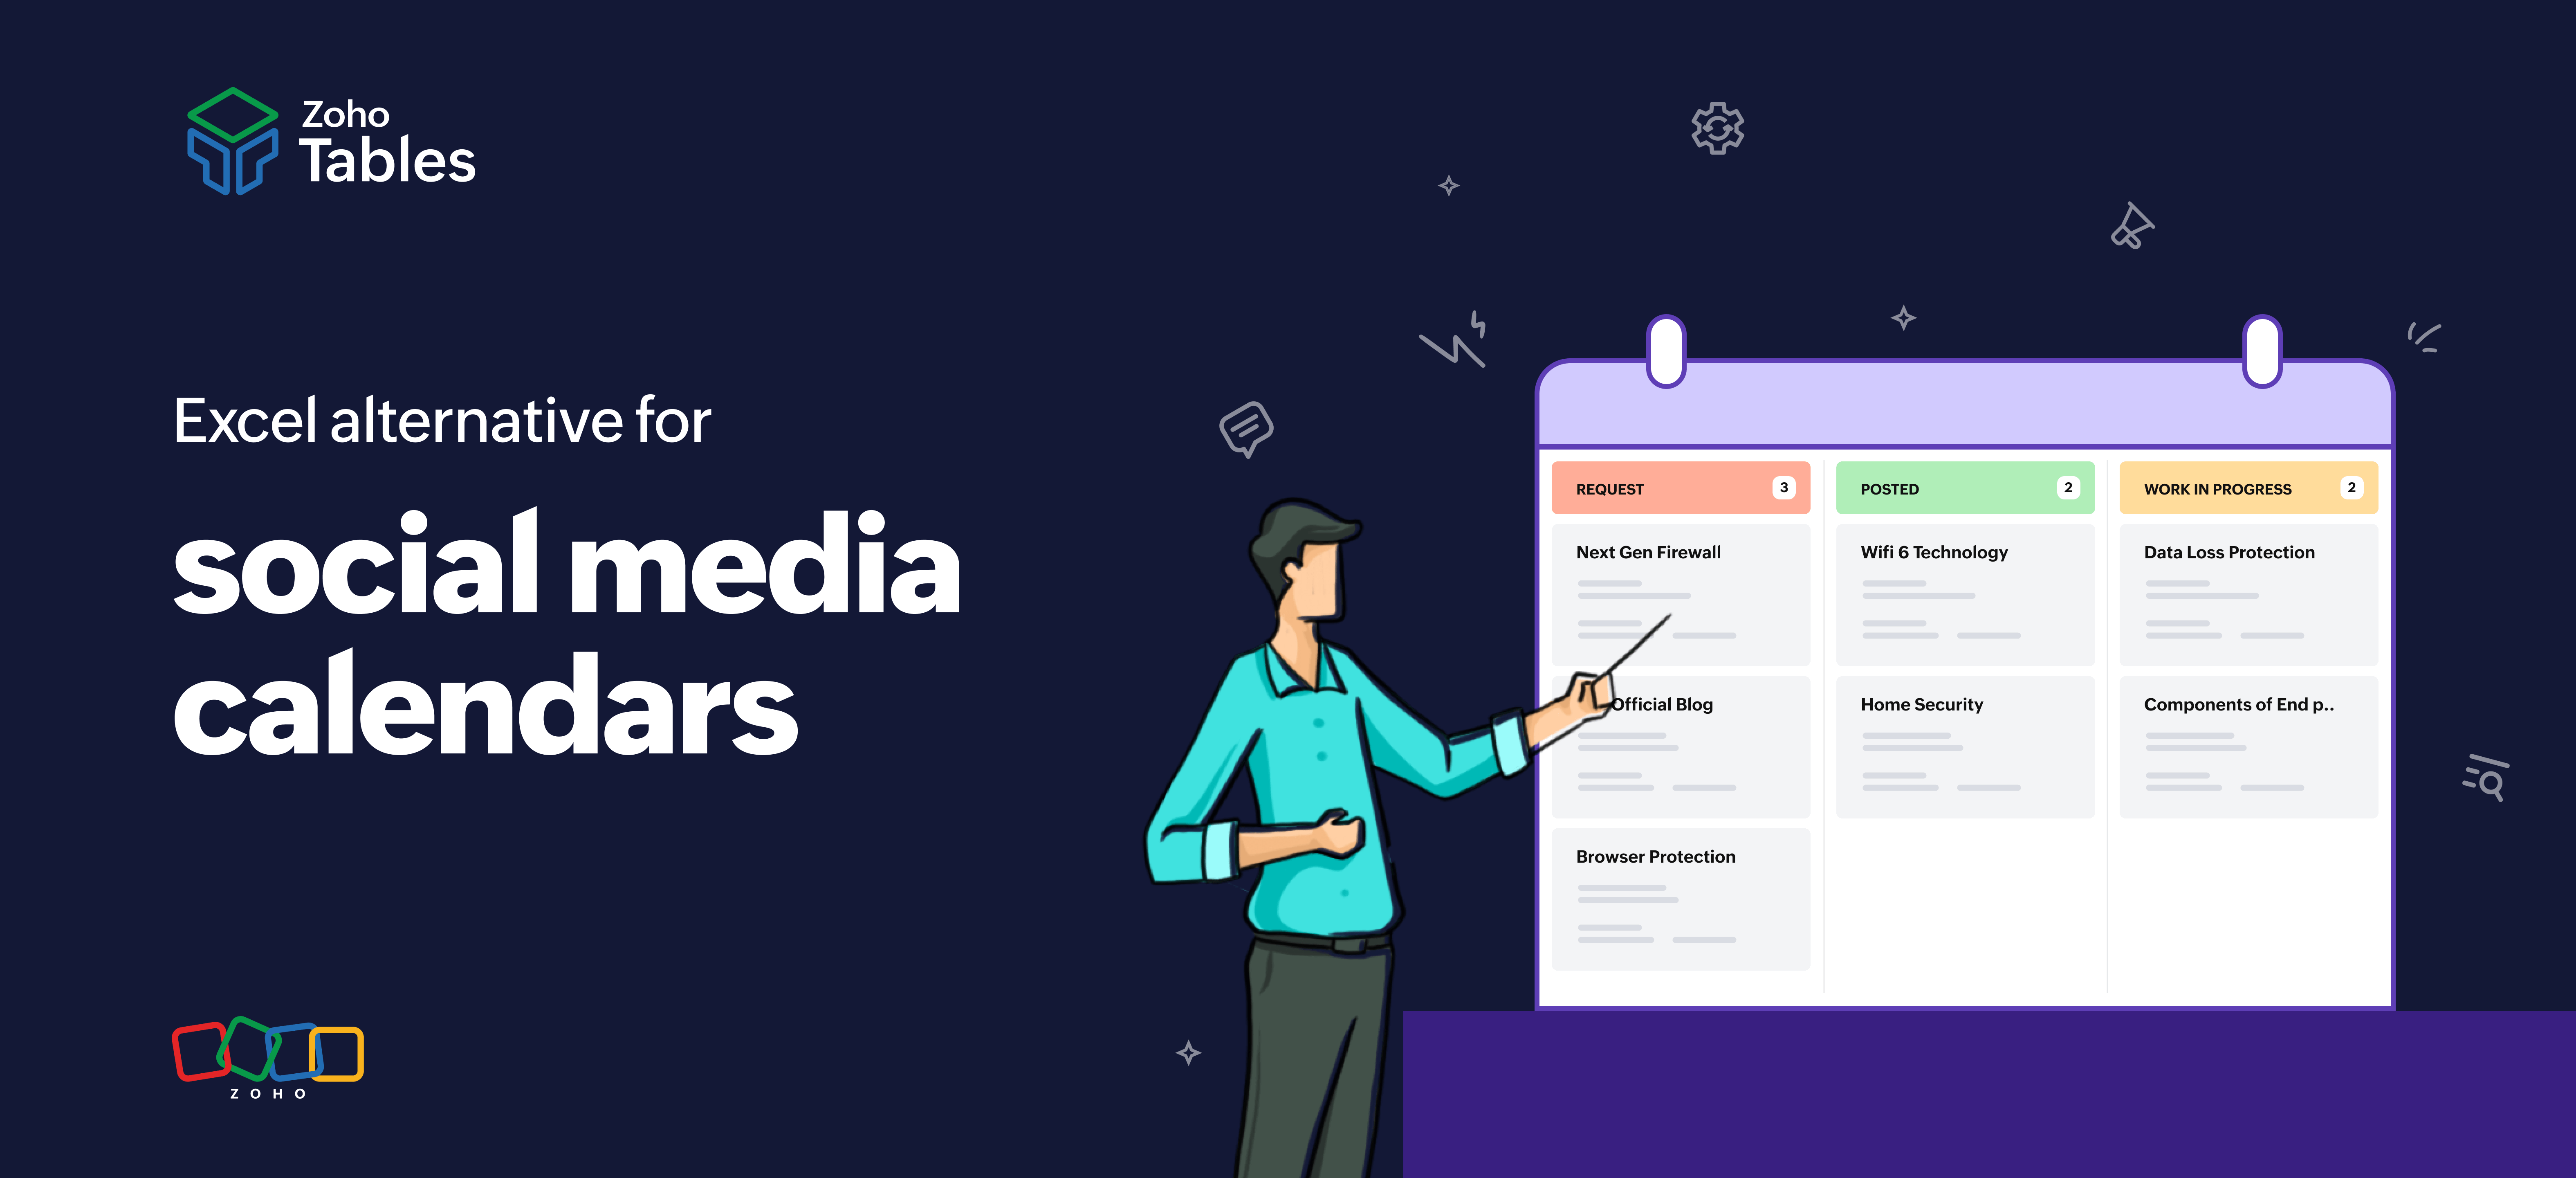
Zoho Tables offers various views, such as a grid, gallery, Kanban, and calendar to visualize data. If you want to see a monthly update of all your payment deadlines, the calendar view will come in handy. Gallery view draws attention to all your attachments like invoices, receipts, bank statements, and the like. You can categorize expenses based on stages like paid, due, and received using Kanban boards. Using forms, you can enter expense data, which will be automatically added to the table. This speeds up data entry and maintains consistency.
Powerful mobile app
With Zoho Tables, you can easily create your own no-code expense tracker right from your phone. When you create an expense tracker table on your phone, you’ll have a fully functional app that includes data organization, automation, and visualization tailored to your needs.
The Zoho Tables app lets you perform all the functions you use on the desktop version. It also has mobile-specific features for iPhone and Android. Using Siri, you can access or create bases using voice commands. The picture-in-picture feature lets you watch video attachments while you use other apps. Using voice notes, you can add data to your records. You can even upload data from physical copies by simply scanning them.
Migrating your data from Excel to Zoho Tables
Having explored the limitations of Excel, consider trying Zoho Tables for a more efficient way to manage your business expenses. If you have existing data on Excel, you can upload them from your local device, cloud storage, or URL to Zoho Tables.
 Archanaa
A fantasy writer who found a home in product marketing.


