The ultimate guide to symbolicating iOS crash reports
- Last Updated : February 6, 2025
- 33 Views
- 5 Min Read
If you've ever been involved in the app development process, you've probably heard iOS developers talking about symbolication, dSYM files, builds, and more. Debugging jargon can appear intimidating, but once you understand it, you'll be debugging apps like a pro.
That's why we created this simple yet comprehensive guide: to demystify iOS jargon and help you master developer lingo, one step at a time.
dSYMs - The what, how, and why
What is a dSYM file?
A dSYM (debug symbol) file is generated along with the executable binary whenever you build an iOS app. It contains the app's debug symbols, which are used for symbolication crash reports.
Why are dSYM files needed?
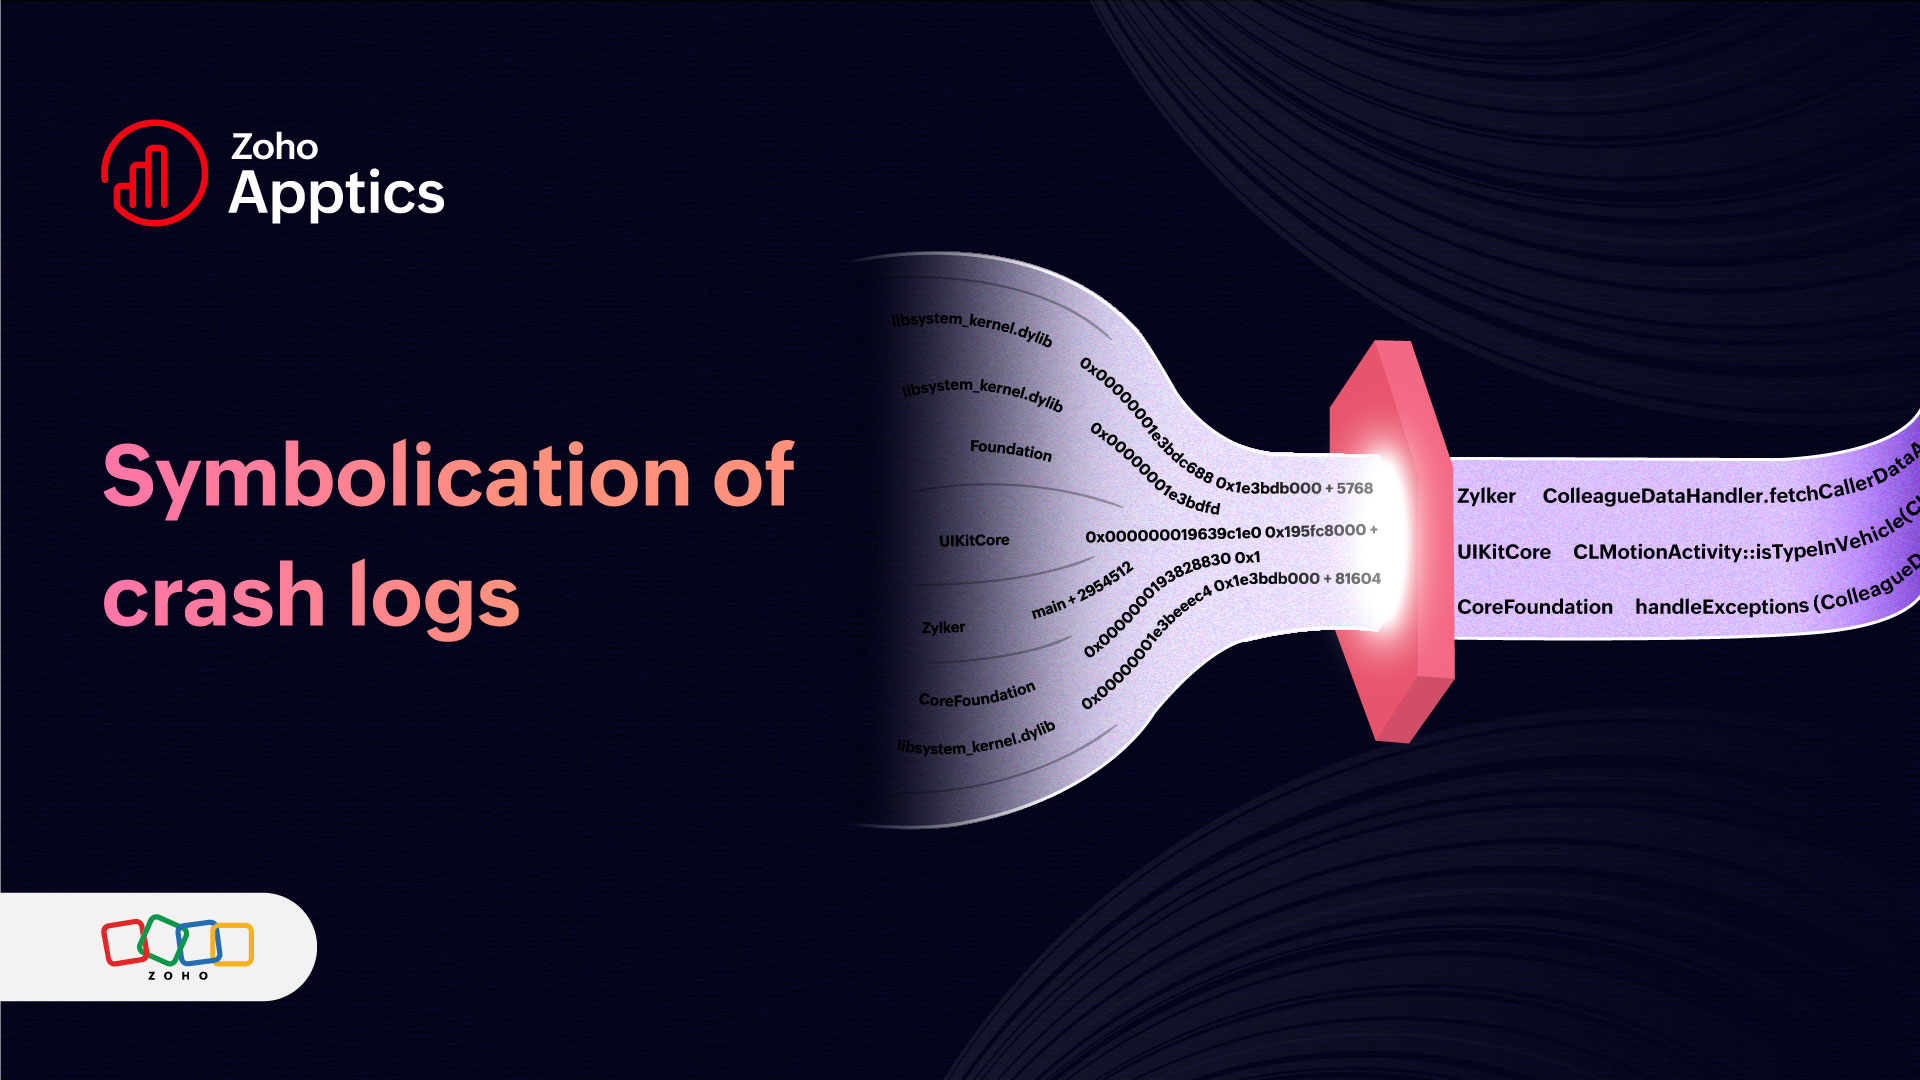
When your app crashes on an Apple device, you need to understand the underlying issue of the crash. The crash reports you receive come with many hidden messages to decode. Without proper symbolication, crash logs are nearly impossible to decipher. That's where dSYM files come to the rescue. They're the secret keys to identifying the root cause of a crash. A dSYM file helps you match pieces of information in the crash report to the exact code lines and functions in your app's source code. This is called crash symbolication.
Crash symbolication
Crash reports or crash logs show the memory address of the error, not its actual location in the source code. This happens because, when an app is compiled for release in Xcode, the build system does something called as debug symbols stripping (when the option to "Strip debug symbols" is set to Yes in Xcode build settings). This process removes the debug symbols that contain the source code information. The striped debug symbols are saved in a separate dSYM file that we discussed earlier.
Crash symbolication is the process of using dSYM files to map machine-readable instructions and memory addresses specified in crash reports to the corresponding code lines and function names in the actual source code of your app.
UUID: The unique identifier
Every time an app is compiled in Xcode, a new build and corresponding dSYM file are generated. The new build is linked to the dSYM file with a unique identifier called the build UUID. Build UUIDs are generated by Xcode for each build version. This means that the set of files and components you need to troubleshoot issues and debug crashes are different for every build. So even if the bundle ID, version, and build number remain the same, the dSYM file of one build cannot be used for another build’s crashes.
Here's where archiving builds in Xcode and preserving the archives becomes important.
Build archives
When you archive a build in Xcode, a build archive is created that contains all the app-related files and components (like app binary, resources, and metadata) necessary for deploying your app. It also includes all the corresponding dSYM files for every major, minor, and patch version you upload to the App Store.
Using the build archive, you can create an .IPA file to install the app on individual test devices through MDM (Mobile Device Management) tools or TestFlight. You can use it to run the app for testing purposes and simulate bugs for debugging during the development and testing phase.
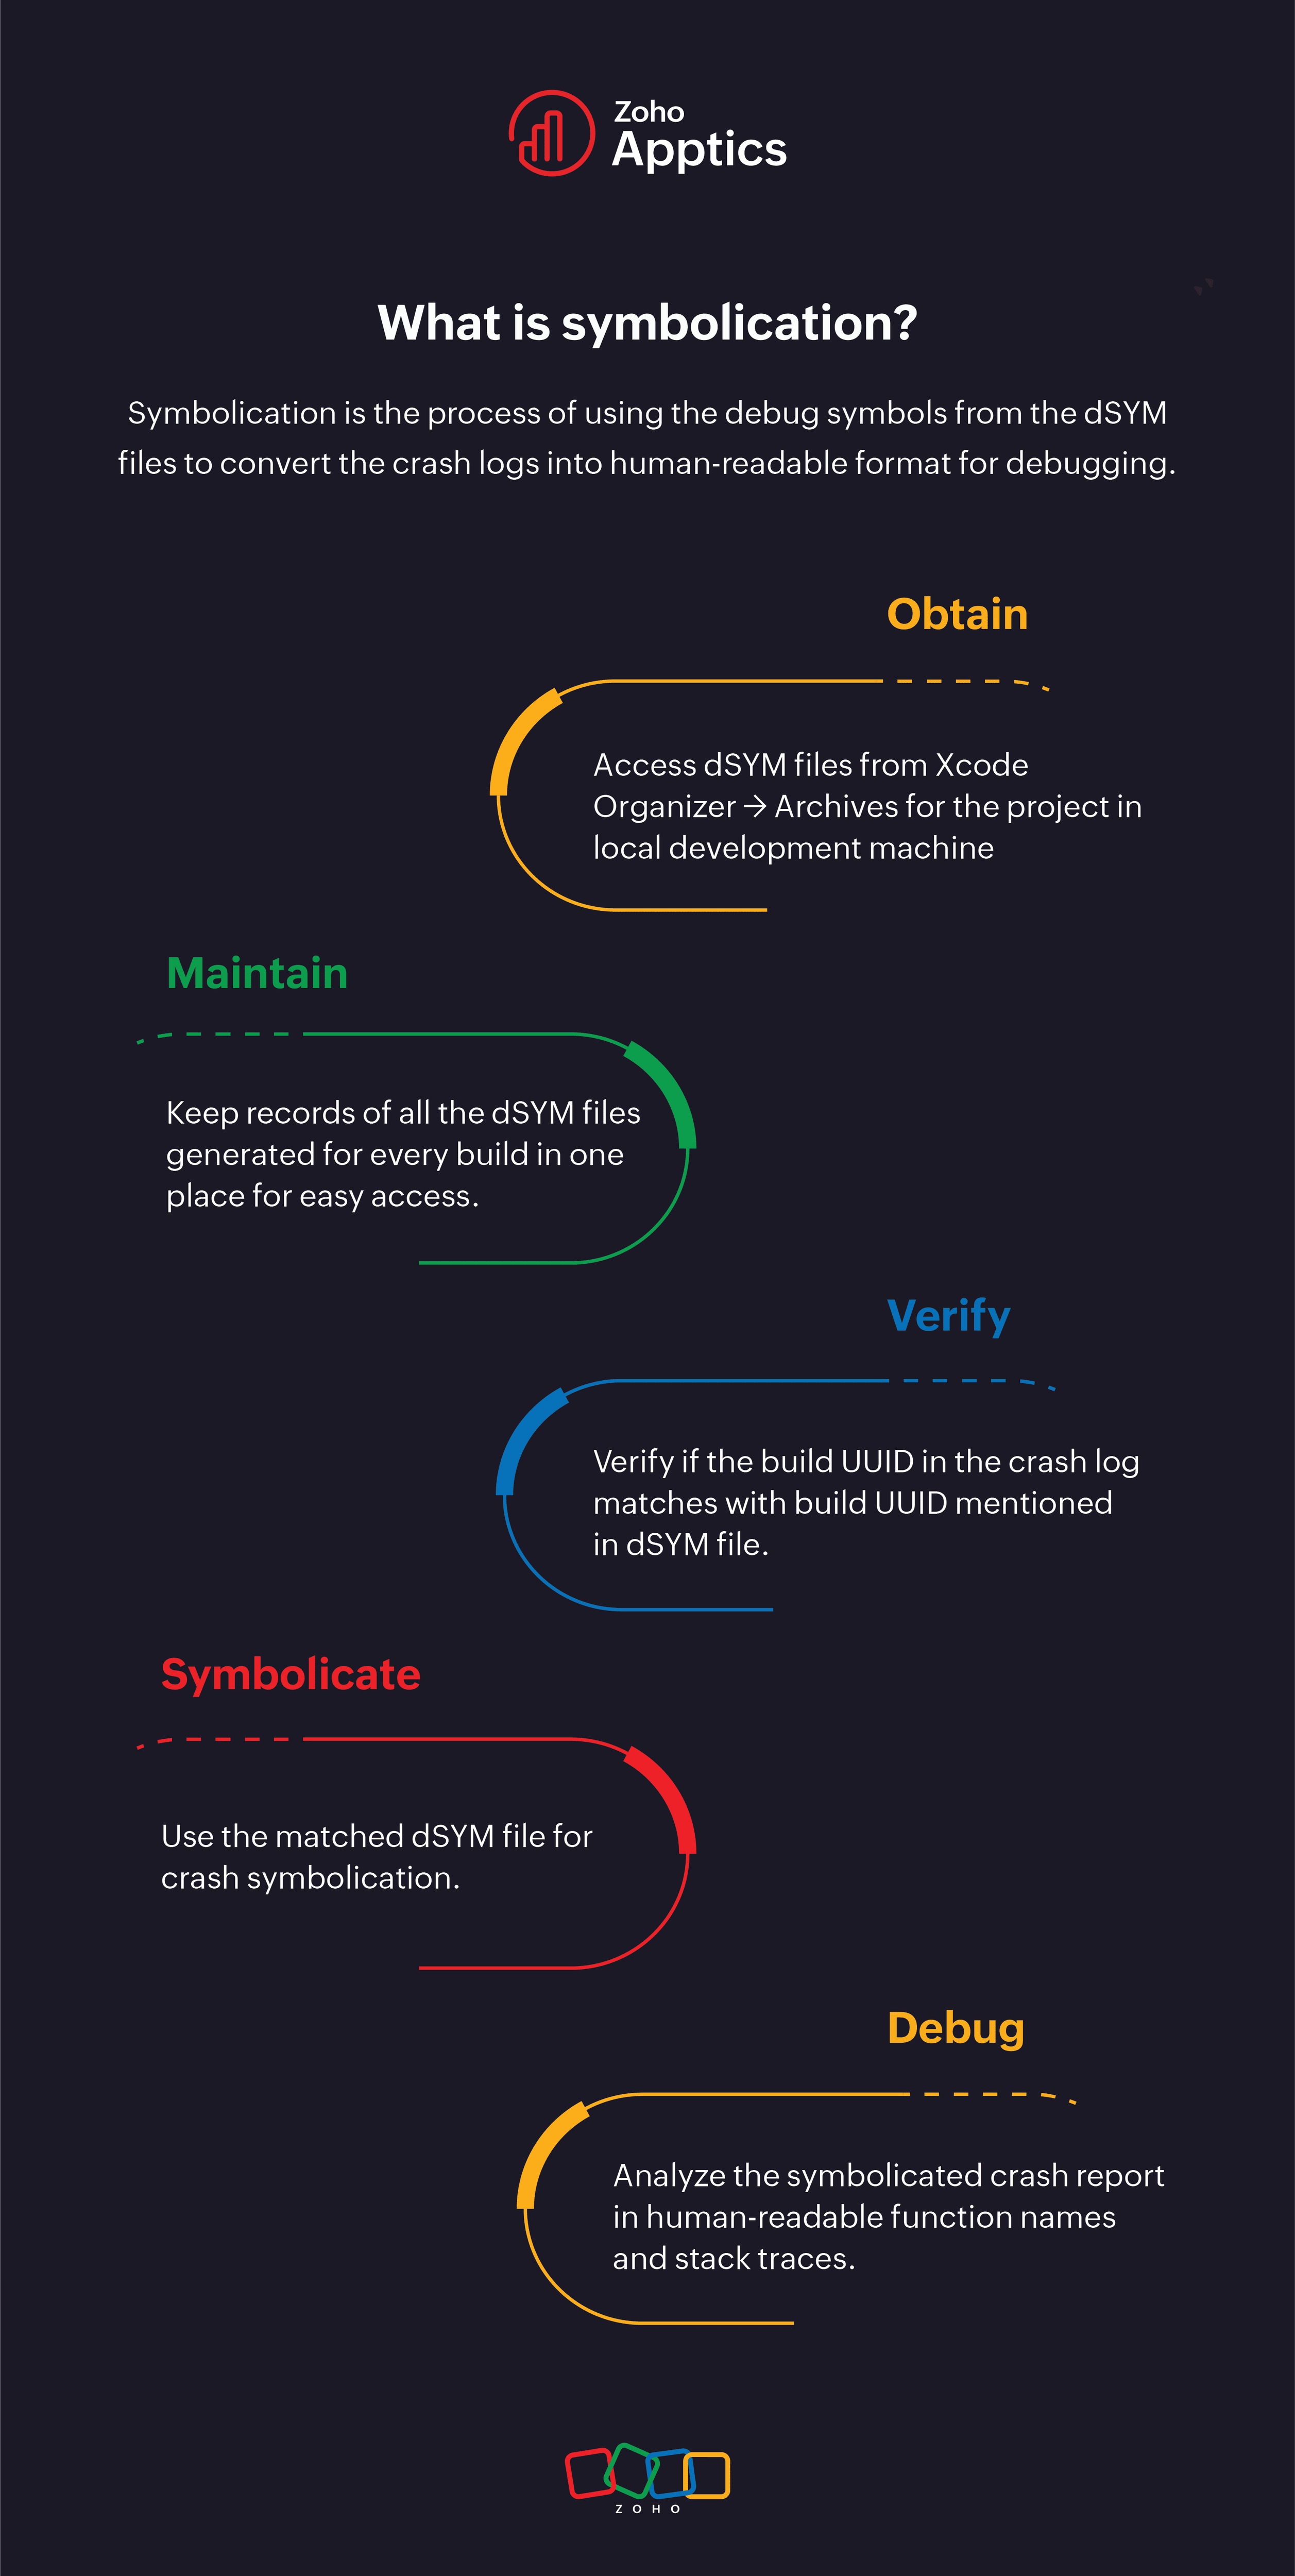
Now that we've armed ourselves with the fundamentals, let's take a look at some best practices that you can follow to ensure proper crash symbolication and effortless debugging.
Best practices
Maintain proper records of dSYM files
When there are mismatched or incorrect dSYM files, crash logs remain unsymbolicated. It's crucial to maintain proper records to ensure compatibility. In other words, the UUID of the app build should match the UUID of the dSYM file.
You can check the build log in Xcode for the build UUID. It will be listed next to the dSYM file path. Later, you can use the dwarfdump command line method to get the dSYM file's UUID and verify that both UUIDs match. However, this method can be time-consuming and complicated.
Tools like Zoho Apptics can simplify and streamline this work for you. You can upload dSYM files automatically, maintain up-to-date records, add any missing files, and analyze fully symbolicated crash reports, all from the Apptics console.
Match dSYM files with the corresponding final release
There may be instances where you run multiple builds for your app in release configuration, such as for testing purposes. If you use Zoho Apptics, all the dSYM files will automatically be uploaded to the Apptics web console.
In these cases, you will have more than one dSYM file generated for the same build, creating confusion on which dSYM file to use to symbolicate crash reports.
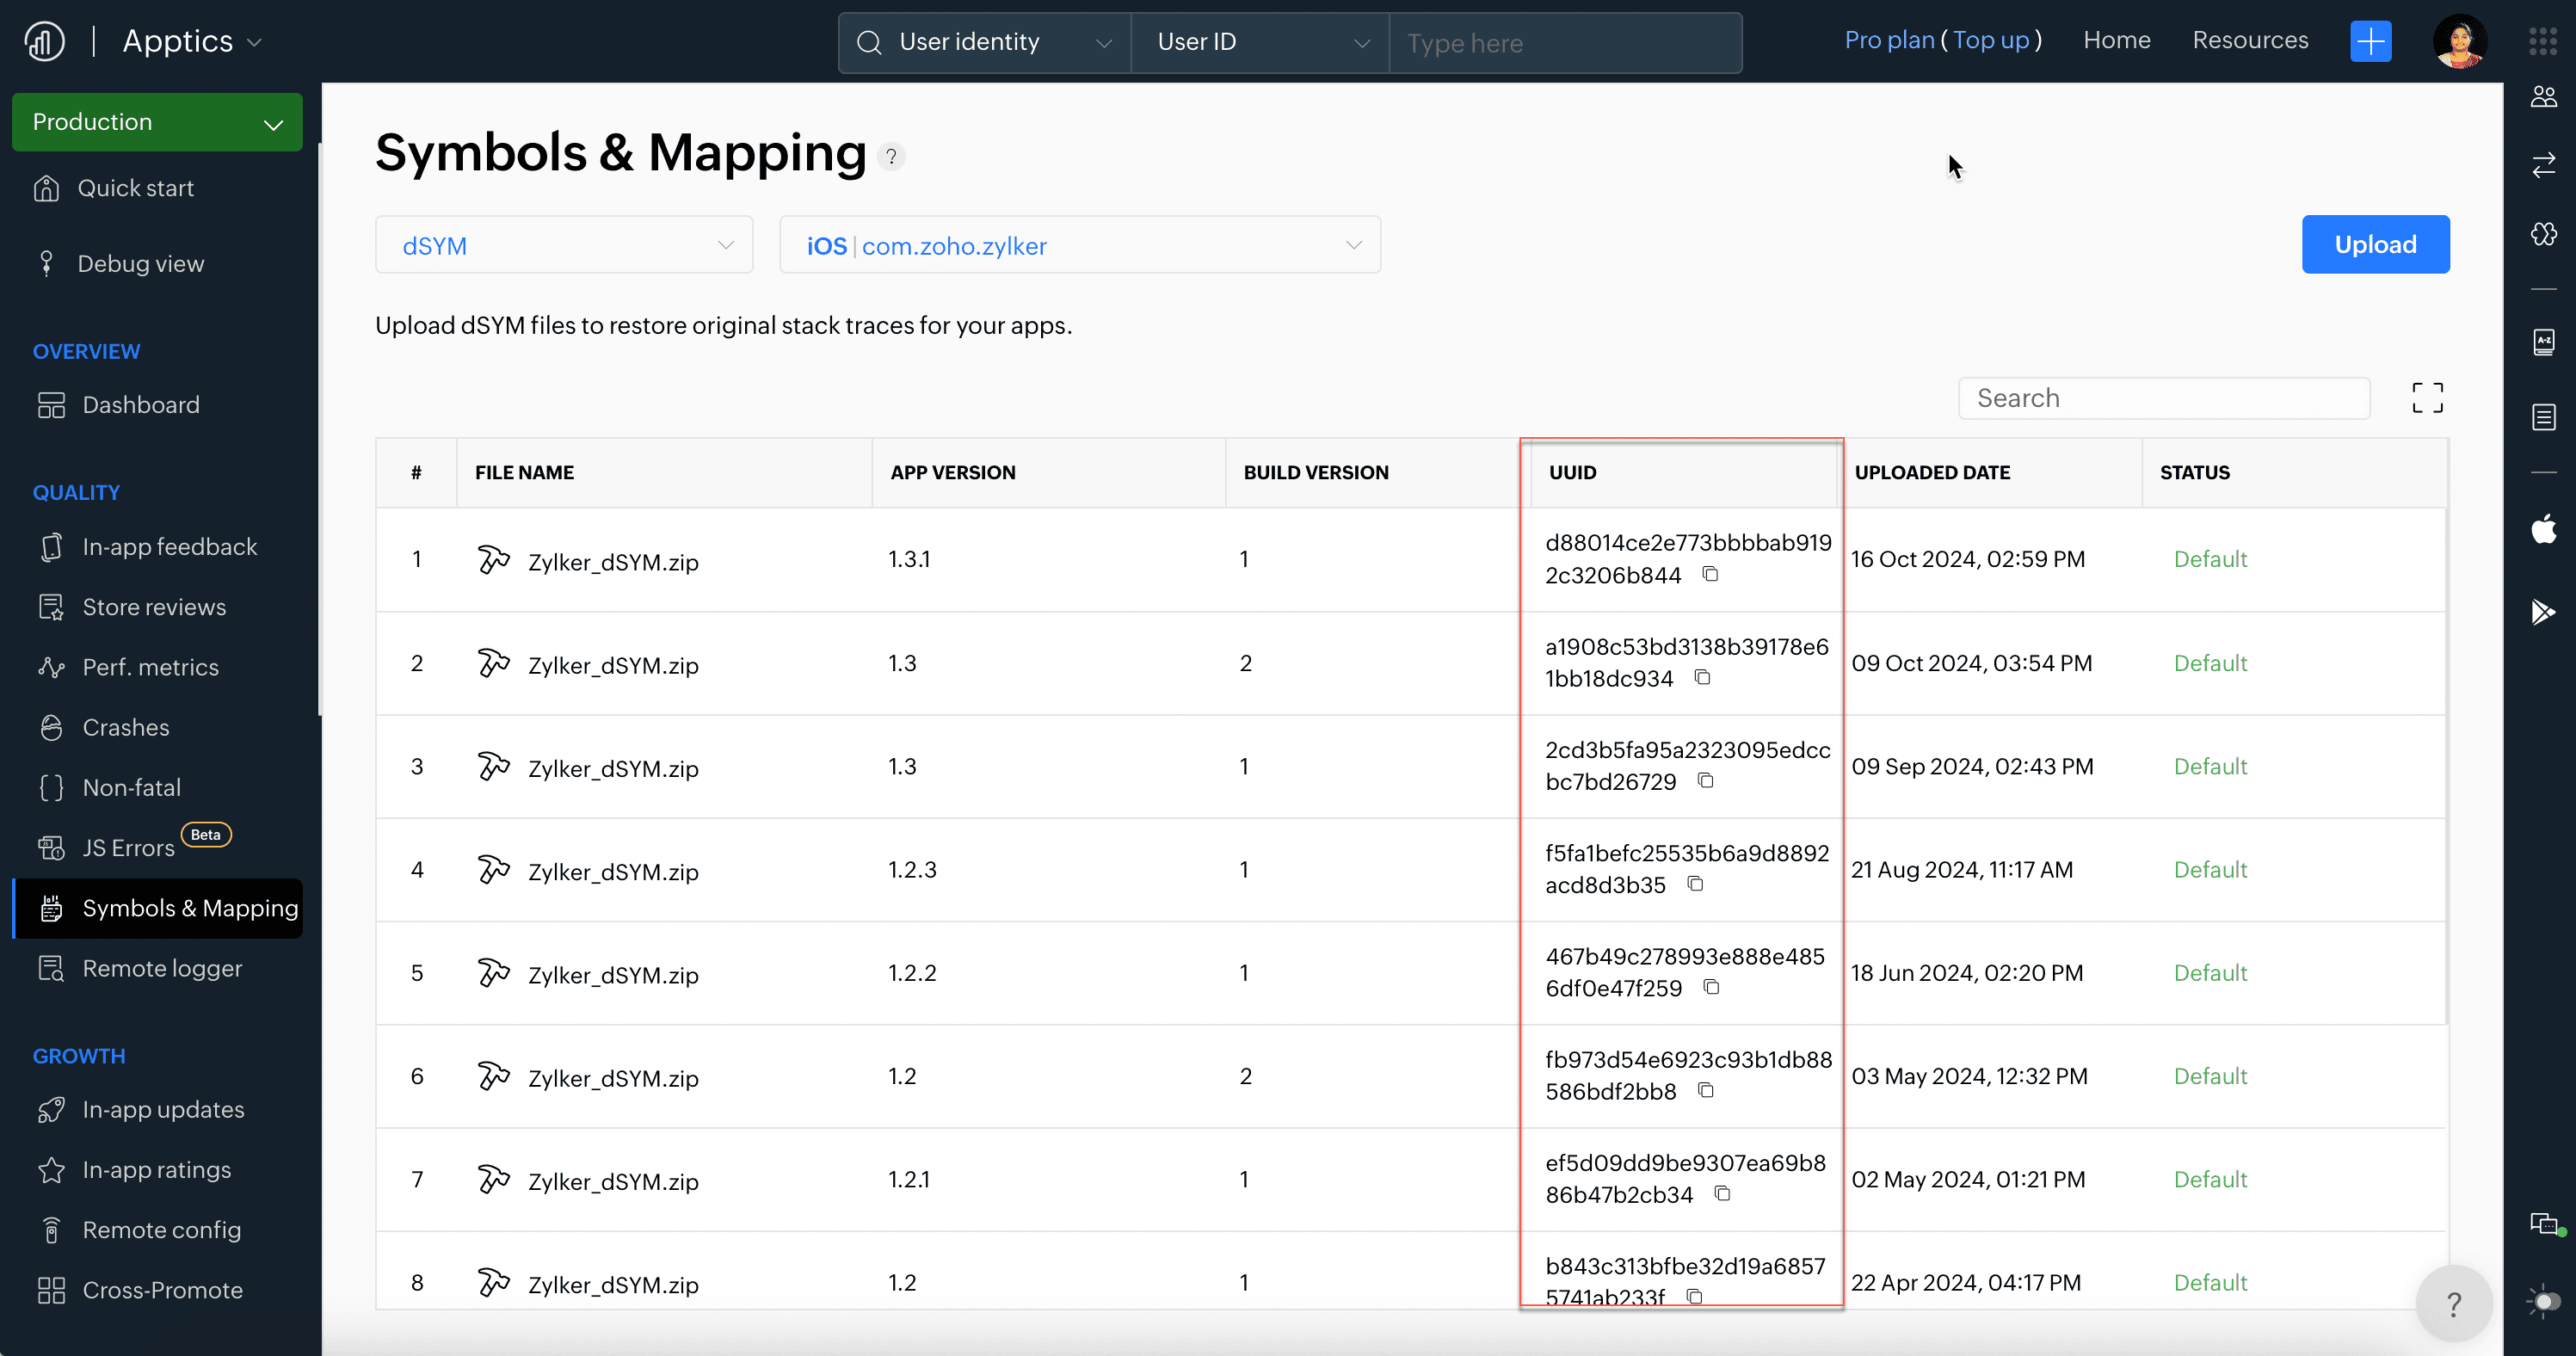
To avoid this confusion, ensure that you upload and use only the dSYM file that matches the final release build. If all your dSYM files are automatically uploaded in Zoho Apptics, manually upload the correct one, match it with the corresponding build version, and set it as the default file in Apptics's Symbols & Mapping page.
Verify dSYM files while debugging crashes in Apptics
At times, symbolicated crash logs have incomplete information. This happens when you're using an incorrect dSYM file.
When you encounter an unsymbolicated crash or partially symbolicated crash logs, follow the troubleshooting steps shared below to preserve the necessary files:
- From the crash report details page, and click on Symbolicate. If you still face the issue, copy the UUID that's listed.
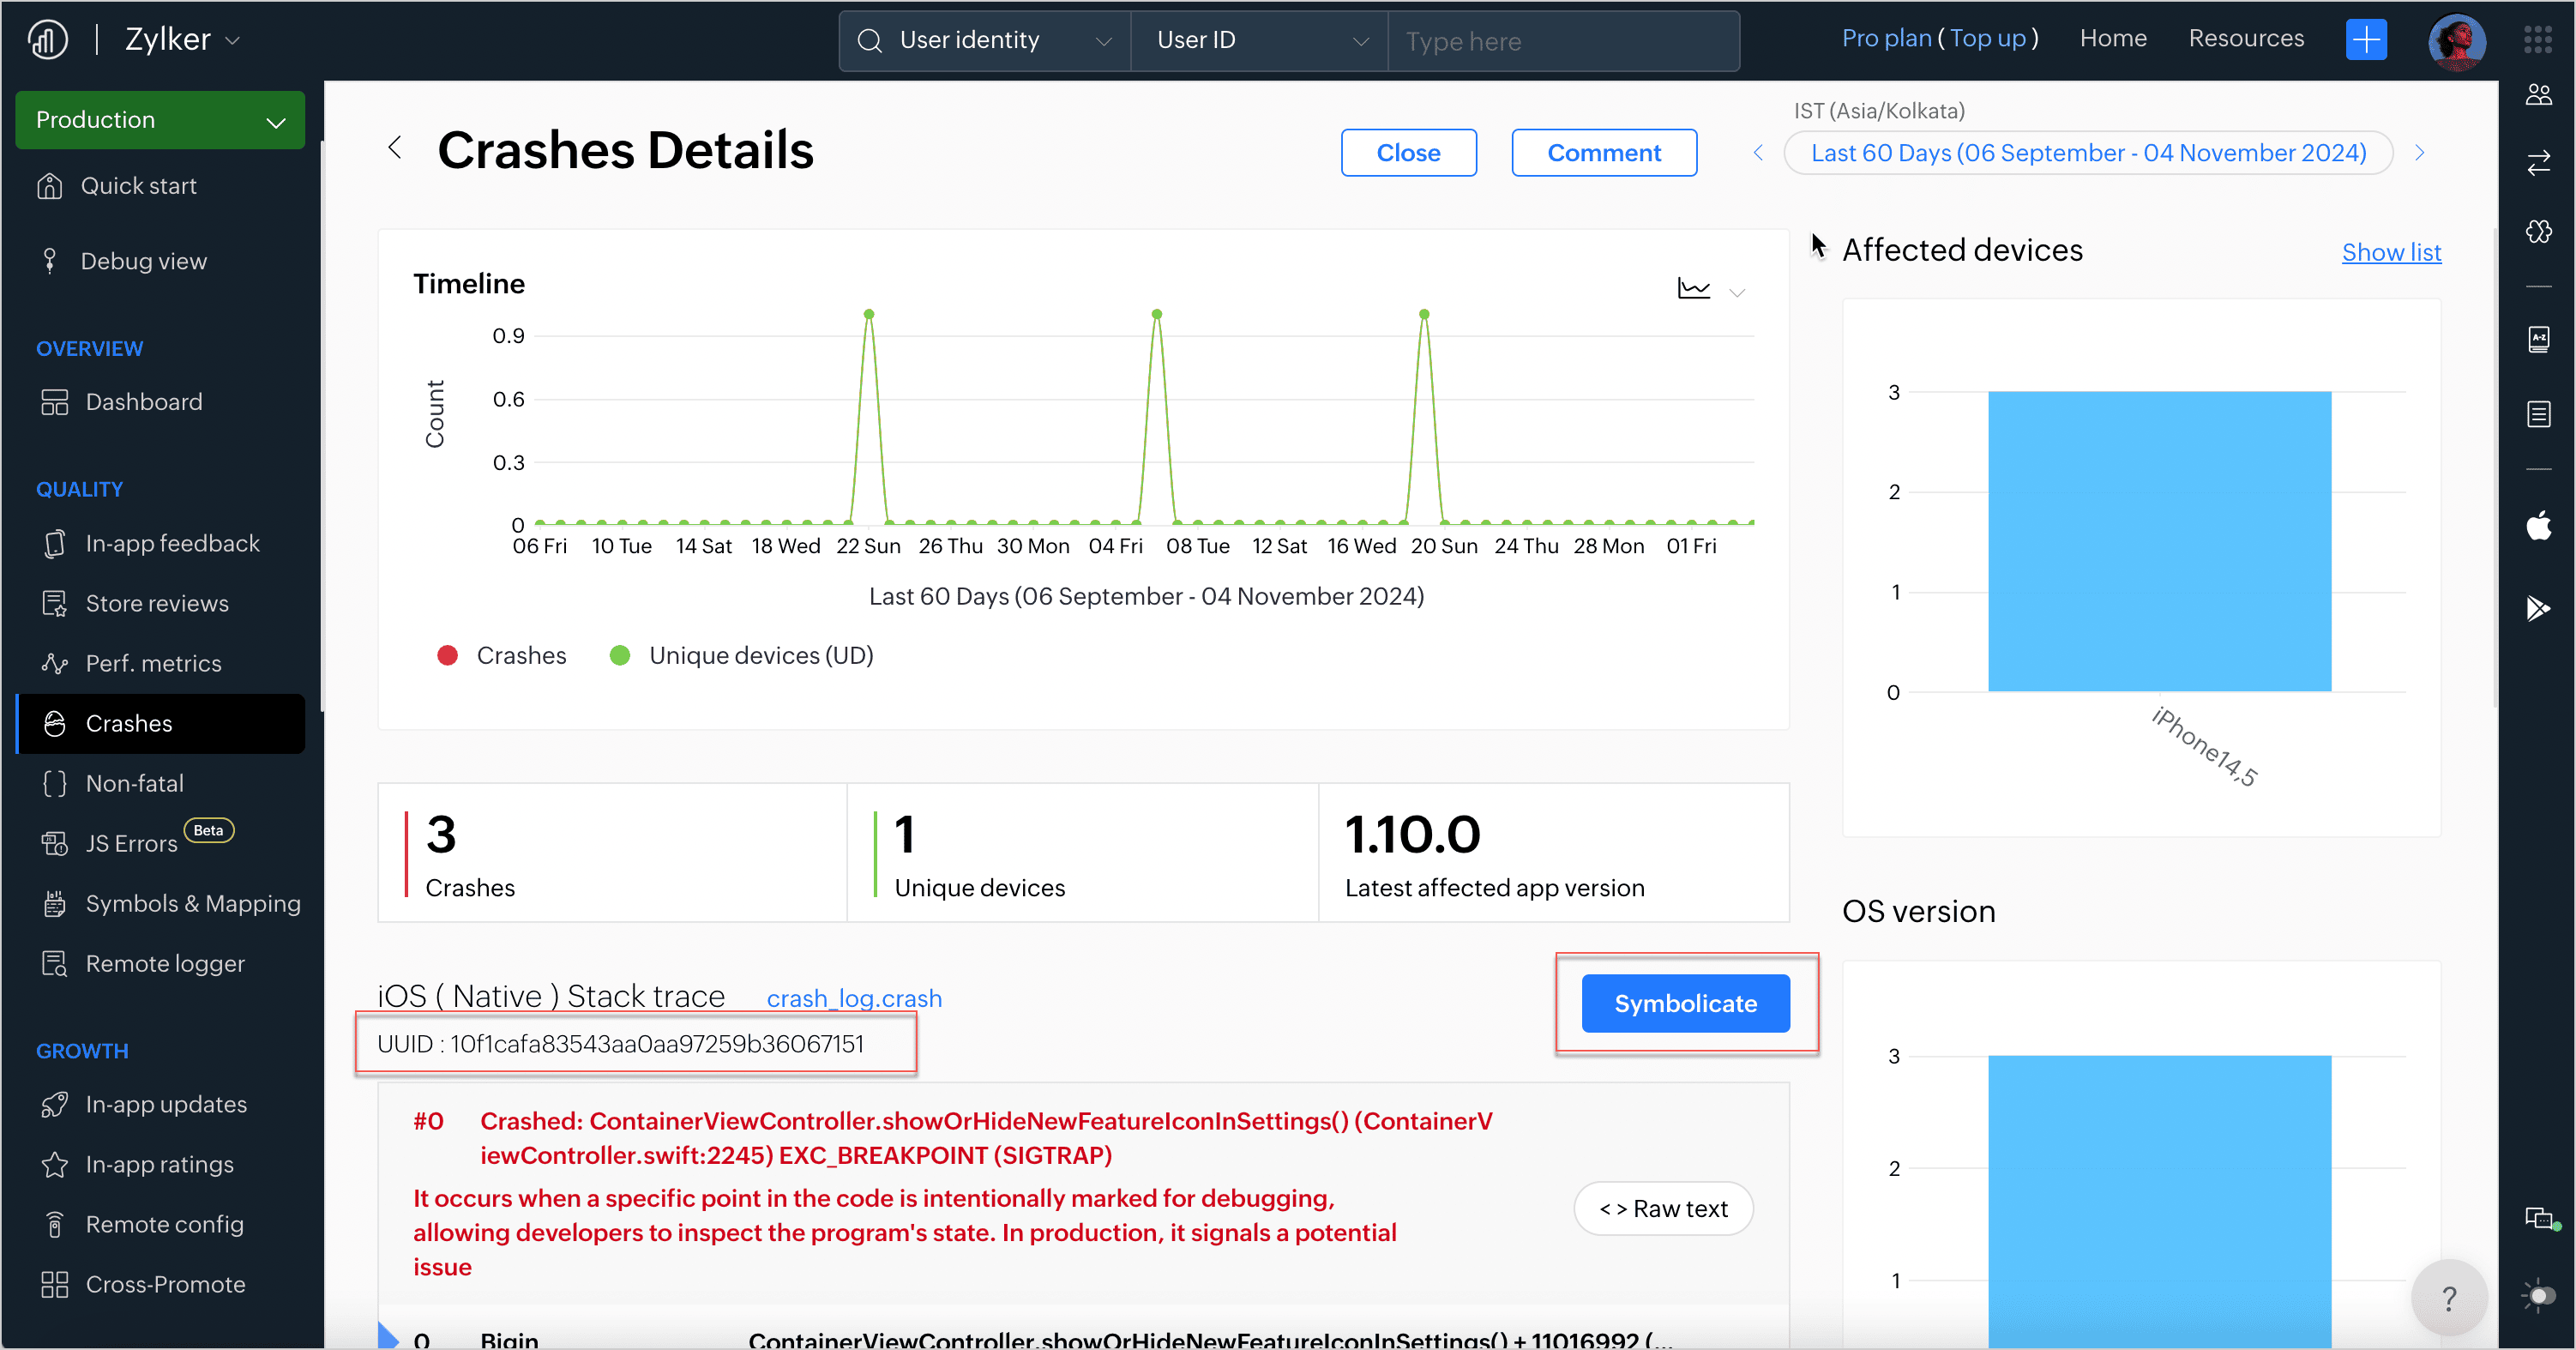
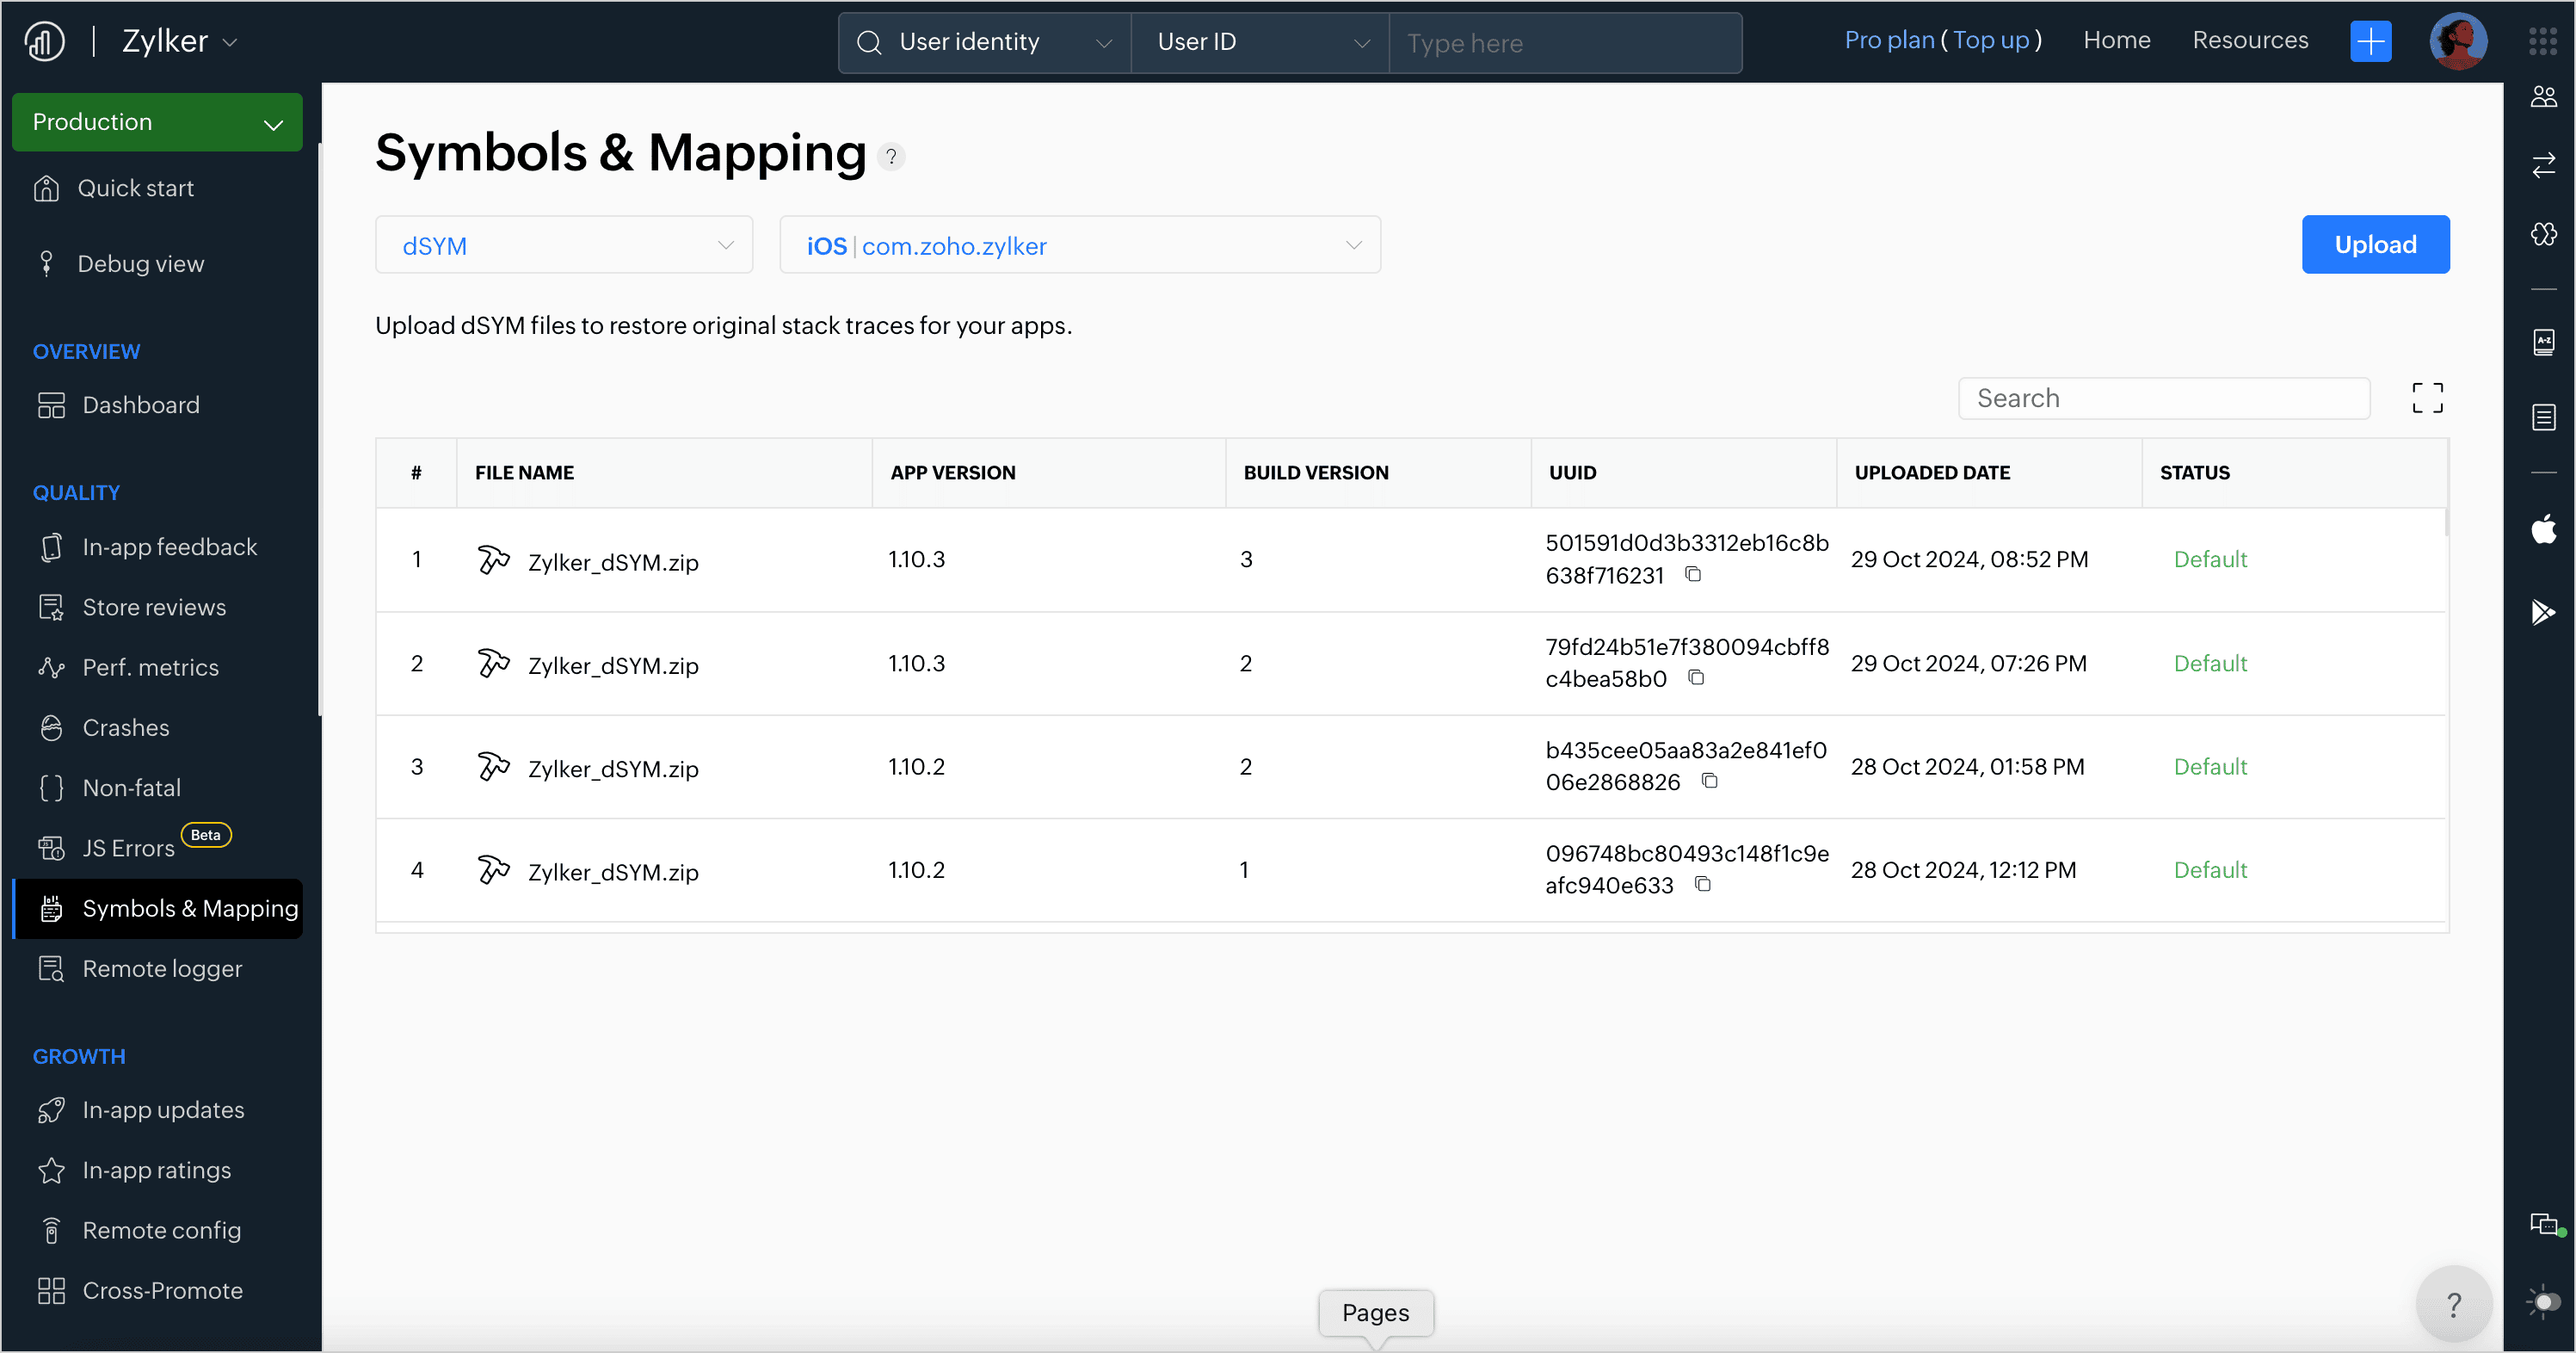
- Go to the Symbols & Mapping page in the left menu.
- Select the iOS app's bundle ID that matches the crash report.
- Paste the copied UUID into the search bar. If you are not able to find any dSYM file for the UUID, that means that the dSYM file is missing and you need to upload it manually.
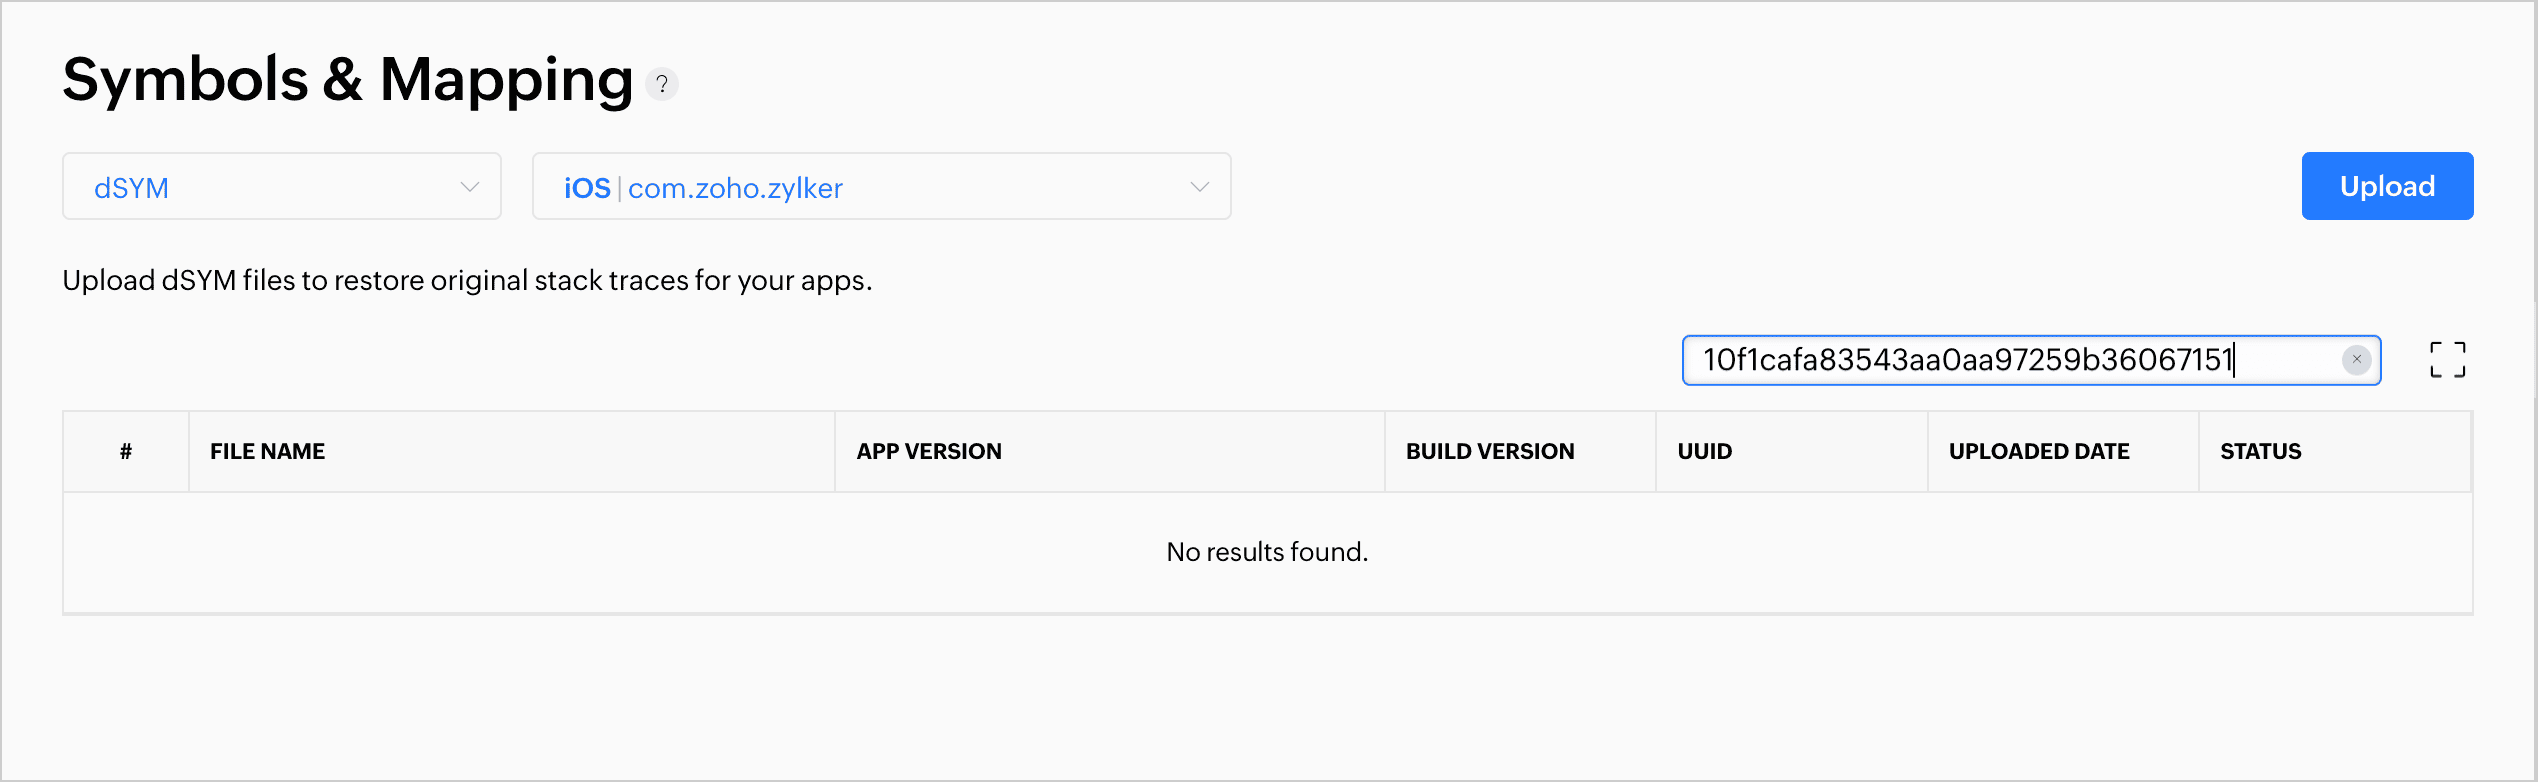
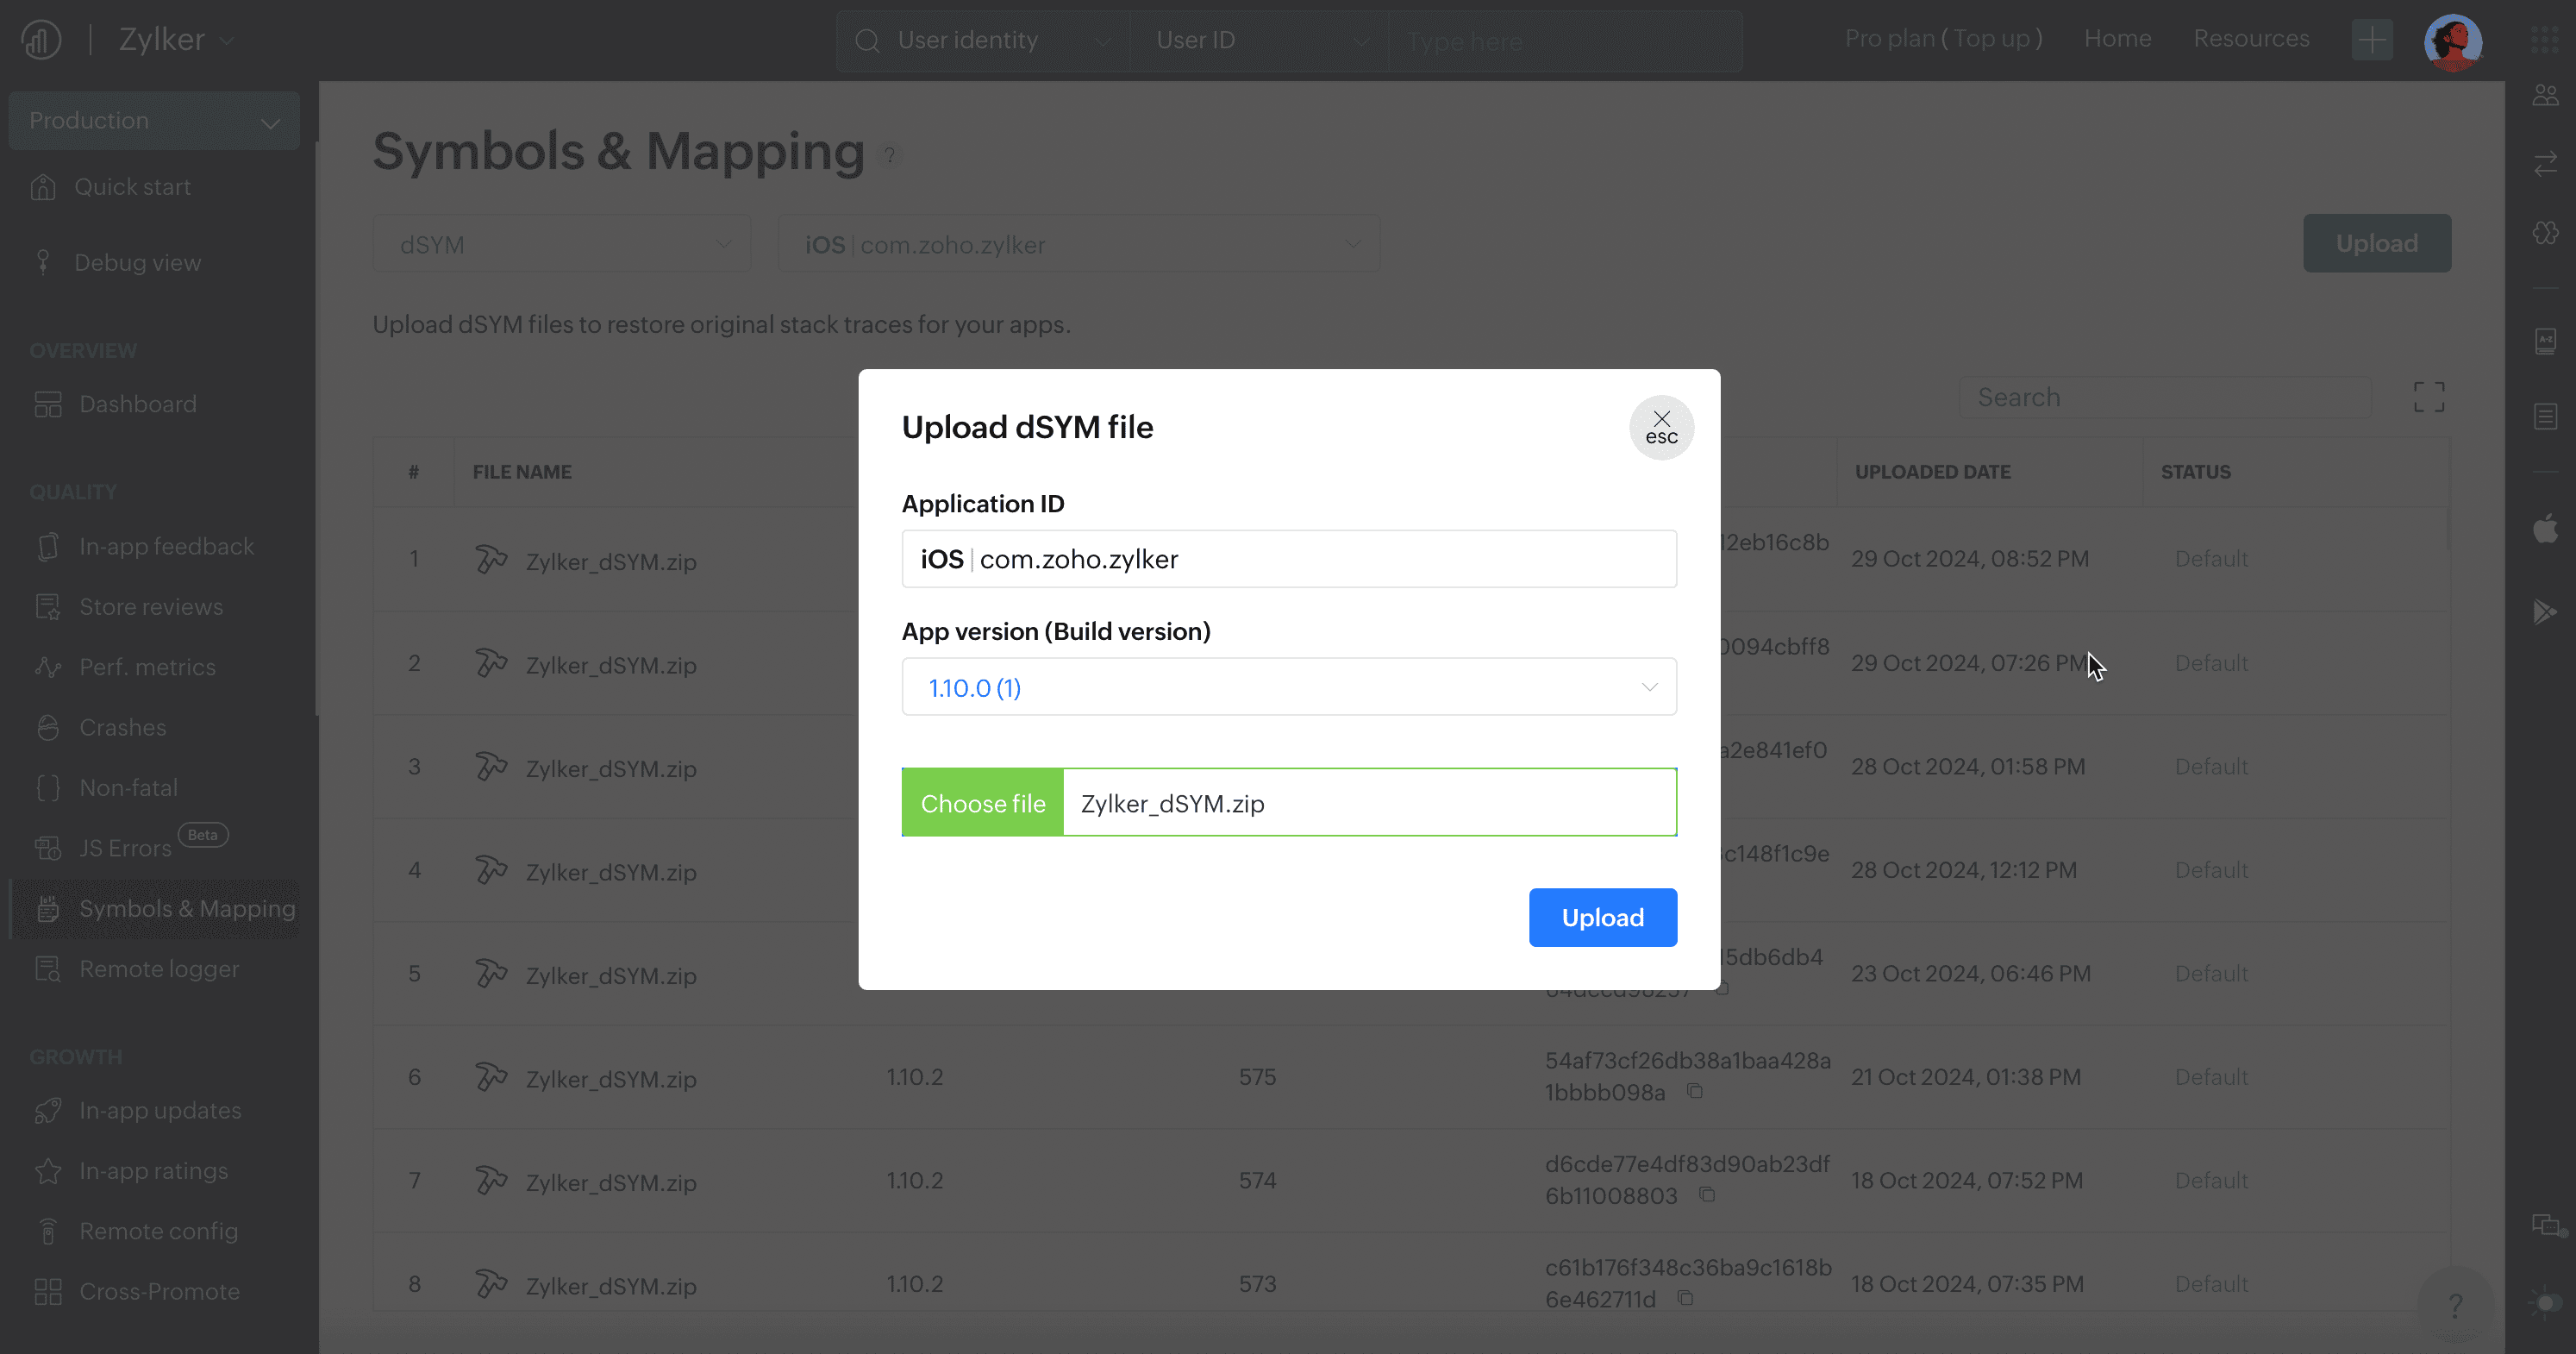
- Upload the correct dSYM file that matches the build UUID.
- Now if you search again to verify if the dSYM file you have uploaded matched the build UUID.
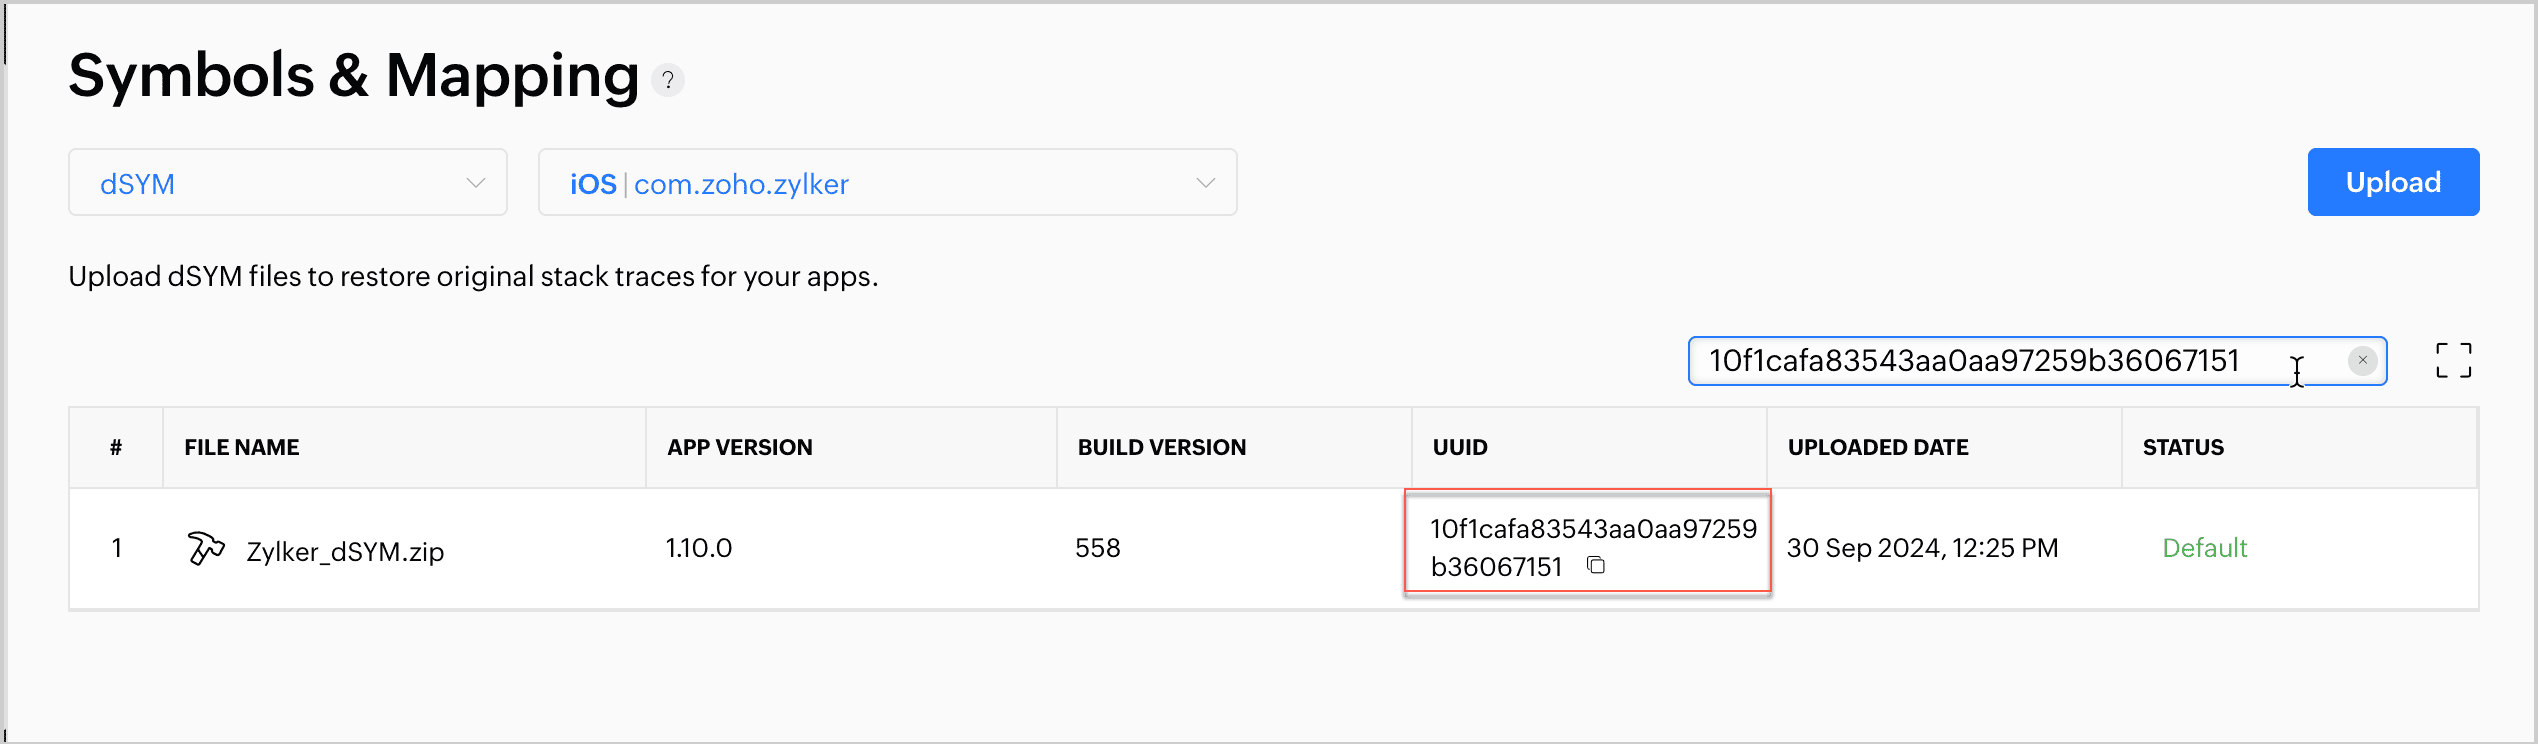
Once the dSYM file shown matches the UUID for the version and build number, you're good to go! You can now view properly symbolicated crash reports and complete information in the Apptics console.
While we have explored some best practices for the proper symbolication of crashes, there may be unique scenarios that result in incomplete crash reports. We cover more case-specific troubleshooting steps in our symbolication guide and iOS troubleshooting guide.
Effortless debugging with Zoho Apptics
Similar to dSYM file management for Apple apps, the Symbols & Mapping page in the Apptics console helps you manage Android ProGuard mapping files, React Native source map files, and Flutter mapping files to ensure proper symbolication of crash reports.
With Apptics's real-time crash reporting, you can:
- Receive instant crash reports that capture stack trace details.
- Download and access symbolicated crash logs.
- Get raw text for multiple threads (execution paths) in a stack trace.
- Look into individual crash instances and crash-device timelines across affected devices.
- Look through diagnostic information, like the crash environment, custom properties, and traces of events, APIs, and screens that were triggered when the crash happened.
Apart from crash symbolication and diagnosis, Apptics offers many other features—like feedback and bug reporting, remote application logging, and more—that help you accelerate the process of crash debugging and allow in-depth, accurate diagnoses of issues to provide a smooth and crash-free experience.