How to use spreadsheets for data analysis
- Last Updated : May 21, 2024
- 2.4K Views
- 3 Min Read

Spreadsheets are incredibly versatile tools that can be used for a range of functions. From small businesses keeping track of orders to individuals managing personal expenses or weekly itineraries, spreadsheets are helpful for anyone that needs to use and manage data. However, they can be used as much more than a database. Spreadsheets can also be used as a powerful data analysis tool.
In this blog article, we'll share some common ways to derive valuable insights from your spreadsheets and explain how they compare to dedicated data analysis tools.
Clean, well-formatted data
One of the fundamental rules of data analysis is that the accuracy of your insights is directly related to how precise your data is. Before analysing your data, it is essential to ensure that it is properly organised and free of errors. Many spreadsheet tools offer features to help you clean your data by removing duplicates, correcting inconsistencies, and filling in missing values. This simple preparatory step helps ensure reliable results.
Charts and graphs
Visuals help people understand data better. Spreadsheets help you visualise your analysis by creating bar charts, line graphs, and many other types of data visualisation. These visual representations can help you identify patterns and present information to others more professionally. In Zoho Sheet, you can even create animated race charts, which allow you to visualise changes that occur over time.
Pivot tables
Pivot tables are great for summarising large volumes of information that might otherwise be difficult to analyse. This feature allows you to reorganise, categorise, and group data in various ways to draw useful conclusions.
For instance, let's assume you want to organise your sales data to look for patterns in demand for specific products across different regions. Pivot tables can help you quickly break down the data and examine multiple variables in various levels of detail.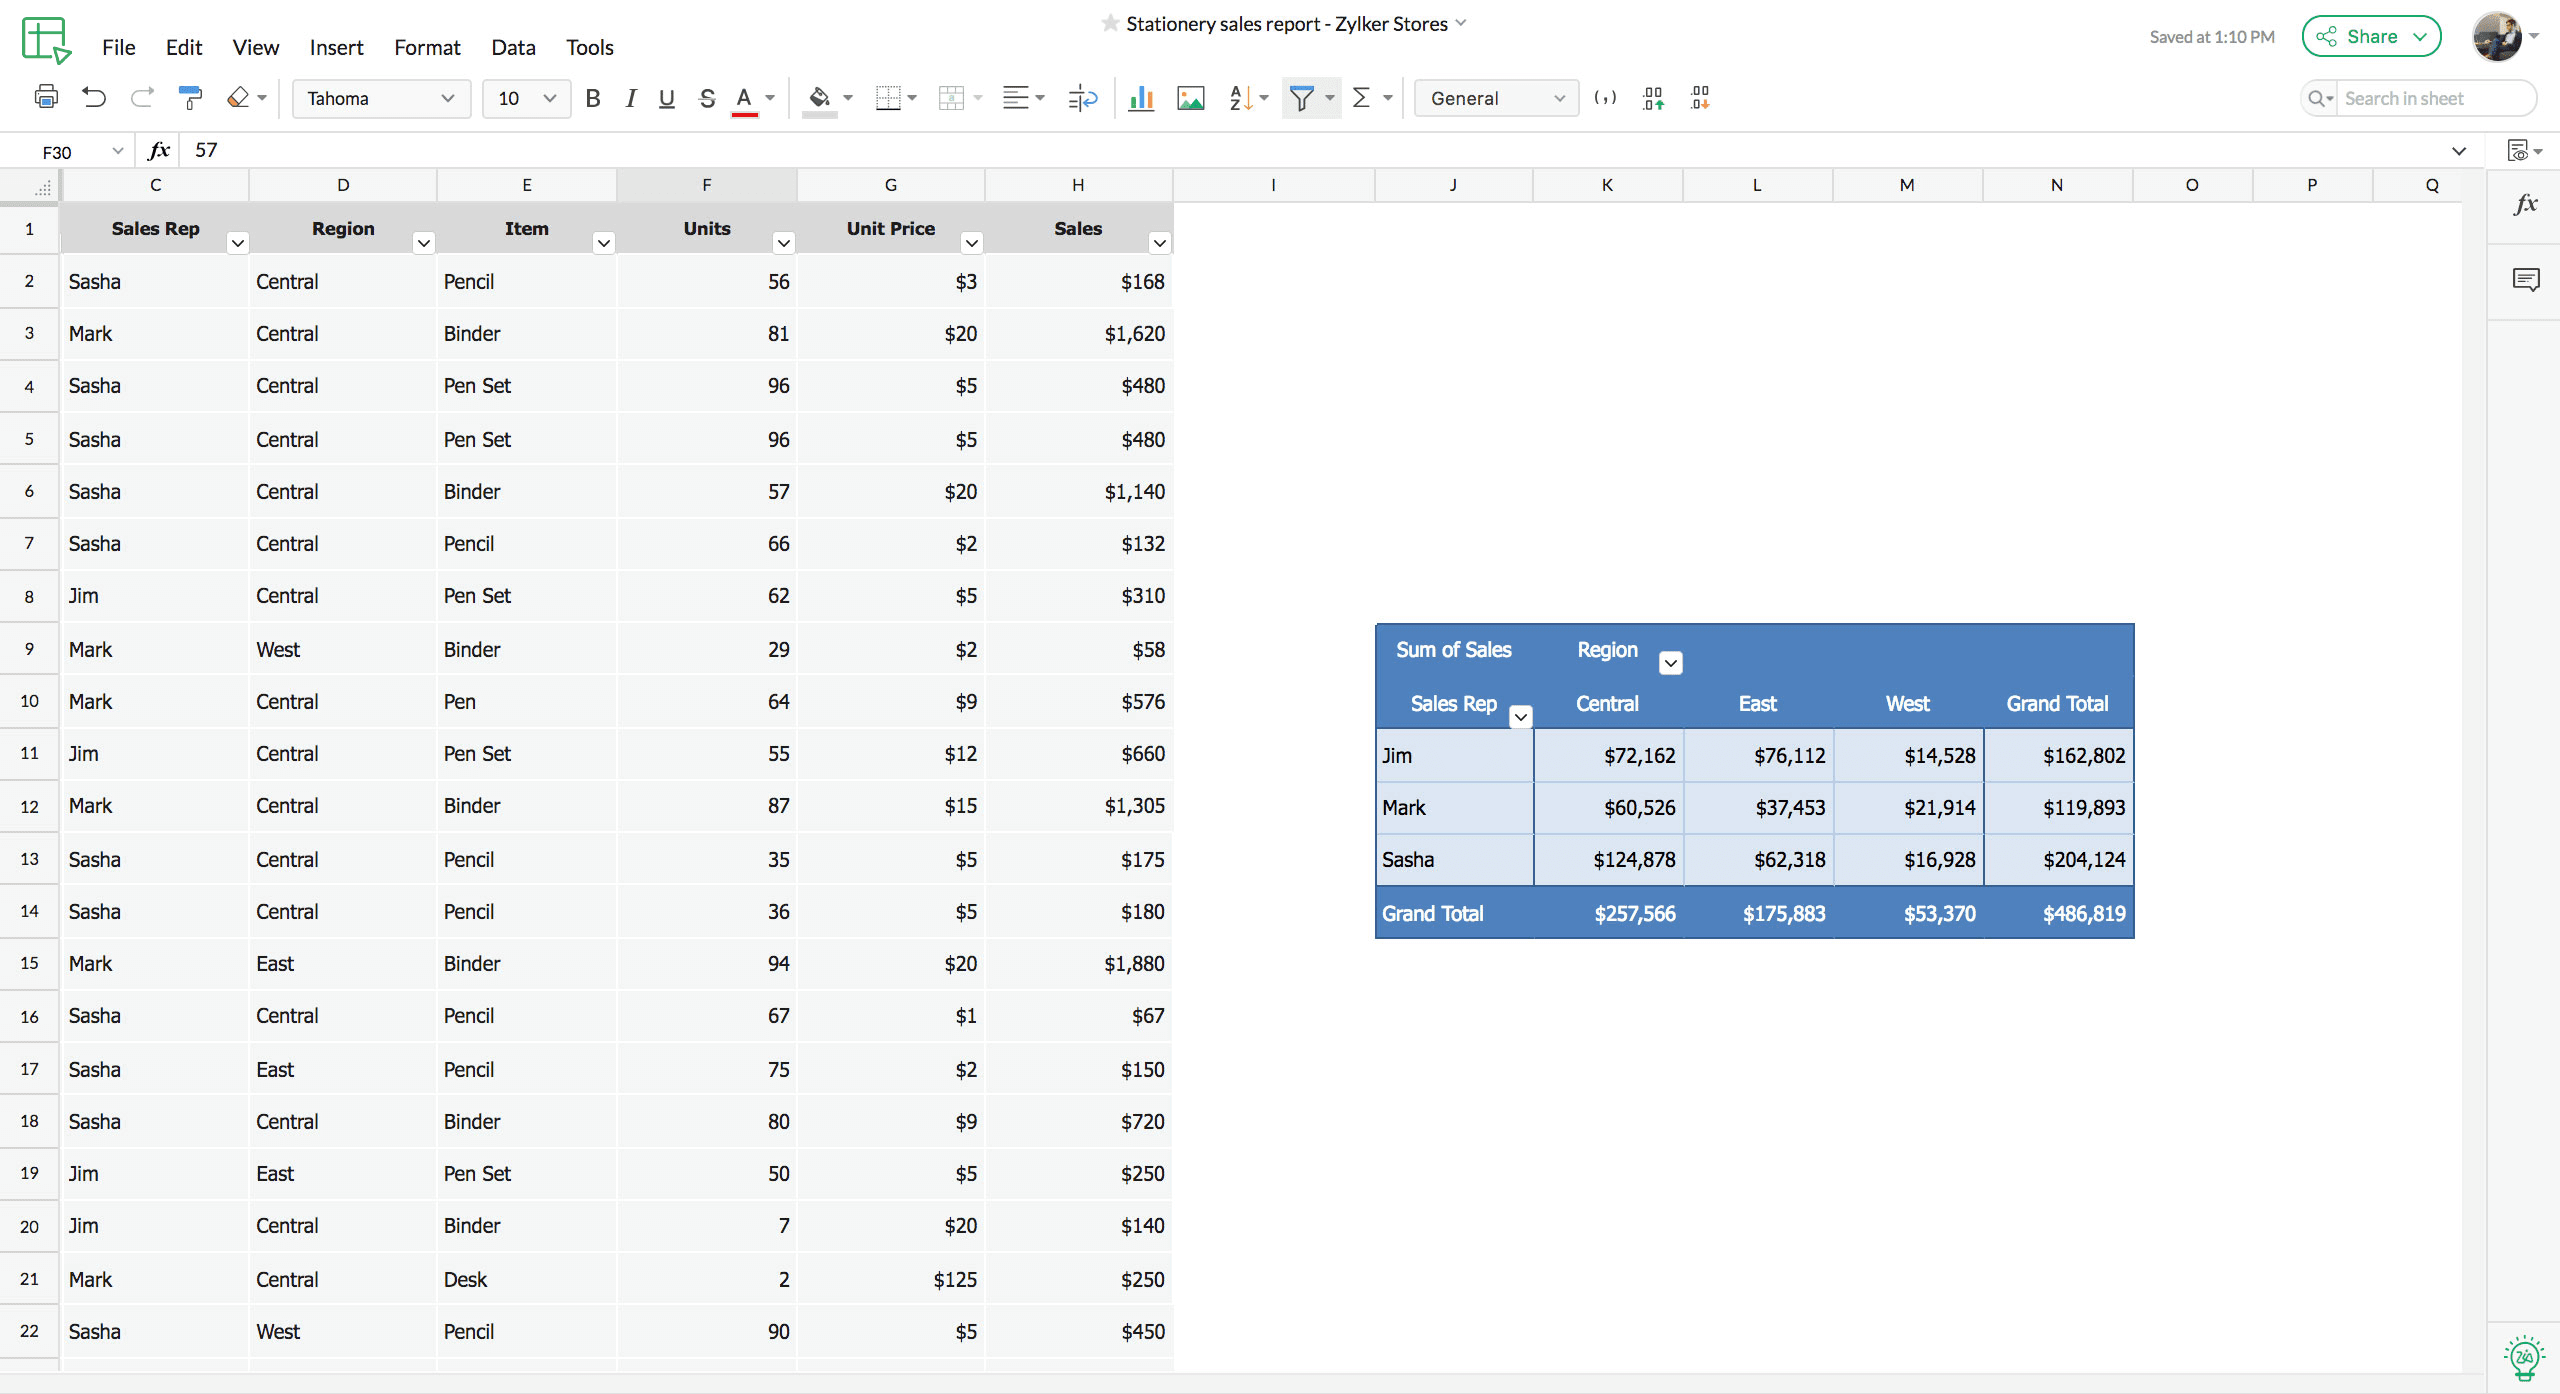
Formulas and functions
Spreadsheet formulas are a powerful tool that can be used to perform a wide range of calculations. This includes basic arithmetic, as well as more advanced features, such as logical comparisons using IF statements and text manipulation.
Most spreadsheet tools also offer a range of predefined functions, including SUM, AVERAGE, MAX, MIN, COUNT, and many others. These functions help users quickly perform various types of analysis and handle complex calculations with ease.
Artificial intelligence
Recent advancements in AI have significantly accelerated the process of analysing data in spreadsheets. For example, Zia—our built-in AI-powered assistant—can provide a complete summary of your data, including charts, pivot tables, and insights. With its conversational AI capabilities, you can interact with Zia by asking it questions just like you would with a collaborator in an online chat session. Zia can analyse your data and provide answers to your questions in seconds.
Spreadsheets vs. business intelligence (BI) and analytics tools
Spreadsheets and business analytics tools each offer distinct advantages, catering to various data management and analysis requirements. While spreadsheets are easy to use and provide basic capabilities, BI and analytics platforms offer more advanced features for in-depth analysis. It is crucial to consider when to switch to an advanced solution. Here's a comparison of when each tool is best used.
Spreadsheets: Spreadsheets are a great tool for individuals or small businesses to manage and organise data. They are easily accessible on most devices and require a minimal learning curve, which makes them ideal for small-scale projects. Spreadsheets are particularly effective in structuring data in a table format.
Business intelligence and analytics tools: BI and analytics tools offer advanced features and capabilities designed for comprehensive analysis. These tools can easily handle large volumes of complex raw data from multiple sources. They can be used to identify trends, forecast your business results, and more. They are typically best suited for larger businesses looking to make sophisticated data-driven decisions.
We hope this blog helps you understand how to use spreadsheets for analysis and how they compare to more advanced data analysis tools. Are there any more topics you'd like us to cover? Let us know in the comments.