- HOME
- Know Your Tech
- How workflow visualization improves work
How workflow visualization improves work
- Last Updated : May 27, 2025
- 430 Views
- 4 Min Read
Human beings process images much faster than text. MIT researchers found that the human brain has the capacity to scan an entire image in as little as 13 milliseconds. This means, to understand complex ideas, a well-designed diagram or chart can be far more effective than text.
In this blog, we'll look at what workflow visualization is, how it leads to measurable improvements, and a few best practices.
What is workflow visualization?
Workflow visualization is the art of turning complex processes into clear, visual representations. Simple shapes and symbols are used to outline every step, decision point, and hand-off in a process. Instead of explaining how work moves from one stage to the next in paragraphs, you just draw a diagram.
Mapping out a workflow makes it easier to understand, manage, and refine. When teams can see each step laid out, inefficiencies that were once hidden become obvious. This clarity leads to better communication and more control over how work flows. Workflow visualization helps businesses eliminate confusion and improve overall productivity.
How workflow visualization leads to measurable improvements
Visualizing workflows transforms abstract ideas into concrete images. This transformation has several tangible benefits, including:
- Visual presentation of information helps teams grasp complex processes easily. In fact, studies have shown that process visualization can reduce the duration of business meetings by up to 24%.
- A clear workflow diagram ensures everyone is on the same page—team members can see their roles and the connection to their tasks. This transparency reduces miscommunication and encourages accountability.
- By mapping out each step, it becomes easier to identify bottlenecks. Visualizing a bottleneck enables managers to reassign resources or adjust timelines faster.
- With workflow diagram software integrated into workflow tools, businesses can monitor KPIs in real time. Managers can compare performance across departments and make adjustments based on up-to-date information.
Choosing the right visualization method
Not every visualization tool will work for every process, which is why it's good to learn some best practices:
Understand the process
Before you start, know what the beginning and end points are, and identify any decision points. This initial step is the key to selecting the right workflow visualization tool.
Select the appropriate tool:
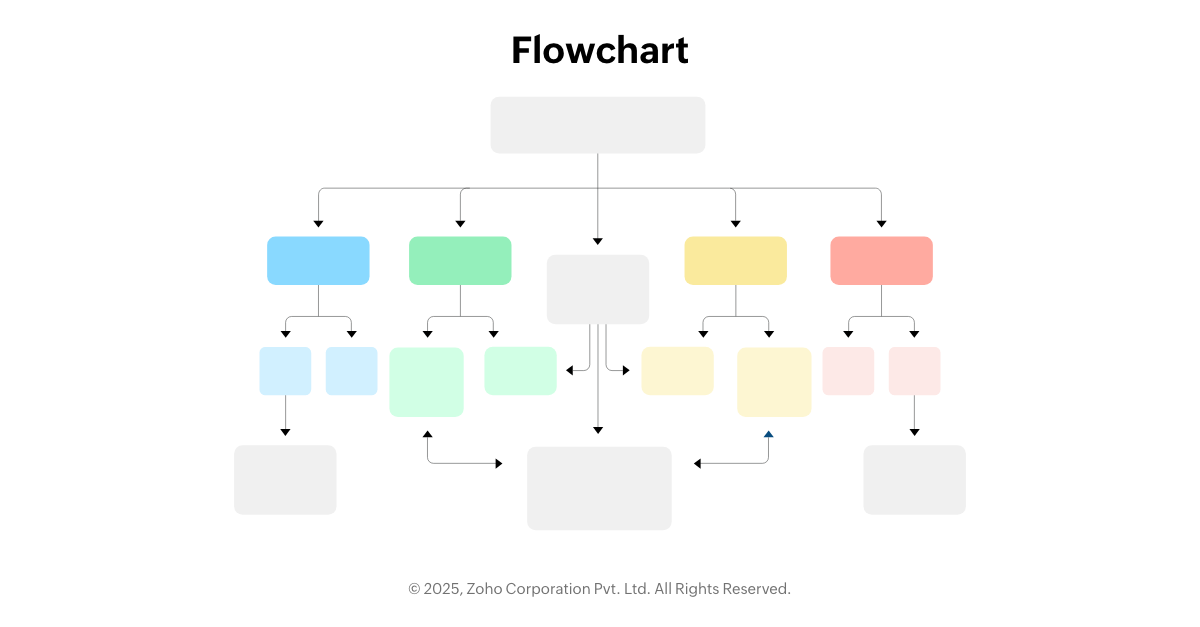
- Flowcharts are excellent for step-by-step processes.
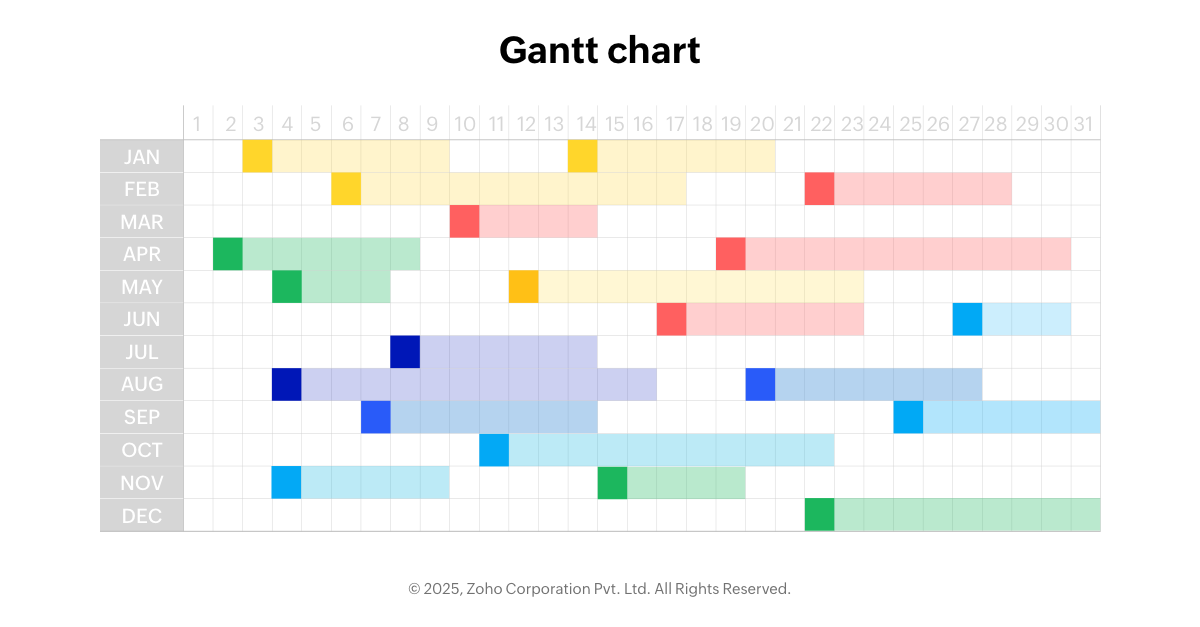
- Gantt charts work well for project timelines and resource allocation.
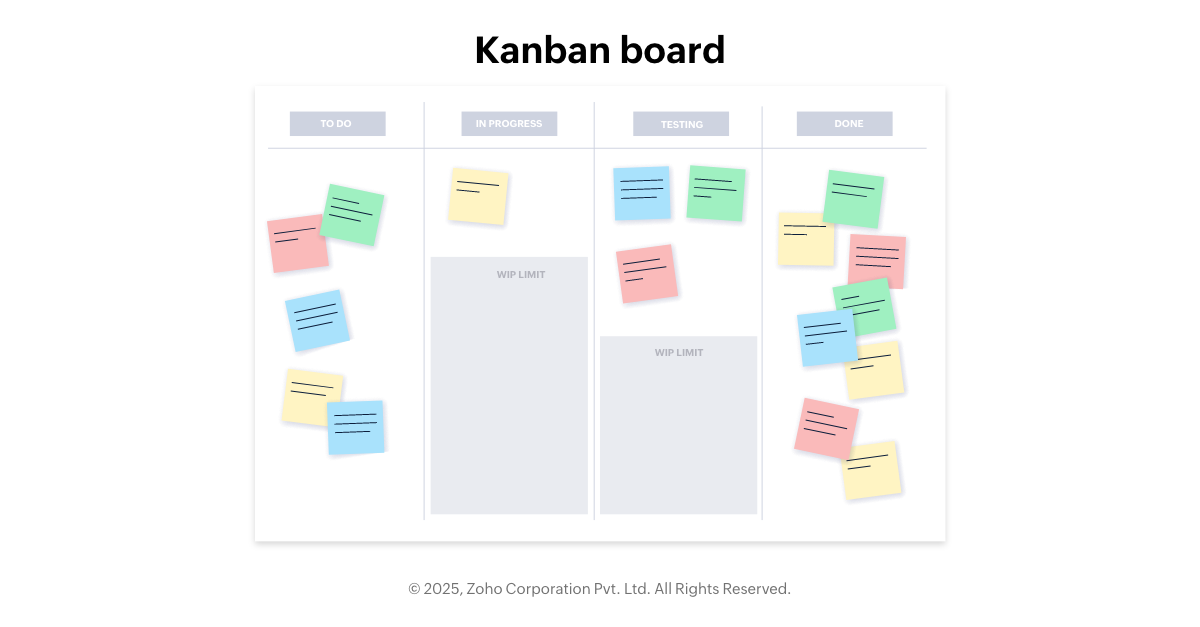
- Kanban boards are ideal for tracking work in progress and ensuring that tasks flow smoothly between stages.
Each of these methods highlights different aspects of a process. It's important to choose the one that helps you create workflows that align with your business operations.
Keep it simple
Use clean layouts and avoid unnecessary decorative elements. A simple visual workflow that clearly shows the flow and relationships is more useful than a complex, overloaded chart.
Incorporate different colors and shapes
Leverage the brain’s natural ability to process visual cues like color, shape, and size. For instance, different colors can be used to distinguish between process stages or to highlight issues.
Ensure flexibility and scalability
Your chosen method should be adaptable. As your process evolves, your visualization should be easy to update. Tools that integrate with live data can automatically adjust as changes occur, so your visualization stays relevant at all times.
Involve your team
Test your visualization with end users and refine it based on their feedback. A visualization that works on paper must translate into improved understanding and action on the ground.
Common mistakes to avoid
Even with the best intentions, it’s easy to make mistakes in workflow visualization. Here are some pitfalls to watch out for:
Overcomplicating the visual
One of the most common errors is trying to include every tiny detail in one diagram; this can overwhelm users and defeat the purpose of clarity. Instead, focus on the key steps and use separate diagrams for sub-processes, if necessary.
Inconsistent formatting
Consistency is critical, as mixing different symbols or colors without a clear guide can lead to confusion. Ensure that all visual elements follow a standardized design that the team understands.
Ignoring data integration
A static diagram is useful, but it should be connected to live data when possible. Failure to integrate can lead to outdated or irrelevant visualizations, reducing their usefulness.
Neglecting input
Don’t design in isolation. It's vital to collect feedback from regular users—their insights can reveal gaps or misinterpretations that you might have missed.
Chart-junk
While aesthetics are important, too many design flourishes can distract from the data. Stick to simple designs that enhance rather than obscure the core information.
Making workflow visualization useful
You know you have a well-planned workflow visualization when it's helping your team work better. The ultimate goal is to create something that simplifies decision-making, highlights problem areas, and evolves as work changes.
For that to happen, the diagram needs to be clear, practical, and easy to update. A cluttered or overly detailed chart can be just as confusing as not having one at all. On the other hand, a simple yet well-designed visualization can improve communication and make work feel less chaotic.
The key is to choose the right format, get input from the people using it, and keep it flexible. Whether you’re handling project management or streamlining your workflow management, a well-mapped workflow makes it easier to collaborate, plan, and execute tasks.
 Ann Elizabeth Sam
Hey! I'm Ann, and I work as a content writer at Zoho Creator. I'm exploring the SaaS world through various forms of content creation. Outside of work, I love dancing and would give up anything to read a good murder mystery.