Customizing a Dashboard
Zoho Analytics offers a wide range of options to customize the dashboard. With it's easy to use interface, you can customize/format the design and create a visually rich dashboard quickly.
- General Settings
- Customize Zia Insights
- Applying Theme
- Show/Hide Report Title and Description
- Legend Positioning
- Show Report Specific User Filters
- Exclude Dashboard Filters
- Allow Reports to Act as Filter
General Settings
Zoho Analytics provides a set of options to customize the interactions in Dashboards. You can customize the Dashboard settings by clicking the settings icon on the top right of the dashboard.
![]()
The Settings dialog will open.
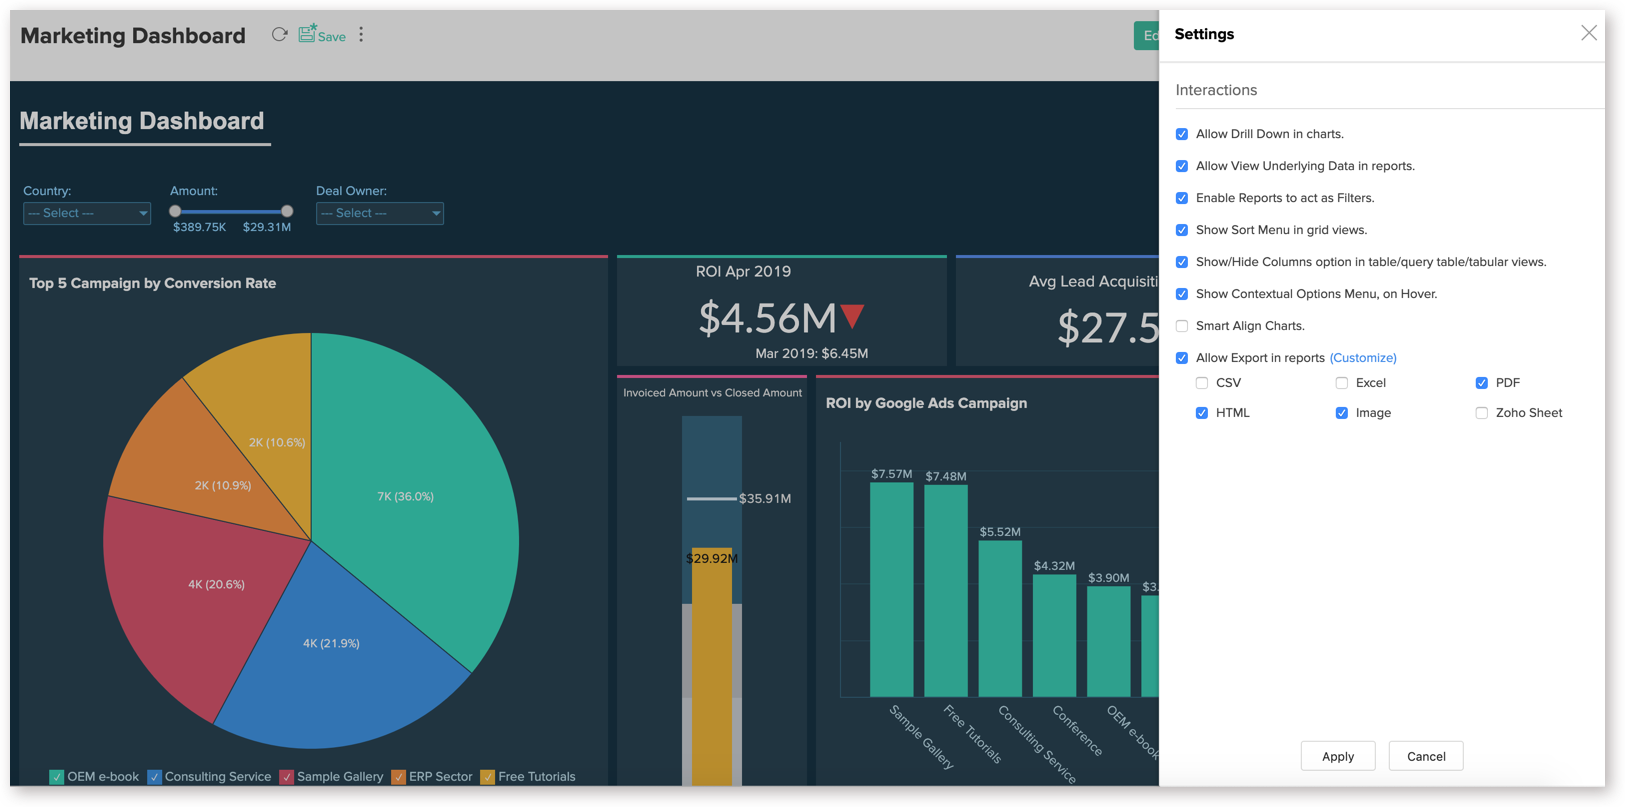
The following options will be available to customize the dashboard.
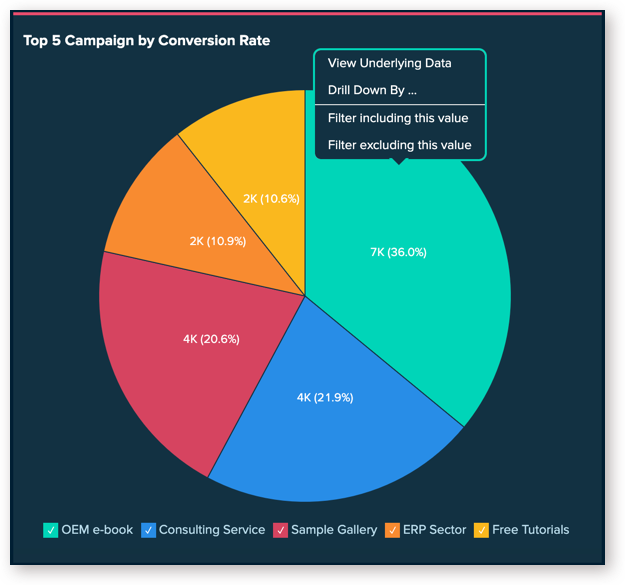
- Allow Drill Down in charts - Enable or disable drill down option for all charts in the dashboard.
- Allow View Underlying Data in reports - Enable or disable view underlying data option for all reports in the dashboard.
- Enable Report to Act as Filter - Enable or disable filtering the dashboard using data from the reports.
- Show Sort Menu in grid views - Provide sort option for all grid views such as Table, Pivot etc., in the dashboard
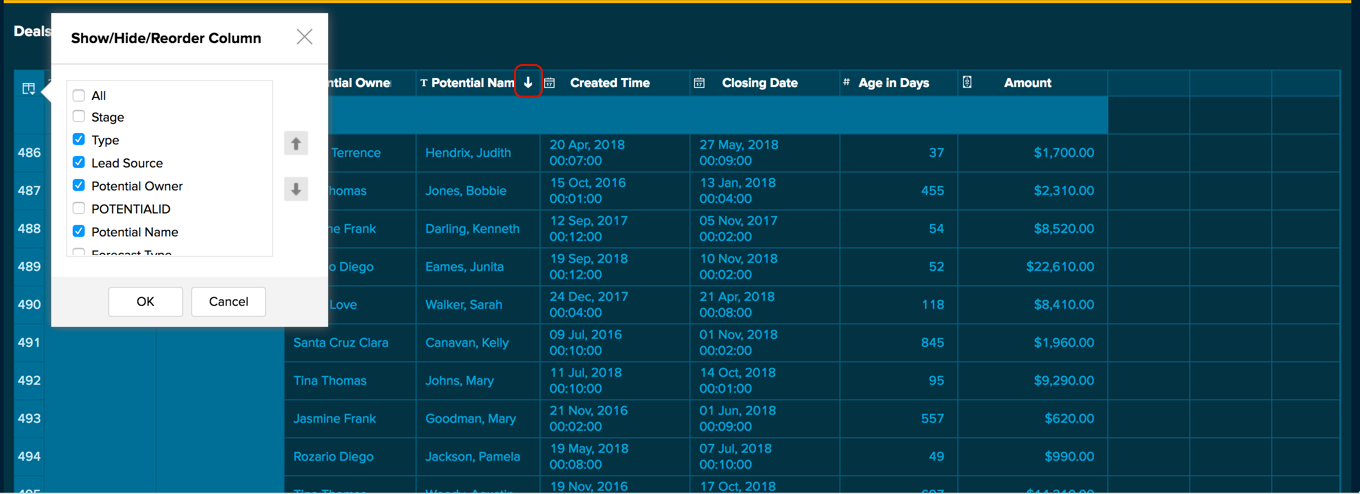
- Show/Hide Columns option in table/query table/tabular views - Enable or disable the Show/Hide Columns option for all tabular views such as Table, Pivot etc.
- Show Contextual Options Menu, on Hover - Enable or disable the contextual options menu, when you hover over each report in the dashboard.
- Smart Align Charts - Zoho Analytics will intelligently auto align the components of the Charts embedded in a Dashboard depending on the space available. This enhances readability by removing clutter and gives more space for main chart component.
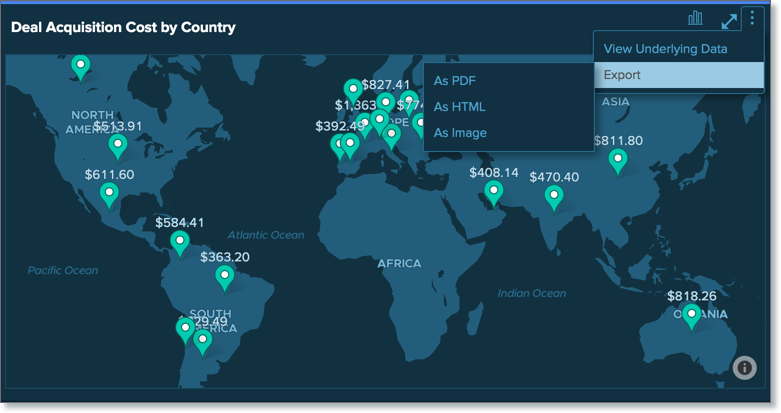
- Allow Export in report - Enable or disable export options for the embedded reports in the dashboard. You can also choose the export file formats to allow using the Customize link.


Customize Zia Insights
The Customize Zia Insights section allows you to control how AI-generated insights are displayed for a report. These settings help tailor insights for different audiences and use cases without altering the underlying report.
To customize the Zia Insights,
- Access the dashboard in Edit mode.
- Click the Zia Settings icon.
Enable Zia Insights
The Show Insights option is enabled by default for reports. Based on whether you need to display insights for a report, you can choose to enable or disable this option.
Insights Placement
Insights Placement lets you control how and where AI insights appear for a report, so users can consume insights without disrupting their analysis workflow.
- Overlay: Displays insights in a floating panel that opens on demand, allowing users to review insights without leaving or altering the report view.
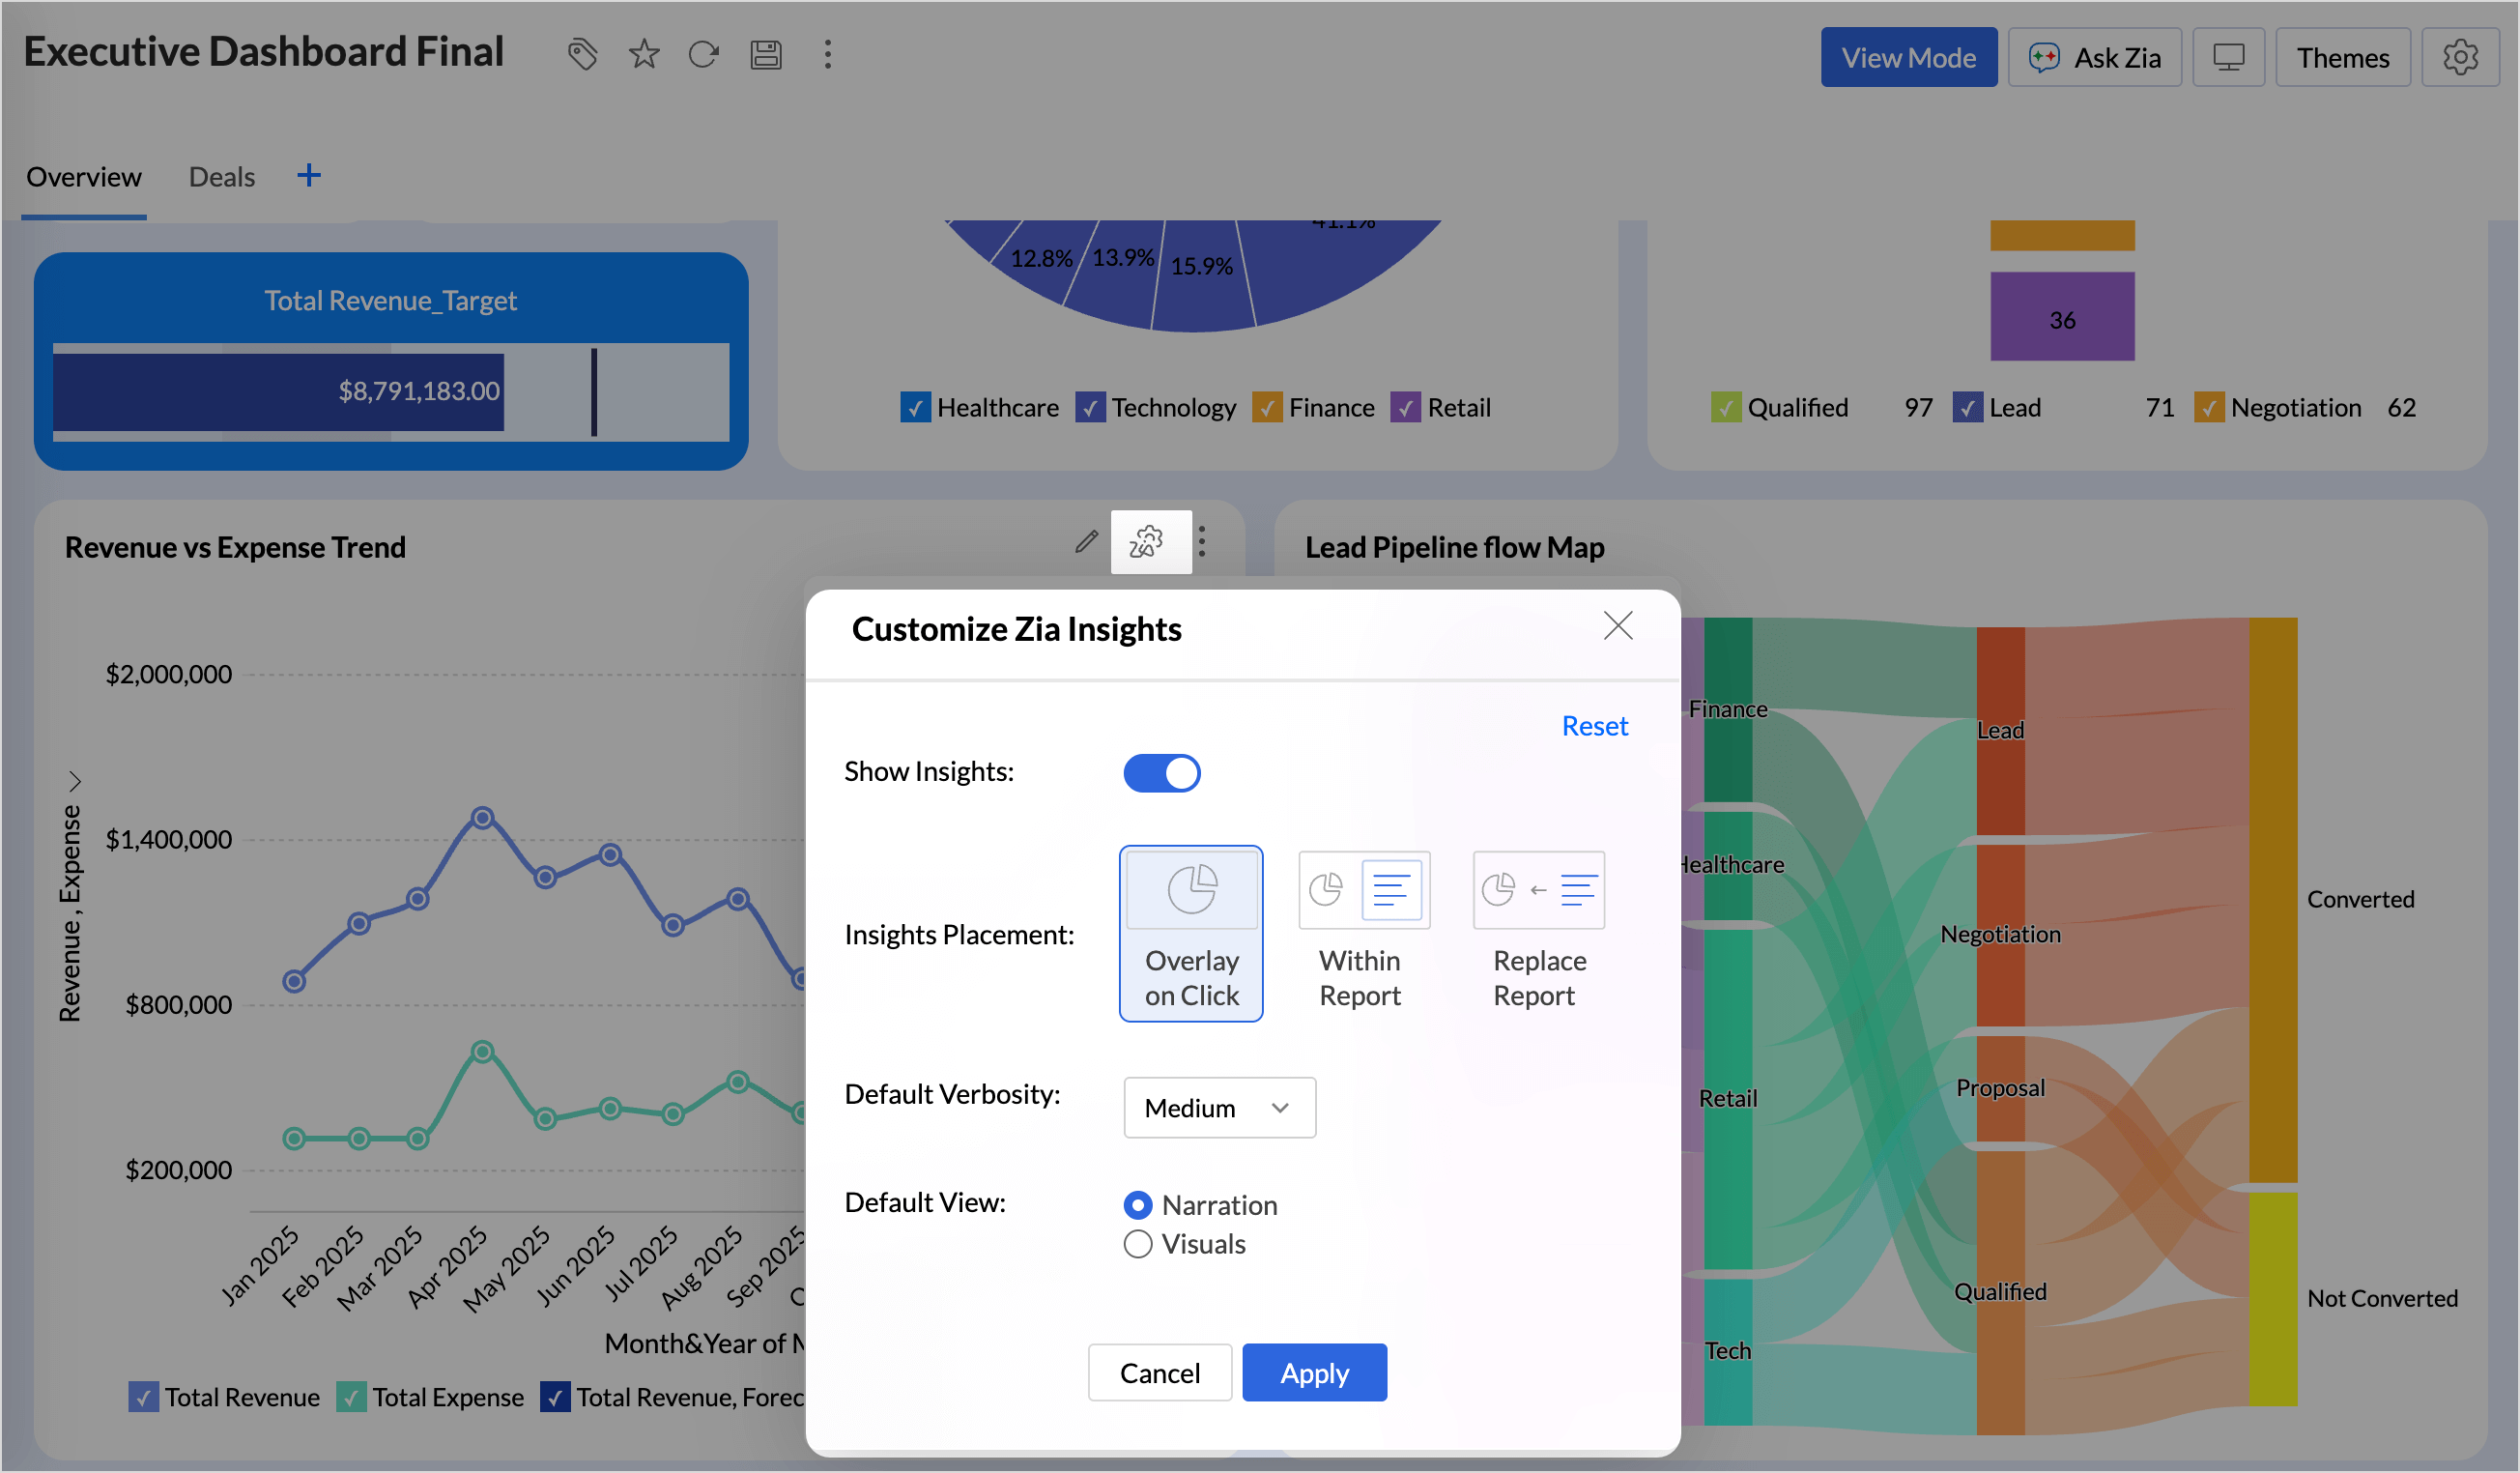
- Within Report: Embeds insights directly within the report, enabling users to view data and insights together in a single, continuous view.
- Replace Report: Displays insights as the primary view by replacing the report entirely, offering an insight-first experience focused on conclusions rather than raw data.
Verbosity
Zia Insights provides three verbosity levels for generating insights. Each level offers contextually tailored insights highlighting key metrics. Click the Verbosity icon to choose your preferred level. By default, the Medium verbosity level is selected.
Default Views
Use this option to define how Zia Insights are presented, based on how users prefer to consume and interpret insights.
- Narration: Presents insights as clear, text-based explanations that describe trends, patterns, anomalies, and key observations. This view is ideal when users want descriptive insights or need to understand why a change occurred.
- Visuals: Presents insights using visual elements such as charts, indicators, and highlights to quickly draw attention to important changes and patterns. This view is best for multi-dimensional interpretation of data. Refer to Zia Insights article to learn more.
Applying Themes
Zoho Analytics offers the flexibility to customize your dashboard theme, allowing you to enhance its appearance and functionality.
You can choose from a variety of preset themes or design custom themes tailored to your preferences. Additionally, you have the option to adjust the dashboard layout to suit your needs. Customization options include:
To apply themes, click the Theme button located at the top right corner of your dashboard. Zoho Analytics offers three theme types to choose from: Solid, Gradient, and Image.
1. Preset Themes
Preset themes provide a simple way to enhance your dashboard's look with professionally designed options. You can choose from three types - Solid, Gradient, and Image themes.
Solid
Zoho Analytics offers seven preset solid color combinations for a clean, minimalistic appearance.

To add a custom solid theme, click the + Add icon at the end of presets to select the theme color from the preset colors palette.

Gradient
Zoho Analytics offers eight preset gradient color combinations. Gradient themes feature smooth color transitions for a modern, dynamic appearance.

To add a custom gradient theme, click + Add icon at the end of presets to select the theme color from the preset colors palette.

Image
Zoho Analytics provides eight preset images that can be used as background themes for your dashboard. These options add a distinctive visual touch, making your dashboards more engaging and visually appealing.

To add a custom image as a background, click the +Add icon at the end of presets.

2. Customize Dashboard Themes
Customize dashboard themes in Zoho Analytics to tailor the look and feel of your dashboards to your unique preferences. Personalize colors, card styles, report palette, and chart effect to create a design that aligns perfectly with your needs.
To customize the dashboard themes,
- Click Customize at the end of presets in each section.

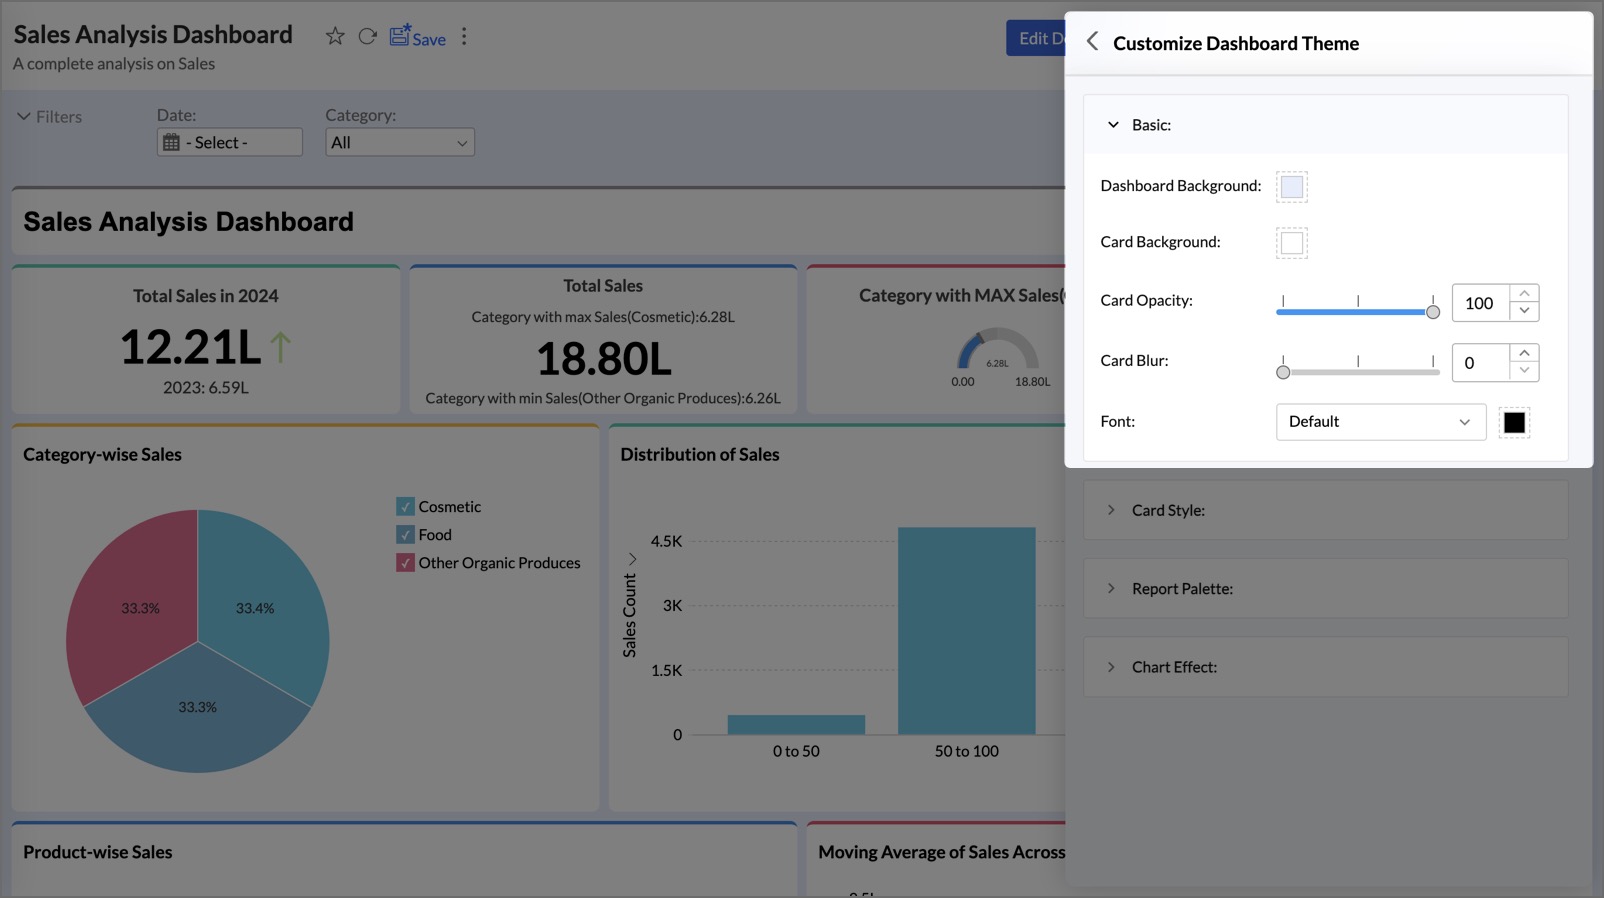
- The Customize Dashboard Theme dialog enables you to personalize the appearance of your dashboard by adjusting the following settings - Basic, Card Style, Report Palette, and Chart Effect.
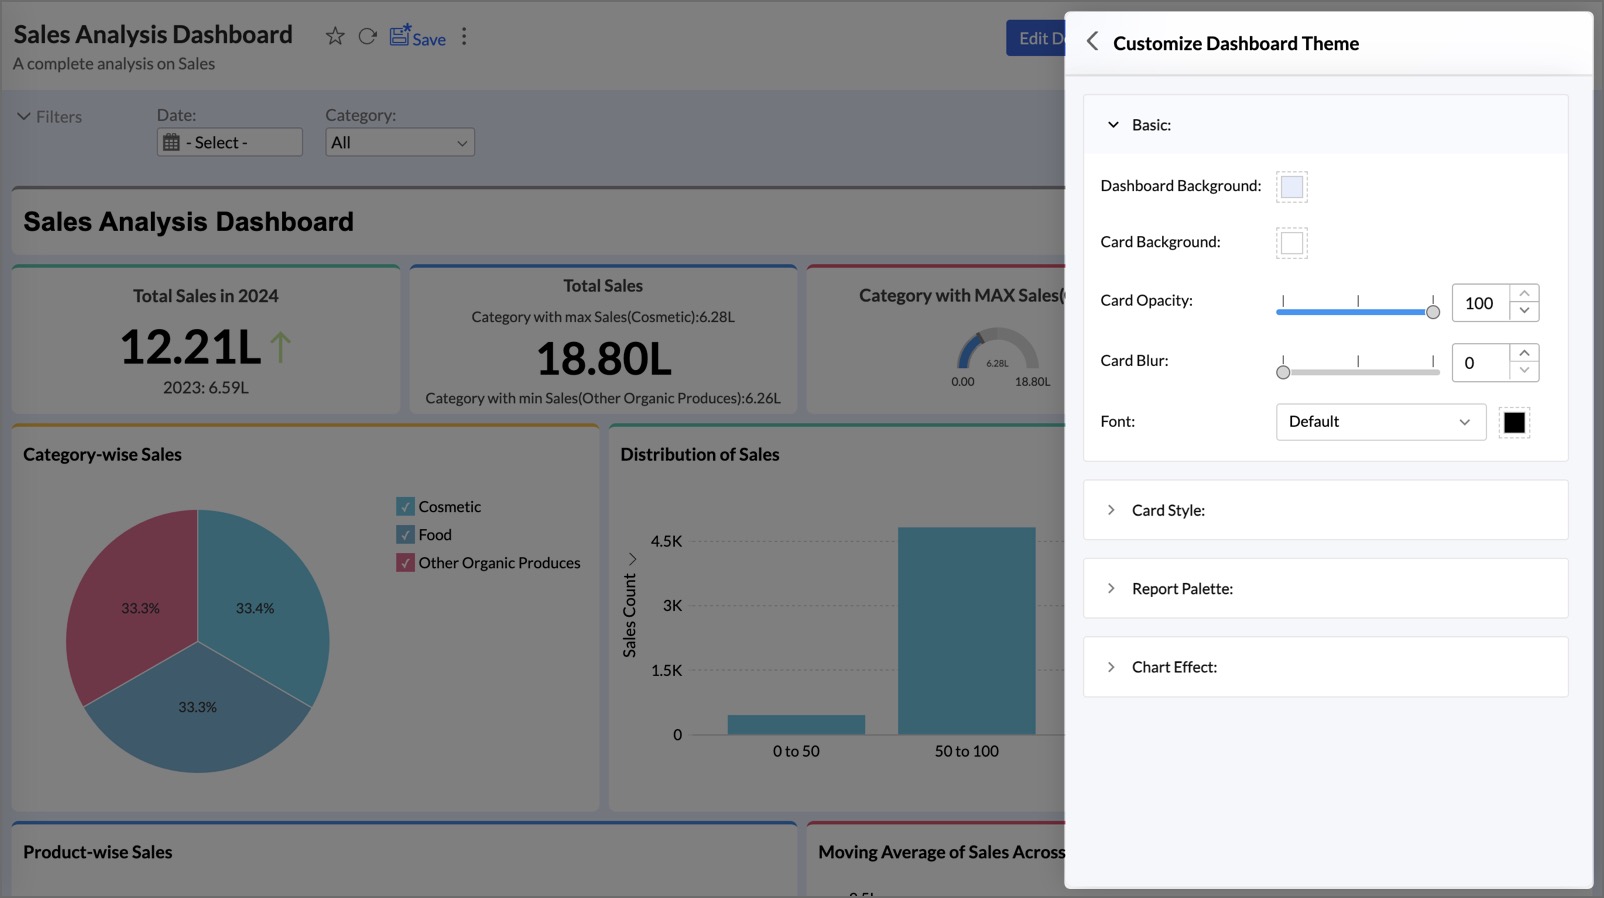


Basic
a. Solid Presets
In the Basic section of the Customize Dashboard Theme, you can personalize your dashboard with the following options for a solid theme:
- Dashboard Background: Set a background color for the entire dashboard to align with your design preferences or branding.
- Card Background: Customize the background color or style of individual cards for better visual distinction.
- Card Opacity: Adjust the transparency of cards. Lower values make them more see-through, while higher values make them solid.
- Card Blur: Apply a blur effect to the card background for a translucent appearance.
- Font: Select a font style and color for dashboard text to ensure readability and match your theme.

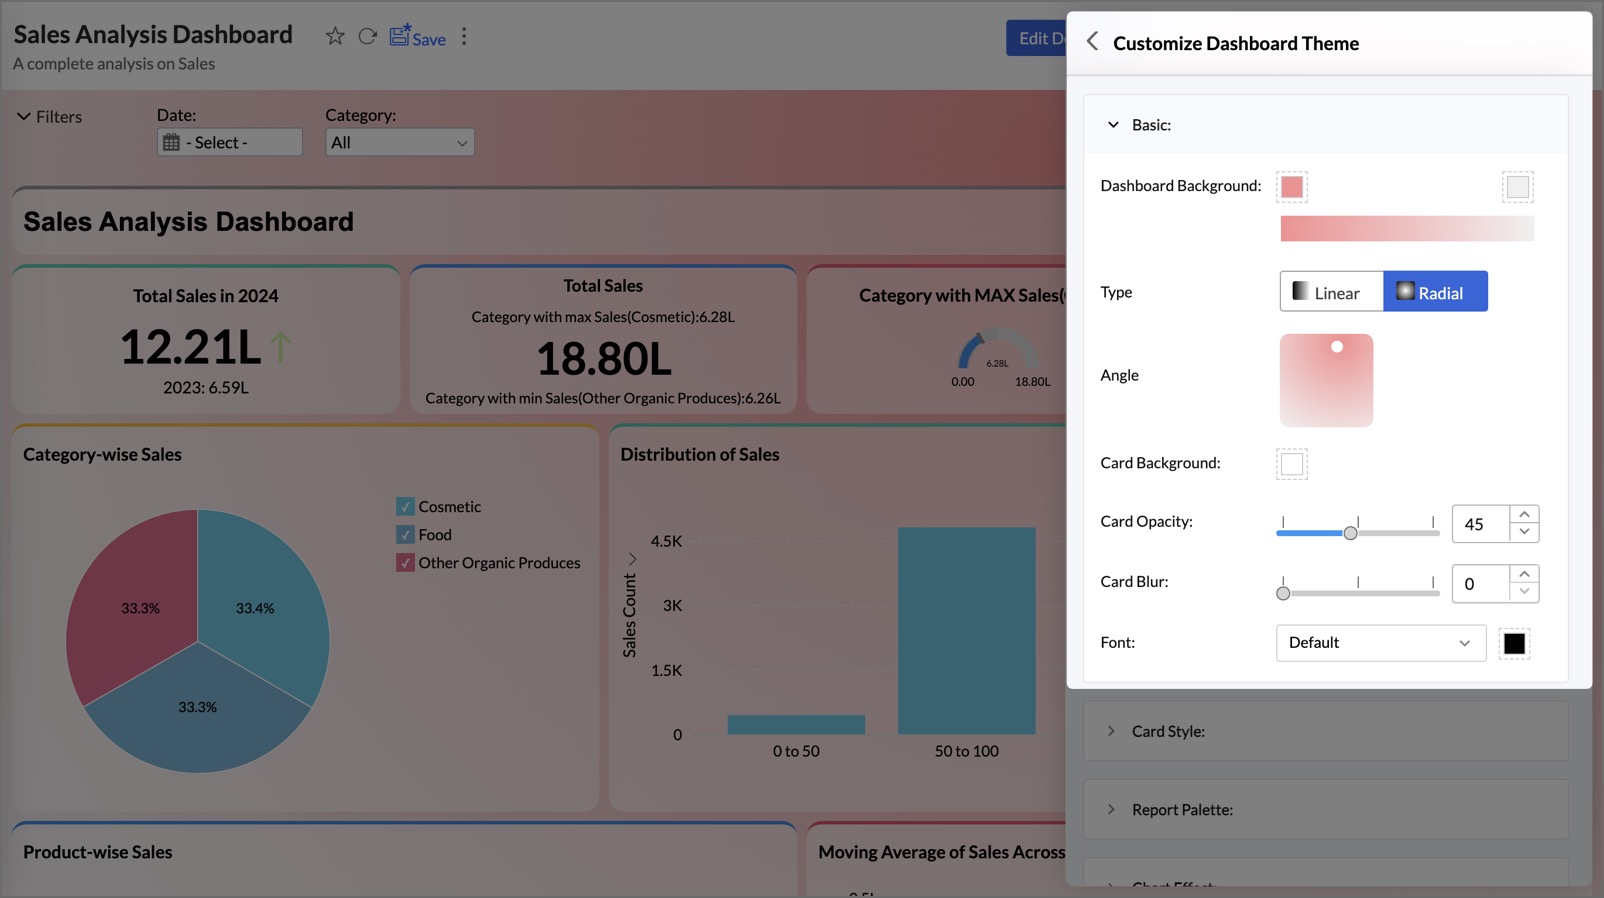
b. Gradient Theme
In the Basic section of the Customize Dashboard Theme, the following options are available for gradient themes:
- Dashboard Background: Choose two colors to create a gradient theme for the entire dashboard background.
- Type: Choose the gradient styles between Linear or Radial.
- Angle: Adjust the angle/direction of the gradient for your dashboard theme.
- Card Background: Set the background color for individual cards on the dashboard.
- Card Opacity: Adjust the transparency of the cards.
- Card Blur: Apply a blur effect to the card background.
- Font: Customize the font style and color for dashboard text.

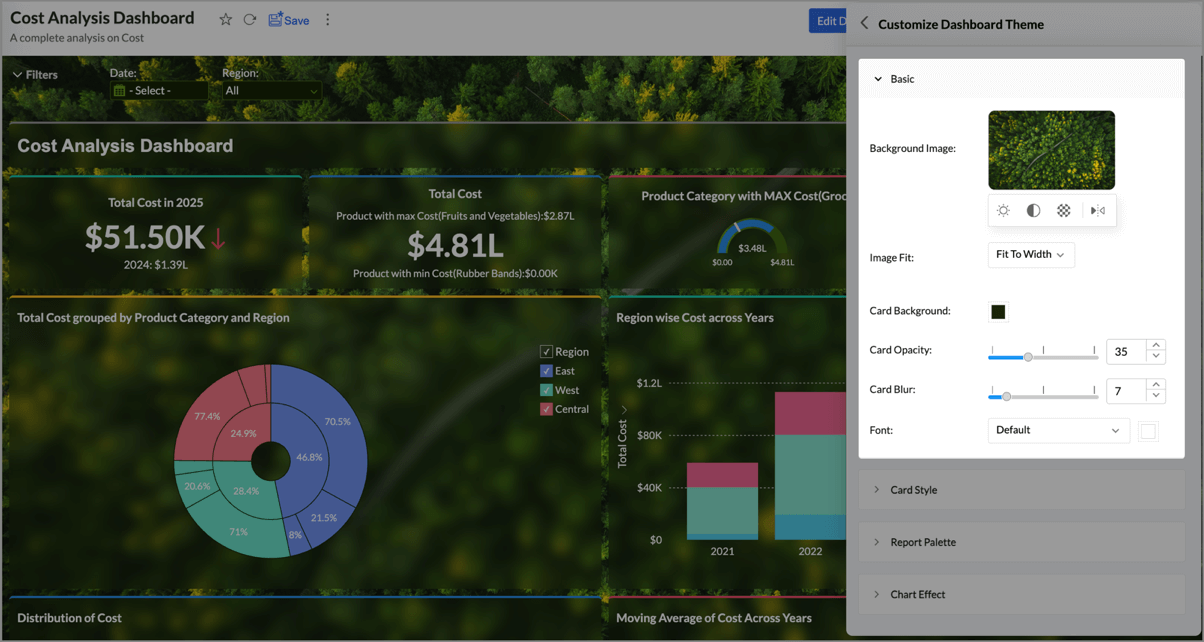
c. Image presets
In the Basic section of the Customize Dashboard Theme, you can enhance your dashboard with the following options for an image theme:
- Dashboard Image: Allows you to set any image as the background for the entire dashboard.
- Image effects: Allows you to refine visual appearance and orientation of your image.
- Brightness: Adjusts how light or dark the background image appears. Use the slider or enter a value to increase brightness for a lighter image, or decrease it for a darker effect.
- Contrast: Controls the difference between light and dark areas of the background image. A higher contrast sharpens details; a lower contrast gives a softer look. Adjust using the slider or input field.
- Transparency: Sets how much of the background image is visible beneath a color overlay. Increase transparency to show more of the image in detail. Decrease it to blend in the selected color, creating a muted or tinted effect. Adjust using the slider or input field.
- Flip: Flips the background image horizontally. Use this to change the image orientation for visual balance or styling needs.
- Image Fit: Adjust how the background image is displayed:
- Fit to Width: Scales the image to fit the width of the dashboard.
- Original: Displays the image in its original size.
- Repeat: Tiles the image to fill the entire background.
- Other customization options such as Card Background, Card Opacity, Card Blur, and Font are also available. For more details, refer to the previous section.


Card Style
The Card Style option allows you to personalize the appearance of the cards in your dashboard.
- Margin: Adjust the margin around the cards to suit your preference.
- Radius: Modify the card's corner radius for a more refined look.
- Shadow: Add a shadow effect to your cards with three levels—Low, Medium, and High. By default, shadows are disabled.
- Title: Customize the font style and color of the text in your card titles.
- Description: Personalize the font style and color of the text in your card descriptions.

Additionally, more card customization options are available, depending on the theme layout you choose. To explore theme layouts further, click here.
Theme Layouts | Available Customization Options |
| Flat | Card Title Background - Add colors to your dashboard background. |
| Border | Card Border - Add colors to your card border and adjust its width. Card Title Border -Add colors to your card title border and adjust its width. |
| Top Border | Card Top Border - Add colors to your card border at the top and adjust its width. |
| Top Border Multicolor | Card Top Border - Adjust the width of the card top border. Card Top Border - Choose colors for the card top border from the palettes available. |
| Fill Color | Card Border - Add colors to your card border and adjust its width. Card Title Background - Add colors to your dashboard background. |
| Fill Multicolor | Card Title Background - Add colors to your dashboard background. |
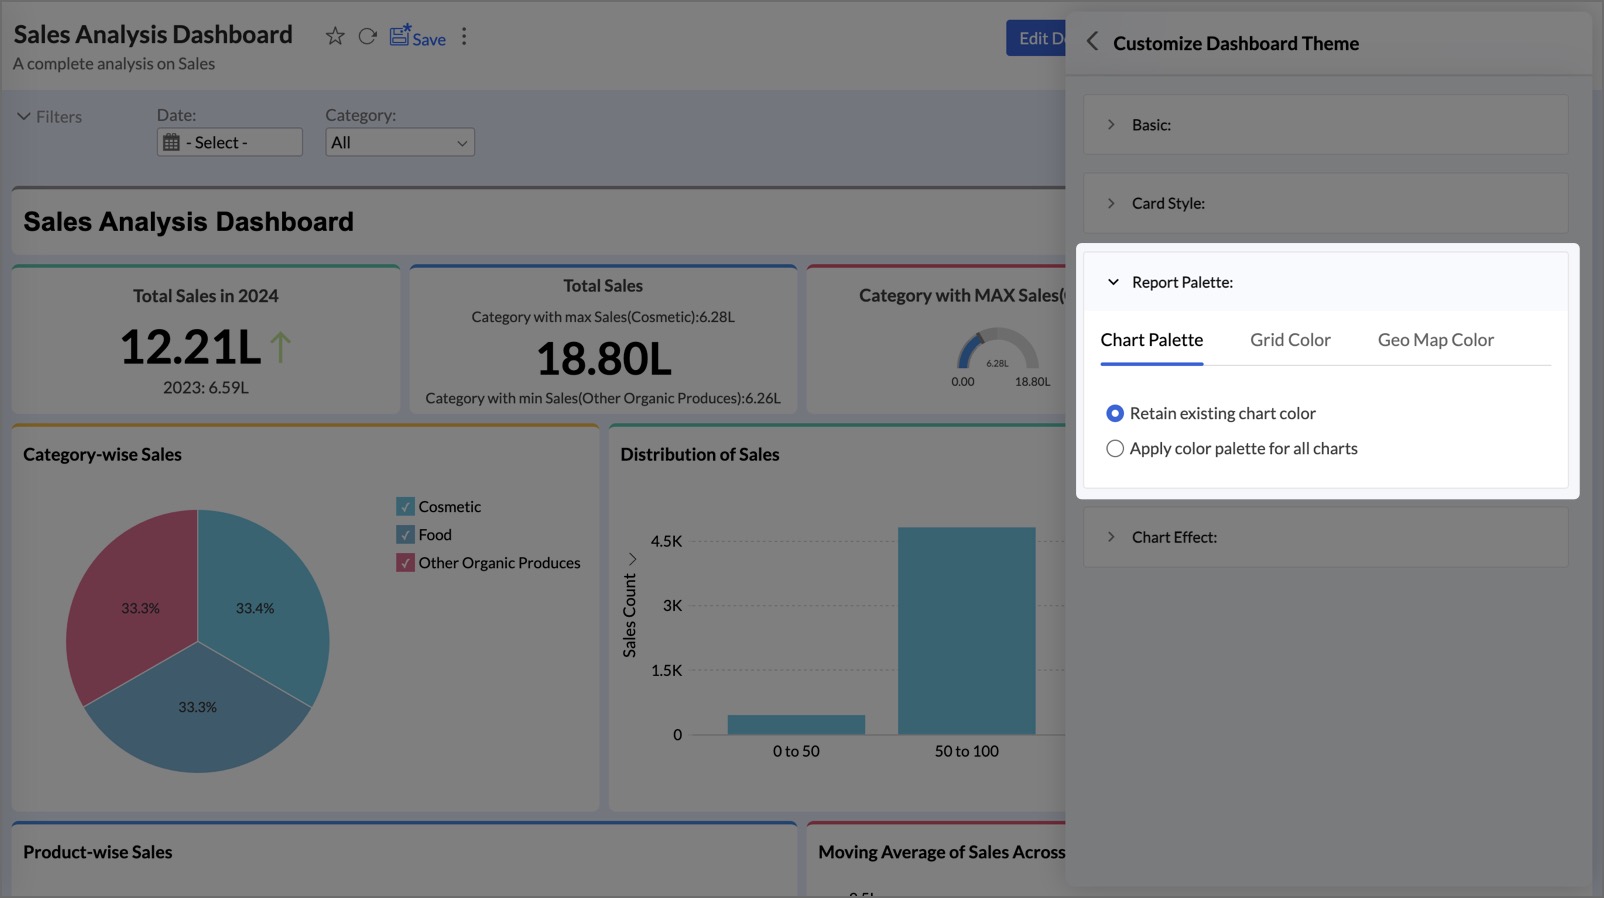
Report Palette
The Report Palette section allows you to customize the color scheme for reports, grid views (e.g., pivot tables, tabular views), and geo maps within the dashboard. The selected color options will apply only to the reports in this specific dashboard.
Chart Palette
You can adjust the colors for all reports in the dashboard. Two options are available:
- Retain Existing Chart Colors: Keeps the original colors in the reports.
- Apply Color Palette to All Charts: Allows you to select a palette type and apply it to all charts in the dashboard.

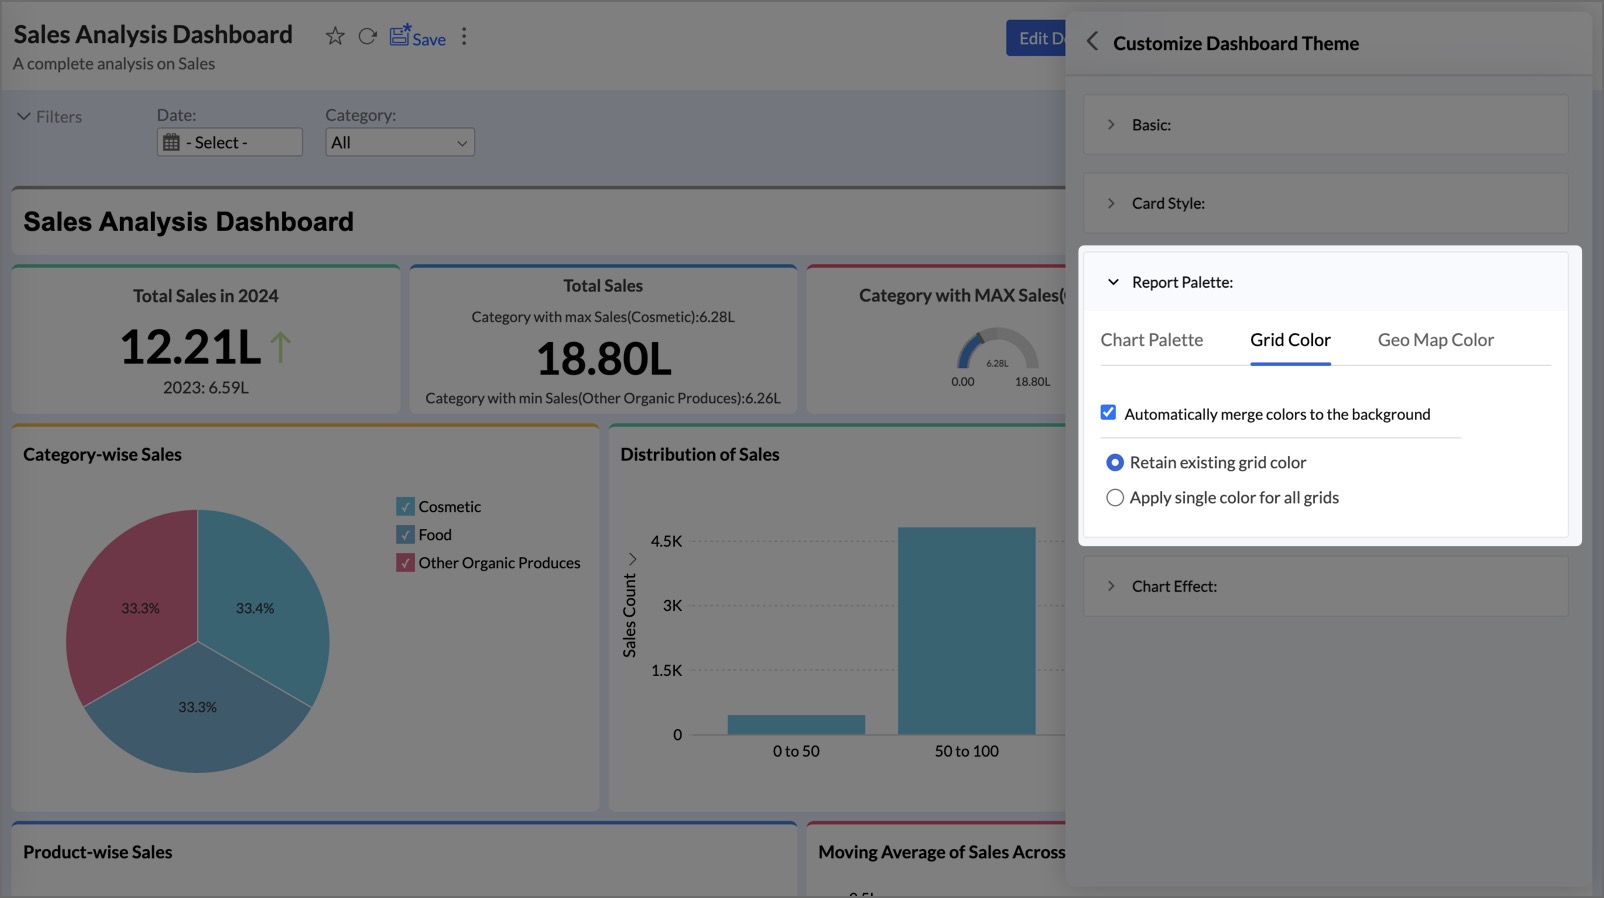
Grid Color
- Automatically Merge Colors with Background: Blends grid colors (e.g., pivots, tables) seamlessly with the dashboard background.
- Retain Existing Grid Colors: Keeps the original grid colors.
- Apply Single Color to All Grids: Choose a color from the palette and apply it to all grid views in the dashboard.

Geo Map Color
- Retain Existing Map Colors: Keeps the original map colors.
- Apply Single Color to All Maps: Choose from the available map color palettes: Light, Dark, Blue, Custom Color, or Satellite.
- Invert Color: Swap the colors between land and water bodies on the map.
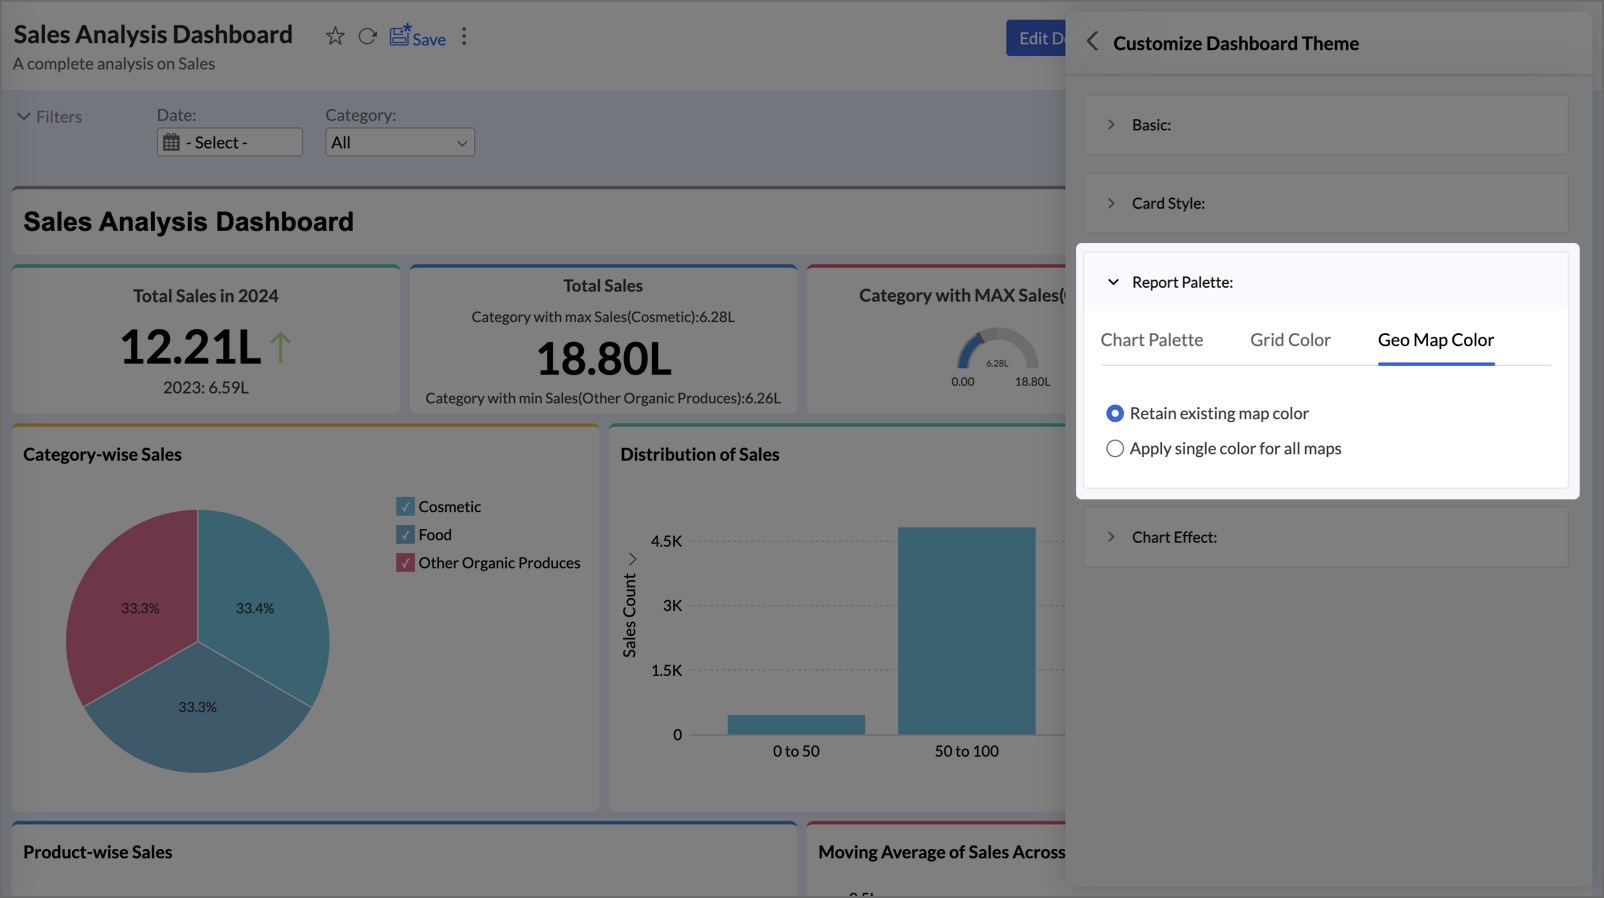

Chart Effect
Zoho Analytics provides three chart effects—Default, Chalk, and Freehand—that can be applied to all reports. You can choose to retain the original chart effect or apply a new one across all reports in your dashboard.

3. Dashboard Layouts
Zoho Analytics offers six distinct theme layouts for your dashboard:
- Flat Theme: A simple design featuring different colors for the dashboard background and card backgrounds (reports, tables, and KPI widgets).
- Border Theme: Adds borders around all cards.
- Top Border Theme: Includes a border only at the top of each card.
- Fill Color Theme: Applies a solid color fill to the card titles (for reports and tables only).
- Fill Multicolor Theme: Assigns unique colors to the titles of each card.
- Top Border Multi-color Theme: Adds a colored top border to card titles (for reports and tables only), with each card featuring a different color.

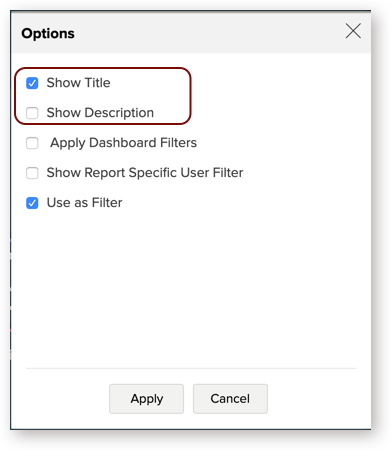
Show/Hide Report Title and Description
You can customize the reports in the dashboard to show or hide the report title and description. This option is available only in the Edit Mode.
To Show/Hide Report Title and Description,
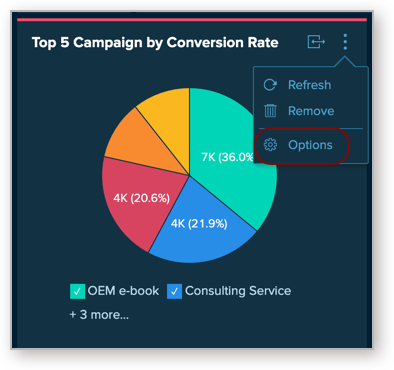
- Open the dashboard in Edit Mode
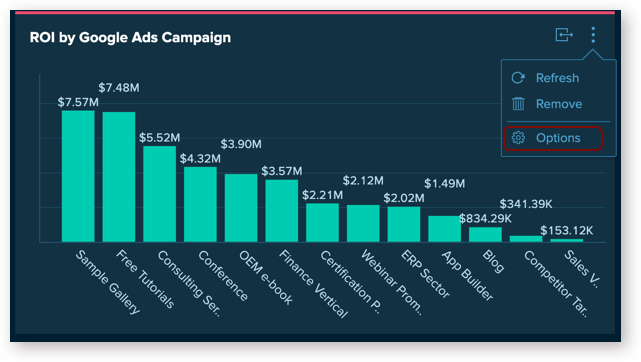
- Click the More icon that appears on mouse over and select Options.
- Check/Uncheck the Show Title option to show/hide the title
- Check/Uncheck the Show Description option to show/hide the description
- Click Apply.
Legend Positioning
Zoho Analytics allows you to customize the legend position of your chart using the Settings option available for individual charts in the dashboards.
Note
- You can also customize this from the Settings option available in your Chart toolbar. Click to learn more.
- The legend settings that you choose for the chart here will override the already set legend settings that was set while creating the chart. Also, these changes are applicable only for this dashboard.
To change the legend positioning,
- Open the dashboard in Edit Mode
- Click the More icon that appears on mousing over and select Options.
- Select the desired position from the Legend Position drop-down.
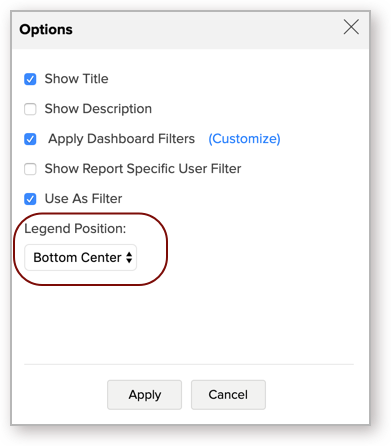
- Click Apply.
Show Report Specific User Filters
The Show Report Specific User Filters option, allows you to show/hide the user filter created for that specific report. This option allows you to apply filters on a specific report without disturbing the other reports. By default, this option will be unchecked.
To enable this option,
- Open the dashboard in Edit Mode
- Click the More icon that appears on mousing over and select Options.
- Select Show Report Specific User Filters option
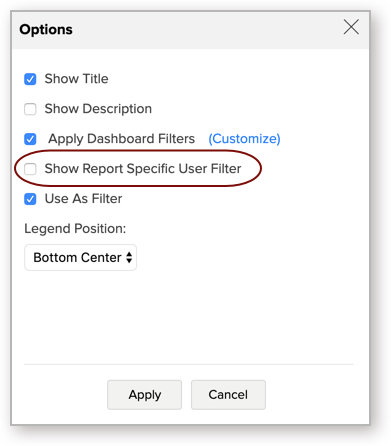
- Click Apply.
Note
- Please note that you can apply a user filter at a report level and a dashboard filter (user filter at a dashboard level) at the same time. In this case, both the criteria will be applied.
Include/Exclude Dashboard Filters
Dashboard user filters will be applied over all reports in the Dashboard, by default. Sometimes, you want your reports to remain unchanged regardless of the filters applied in your dashboard. For example, if you have a report comparing current and previous year performance, filtering by year will make it lose its purpose.
In Zoho Analytics, you can easily include/exclude the Users Filters from being applied on a specific report using the Apply Dashboard Filters option.
You can also use this option to map the appropriate columns to be used for filtering, in case the user filter and the report are based on different tables.
You can use this option as shown below.
Allow Reports to Act as Filter
You can set reports to act as a filter in your Dashboard. With this, you can click on any data point and filter all other dependent views in the dashboard. Zoho Analytics allows you to specify whether a specific view can act as a filter or not.
Follow the below steps to do this.
- Open the dashboard in Edit Mode.
- Hover the mouse over the view which you do not want to act as a filter. Click the More icon that appears and select the Options.

- In the Options dialog, Select the Use As Filter checkbox to allow the report to act as a Filter. When you unselect the checkbox, you will not be able to filter using this report. When you filter the dashboard using other reports, this will not be affected.
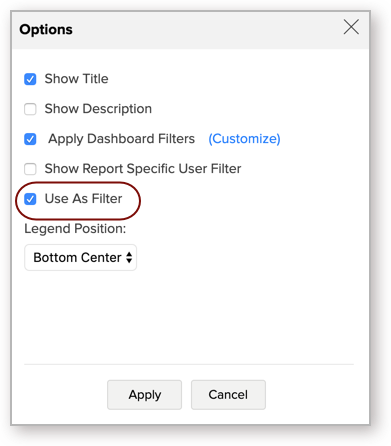
- Click Apply.
