Gantt Chart
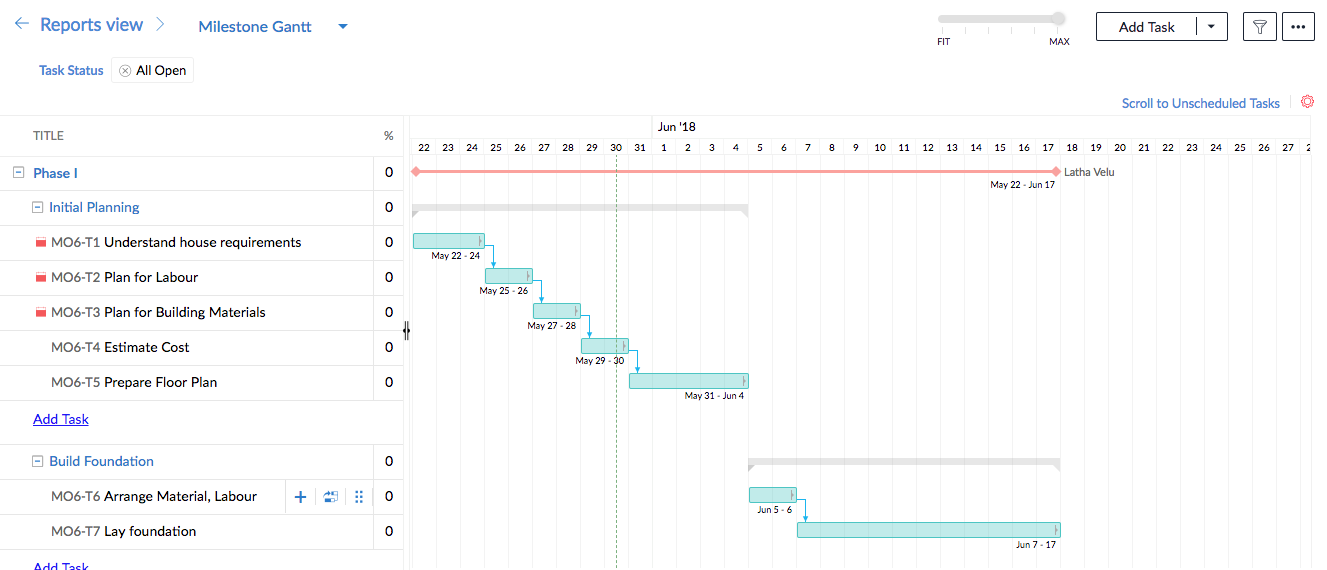
A Gantt chart provides a graphic illustration of a schedule that helps in planning, coordinating, and tracking specific tasks in a project.

The end user of the Vertical CRM solution in which the Zoho Projects extension is added to can view different types of reports. To view reports, follow these steps:
- Log in to the Vertical CRM application.
- Select the Projects tab in the top navigation bar.
- Select the tab in the inner navigation bar corresponding to the project you want to work on.

- Click Reports in the left navigation bar and select Gantt Chart.
Two types of Gantt charts are supported in Projects - Milestone Gantt and Chronology Gantt. You can perform the following operations on them:
- Add Task: Add new tasks to the project
- Add Task List: Add new task lists to the project
- Filters: Use the filters Milestone, Milestone Status, Task Status, and Task Owner

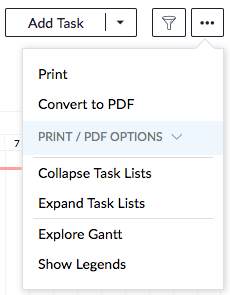
- Print: Print the Gantt Chart
- Convert to PDF
- Fit to Width: Adjusts the data in the chart to the width of the page
- Chart in View: The data in the chart is replicated as seen on screen. You can also choose to encrypt the file.
- Collapse Task Lists: Collapses task lists in the Gantt chart to display them at both milestone and task list levels
- Expand Task Lists: Lists all the tasks. This is the default view.
- Show Legends: Displays all the color codes used in the Gantt chart.

- Scroll to Unscheduled Tasks: Shows all the tasks which do not have Start- Due dates.
- Dependency Settings:- Save the settings which determine how the successor and predecessor tasks are related and rescheduled.
- Fit-max: Click Max to maximize the Gantt chart or Fit to fit to the screen width and rescale the chart.

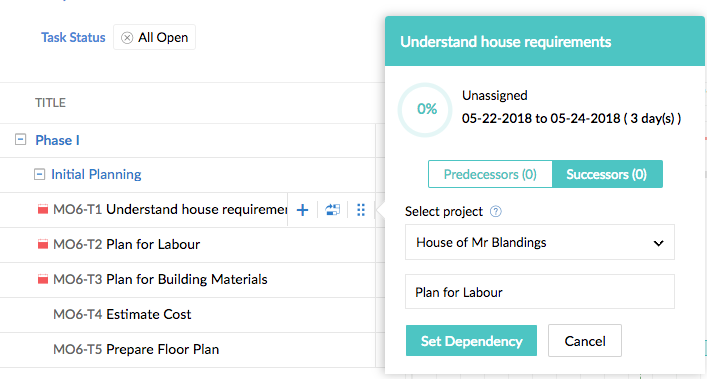
- Add Predecessor or Successor: Add dependent tasks to an existing task.
- Move the cursor over the name of the task.
- Click Successors > Add Successor.
- Type the name of the task to add as successor and click Set Dependency. The dependency can also be removed.

- Overdue: Red next to the name of a task indicates that the task is overdue.


