Crashes
Overview
Crash reports enable the app developers to pinpoint the exact root cause of any exception or issue that occurs in real-time. In Apptics, you can quickly identify why issues occur and the attributes that are impacted by an individual issue, i.e, app version, OS version, affected devices, device model, device id, etc.
An issue is a reason why an app crashes. There may be multiple crashes because of the same unique issue.
To start tracking the crashes in your app, integrate our SDK with your app.
- Integrate our SDK with your Android app.
- Integrate our SDK with your iOS app.
- Integrate our SDK with your Windows app
Crash dashboard:
- Navigate to Quality > Crash.
- The Crashes graph shows the total number of crashes across brands i.e. Apple, Google, or Microsoft for the selected date range.
- You can see the total number of crashes that happened, the unique issues that caused them, the unique devices that were impacted, and the percentage of crash-free devices for the selected date range.

- Scroll to the bottom and you will see the unique issues list. It provides the details available for each Unique Issue (UI) such as the issue description, the impacted OS version, and App version, the total number of crashes, and the total number of affected devices.
- You can also update the status of individual issues, i.e., whether they are still open (unattended), or closed (addressed) successfully.

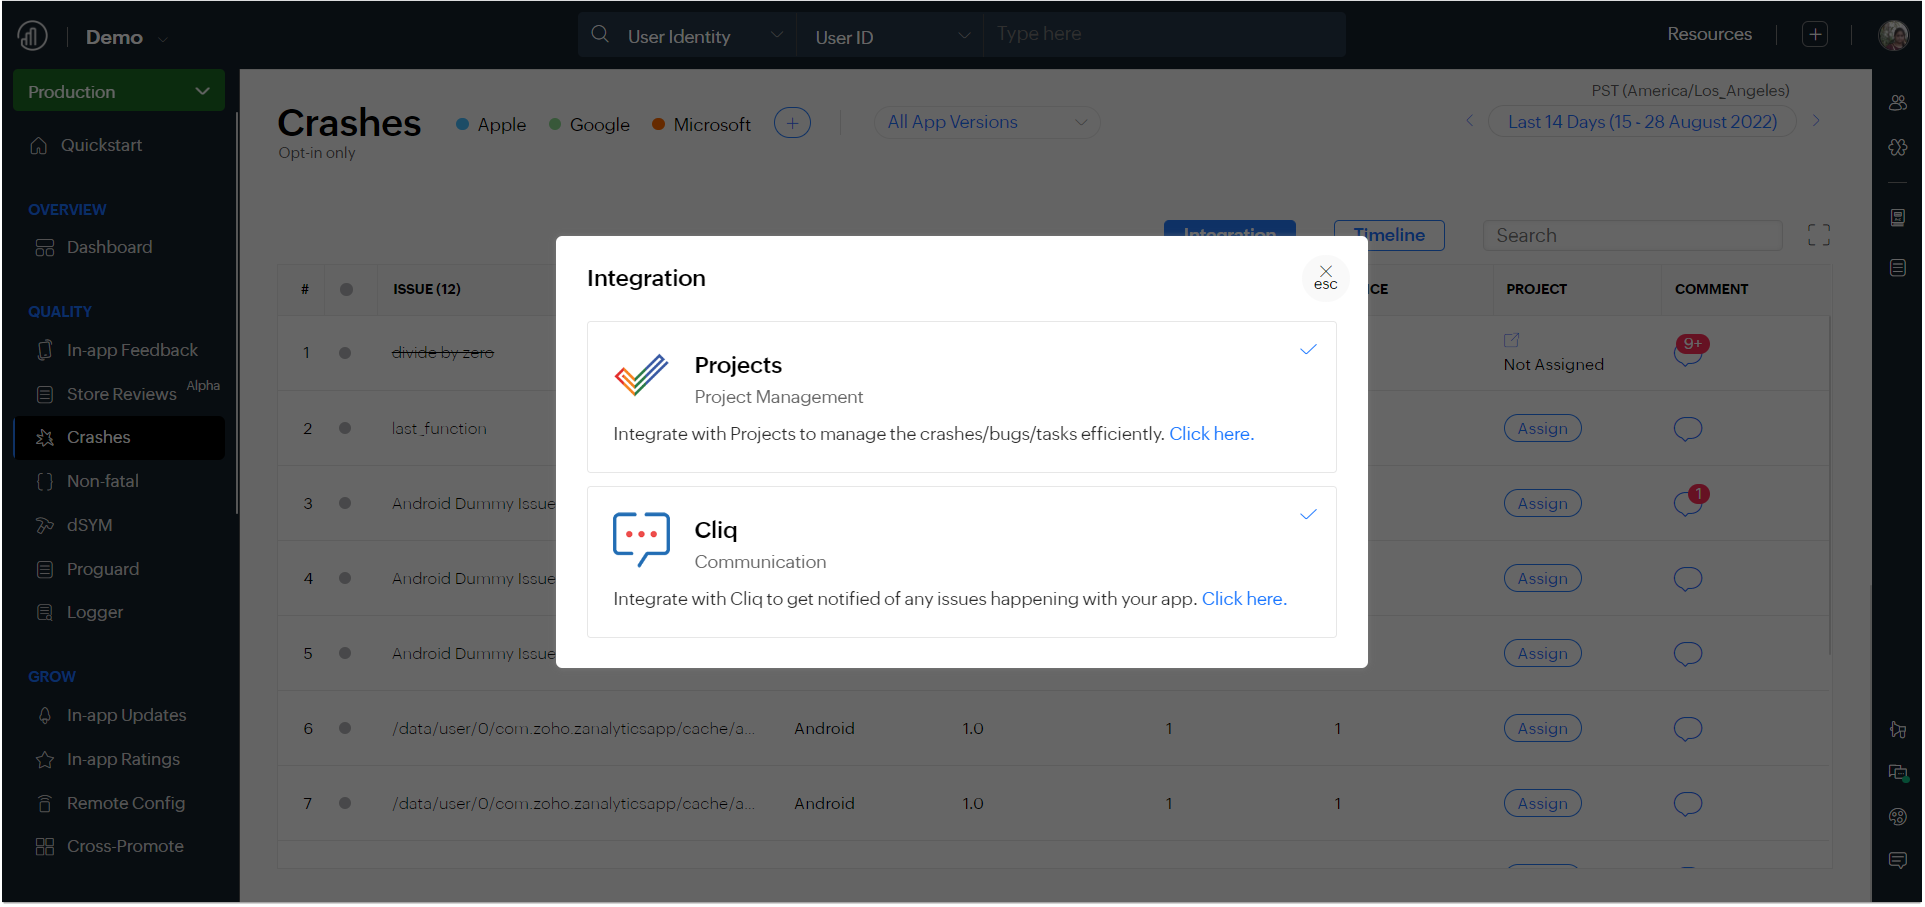
- If you are using Zoho Projects, you can integrate it with Zoho Apptics to assign these issues as bugs and manage them efficiently.
To enable Projects integration, follow the steps given below.
- Either click on Integration > Projects > Configure.

- Or, navigate to Settings > Integrations > Projects.

- Choose the application ID and configure integrations for Crash, Non-fatal, and In-app Feedback.
- Once you have enabled the Zoho Projects integration, you will see an additional column in the Unique Issues list as 'Assign'.
- Click Assign to assign the individual issues as bugs in Zoho Projects.
- Fill in all the details in the pop-up and click Assign Bug. The issue will be assigned to the developer and added to the bug tracker.

Crash reporting:
- Click on the individual issue in the unique issues list to get more details.
- The timeline gives you the total number of crashes, the unique number of affected devices, and the affected app version.
- An issue stack trace is available to help you solve the issue.
- Click on crash_log.txt to download the log for the issue.
- You can also view the raw data available about the issue by clicking on the <> Raw text button.
- Click All affected devices to see the details.
- The All affected devices list will have details such as device model, App version, OS version, device ID, the time at which the crash happened, and when it was received in Apptics.
- Click on the individual affected device to view the complete timeline of crashes that have happened to the device.
- The Timeline will give you the details on the device state such as
- SDK version
- App release version
- OS type and OS version
- Battery level
- Network type or Wi-fi strength
- Screen orientation
- RAM size
- Device Id
- Device model

- You can also find the trace of the events, API calls, and screens that might have caused the issue.
- The events trace shows the events that occurred when the issue occurred.
- The API calls trace shows the list of all the API calls that were triggered while the issue occurred
- The screes trace shows the list of all the screens that were visited when the issue occurred.
- Click on view custom properties to check if any custom properties are available for a particular crash.
- Click PII is Available to get the User ID and click on Email Address Available for the Email Address.


