Powerful analytics for Zoho Inventory
Manage your stocks better and sell smarter with Zoho Inventory Advanced Analytics. Analyze and uncover insights about your products, stocks, orders, sales, and much more. Share insights and make data-driven decisions.
Sign up in less than 60 seconds

Analyze and optimize your Inventory stocks with powerful insights
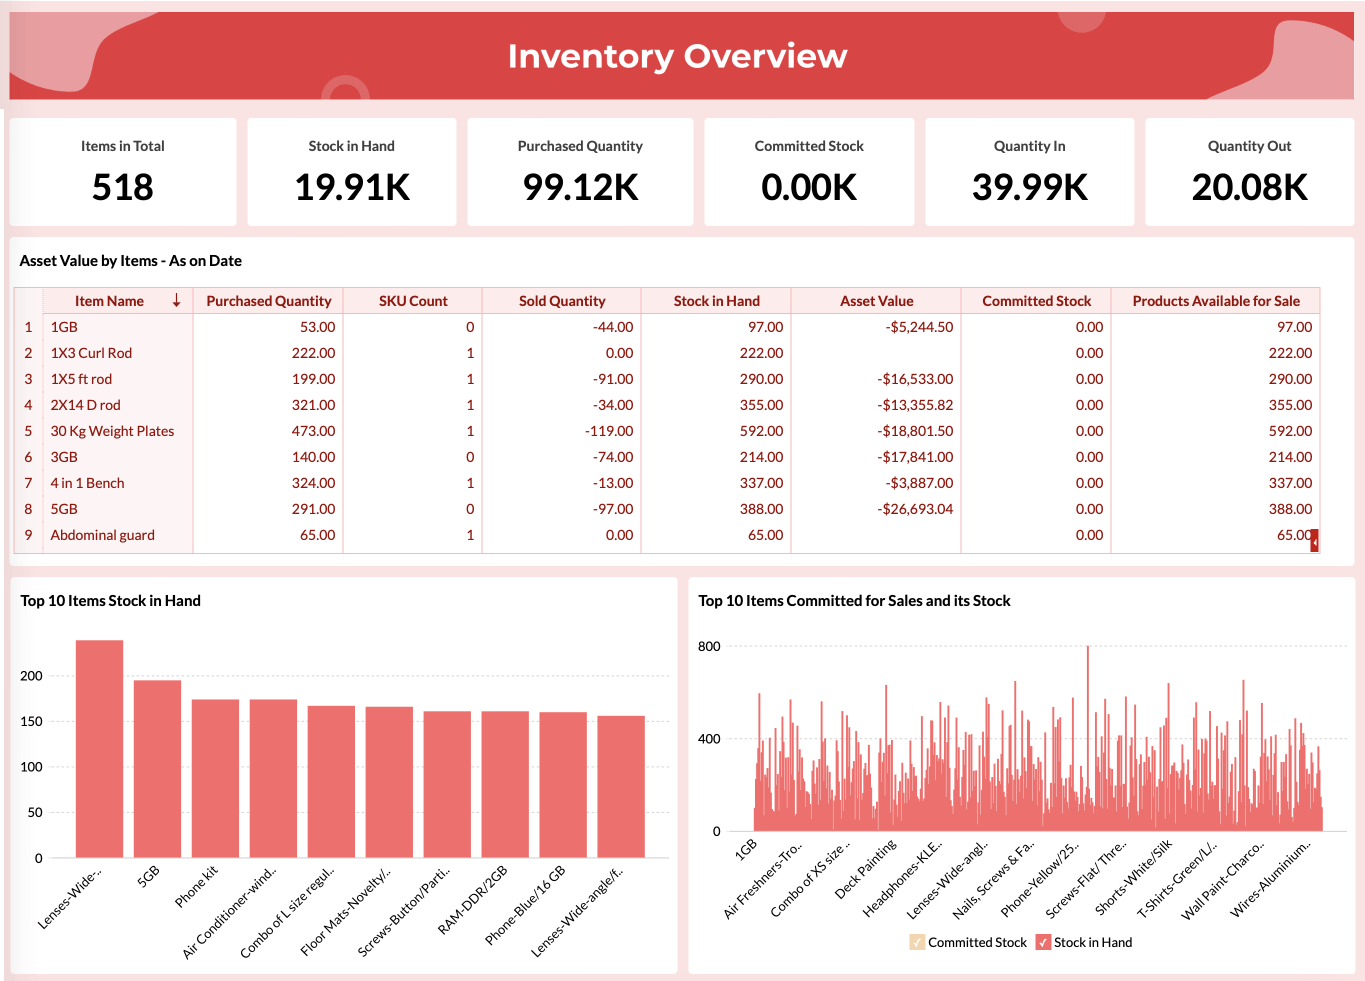
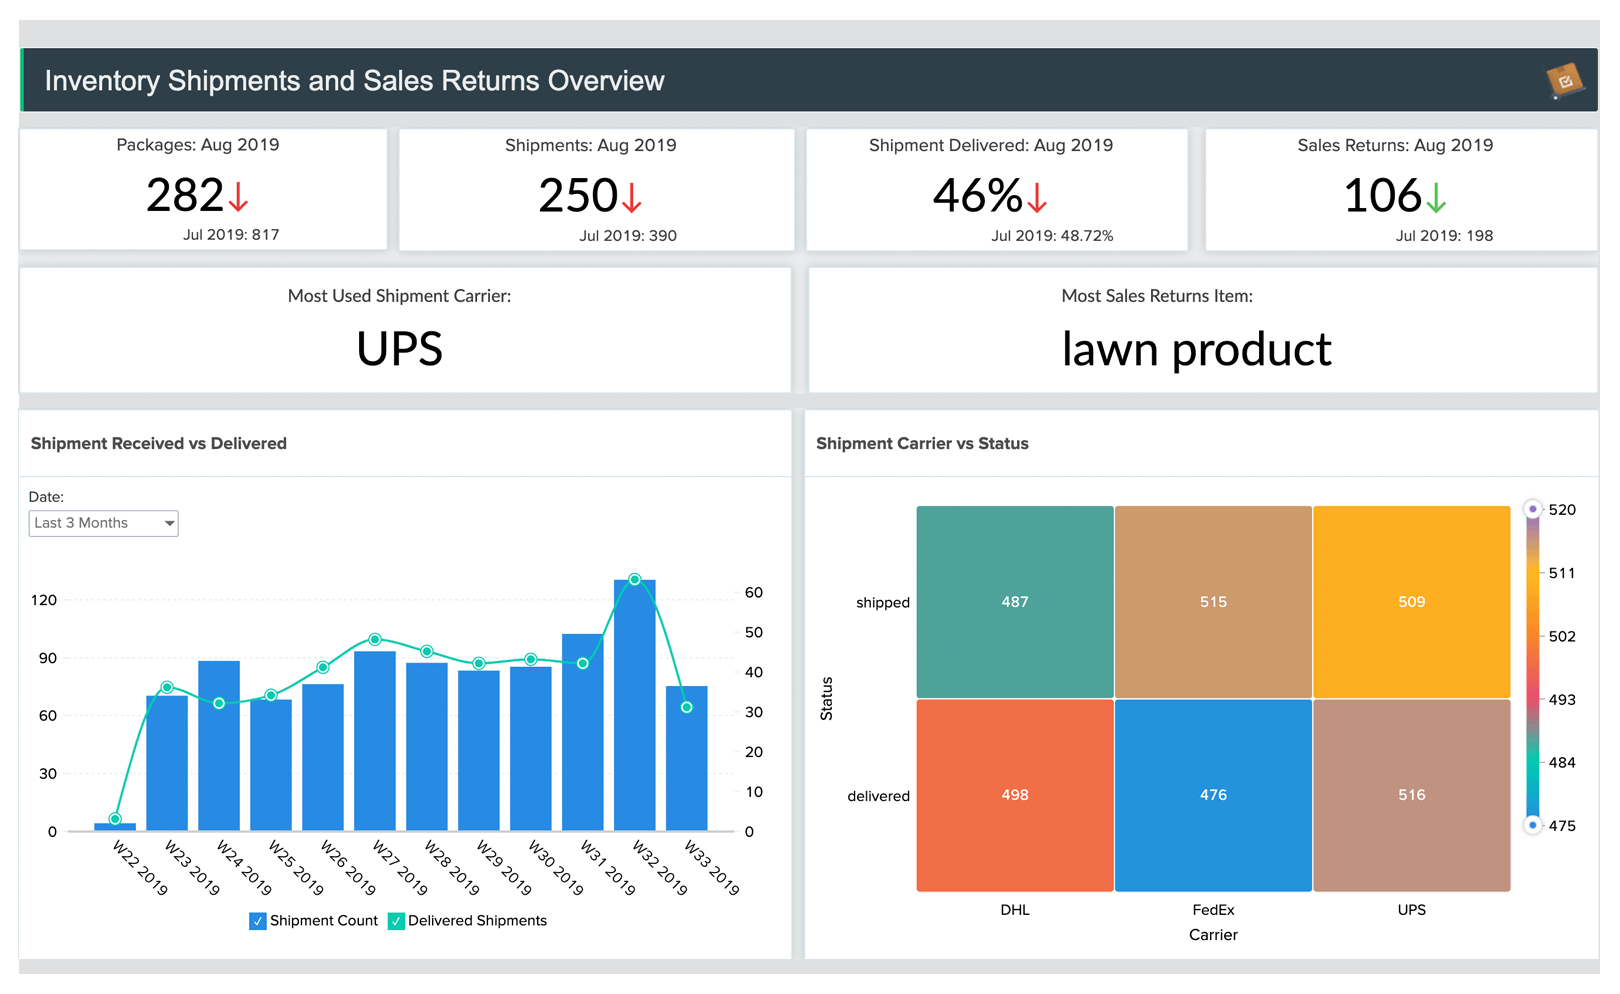
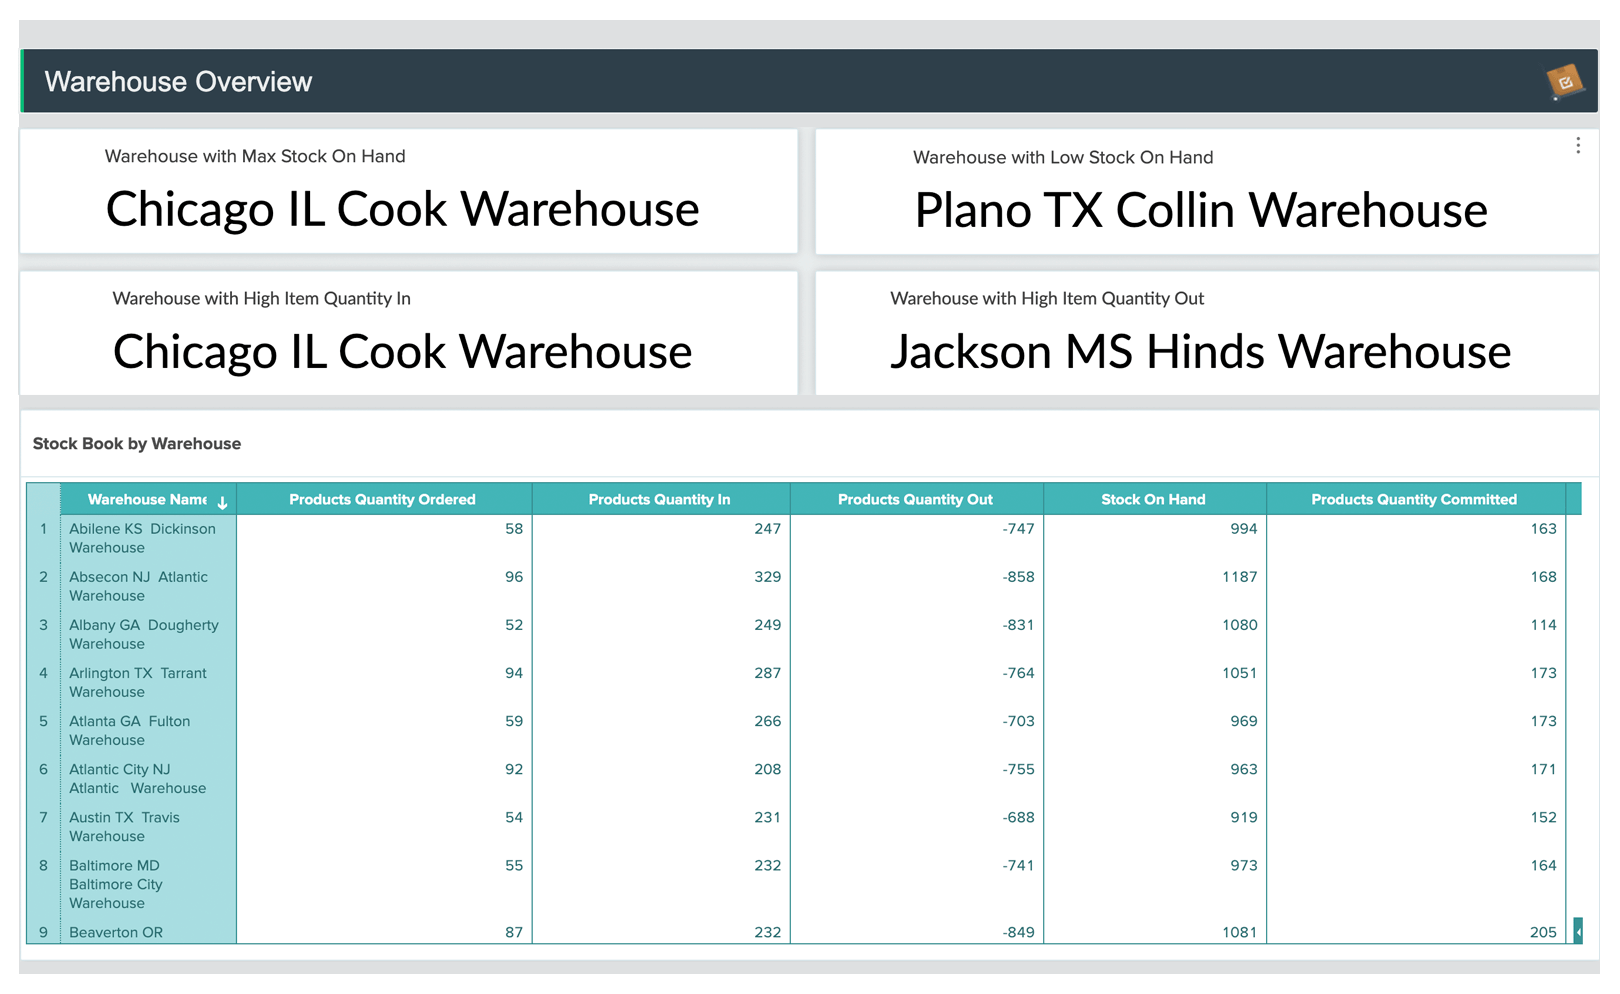
Uncover hidden insights from your raw data
2 Million Users. 50 Million Visualizations. 1 Analytics Platform.
Pre-built visualizations
Kick start your analytics journey with 50+ pre-built visualizations or build your own ad hoc reports and dashboards with an easy-to-use, drag-and-drop interface.
Collaborative analytics
Develop & analyze reports together with your operations team. Share and embed your visualizations for wider consumption.
Email, export and print reports
Export or print reports for offline access. Scdule your reports and dashboards to be emailed automatically to the given recipients.
Data blending
Combine data from different sources and create cross-functional reports. For example, blend data from Zoho Inventory and Zoho CRM to build a Sales vs Returns report.
Smart analytical assistant
Type out your questions, and see Zia, our AI-powered assistant, come up with suitable answers in the form of reports and KPI widgets.
Embedded analytics
Get a powerful BI, reporting, and analytics solution in your own brand name, embedded within your product/application or set up as a standalone portal.
Learn more
Other related connectors
View more"We use Zoho Analytics to integrate all of our analytical needs. Everything goes to Zoho Analytics, that way everyone is able to access the most critical info about the company. They can not only access it but explore it, dive deep, ask questions. It's super-fast, easy to use and affordable."

Juan Martitegui
Founder, Educatemia