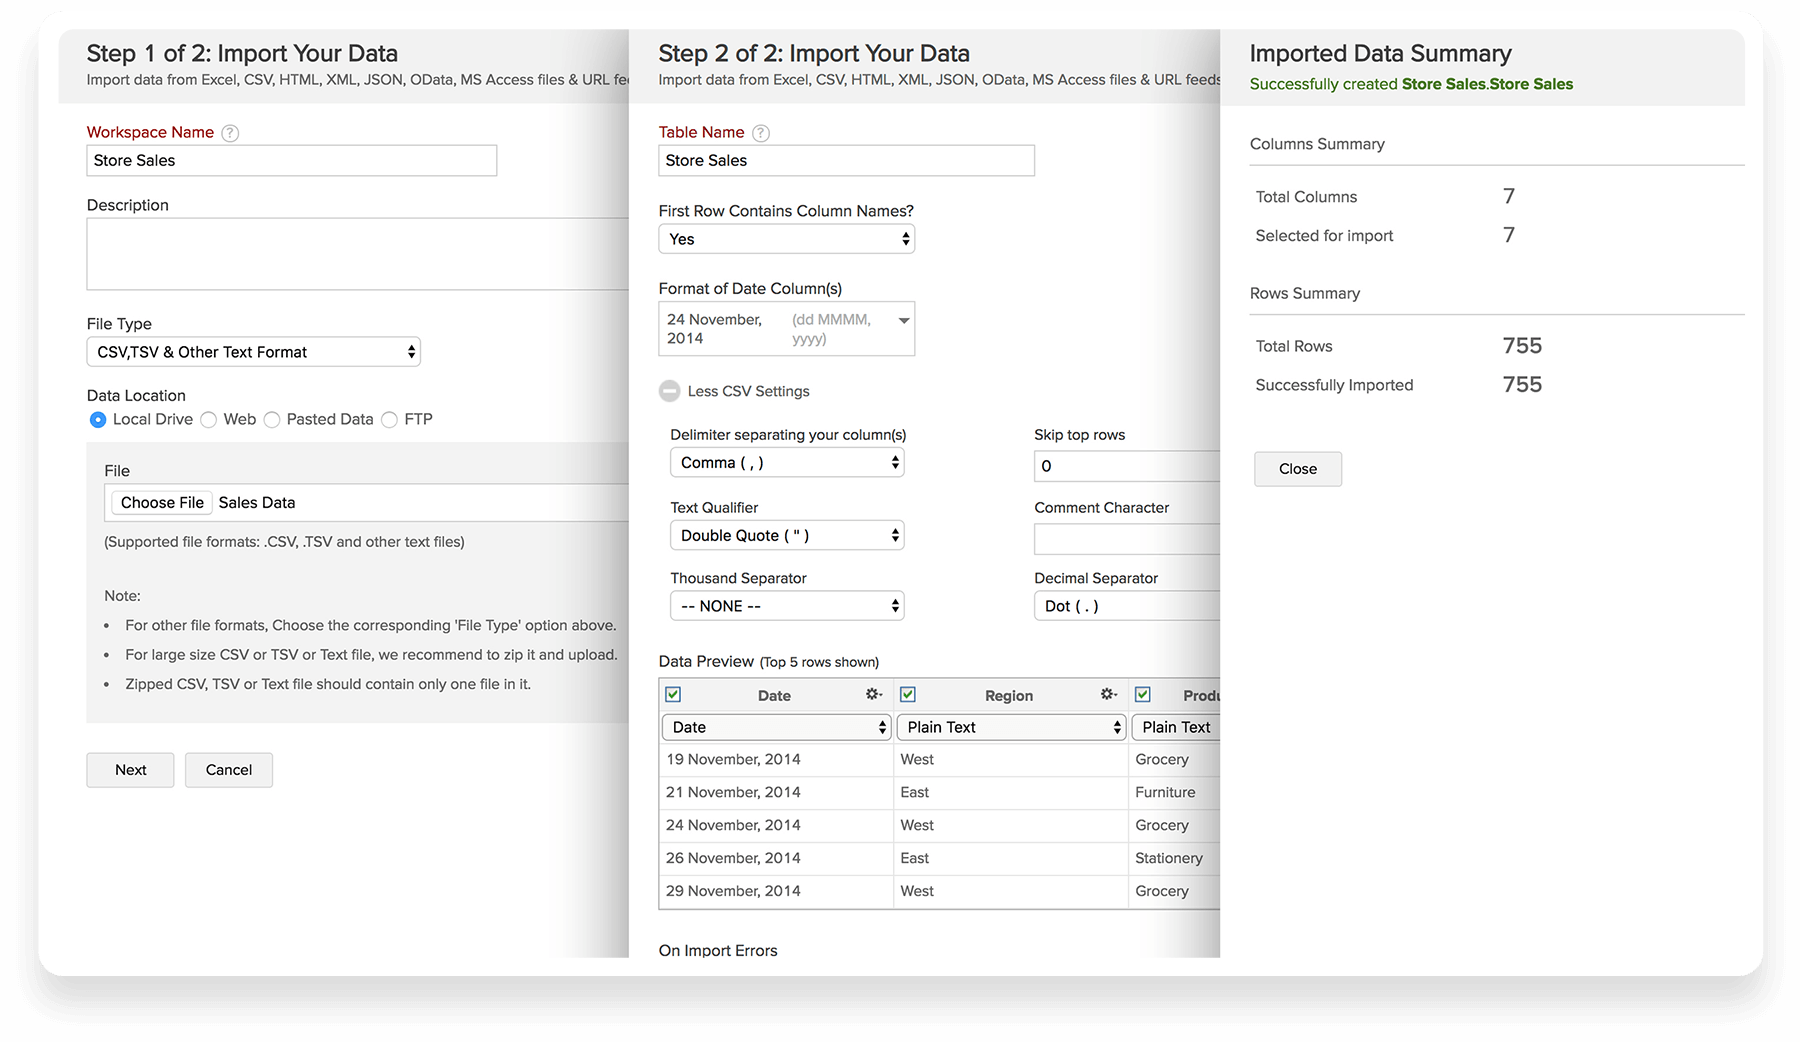
Get Data
Import Data
Easily import and synchronize your business data scattered in flat files, feeds, databases, cloud storage services and online/offline applications into Zoho Analytics for analysis & reporting. Data sync is automatic with periodic scheduling. Learn more

Easy Setup
Get data from any of your data sources using a simple to follow wizard. Choose what data to import, how you want to import and when to import in easy steps? Imported data are stored in entities called 'Tables'.
Prepare Data
Zoho Analytics offers wide range of options to prepare your data for effective analysis. You can format, add calculated fields, split columns, cleanup data, merge data and do much more.
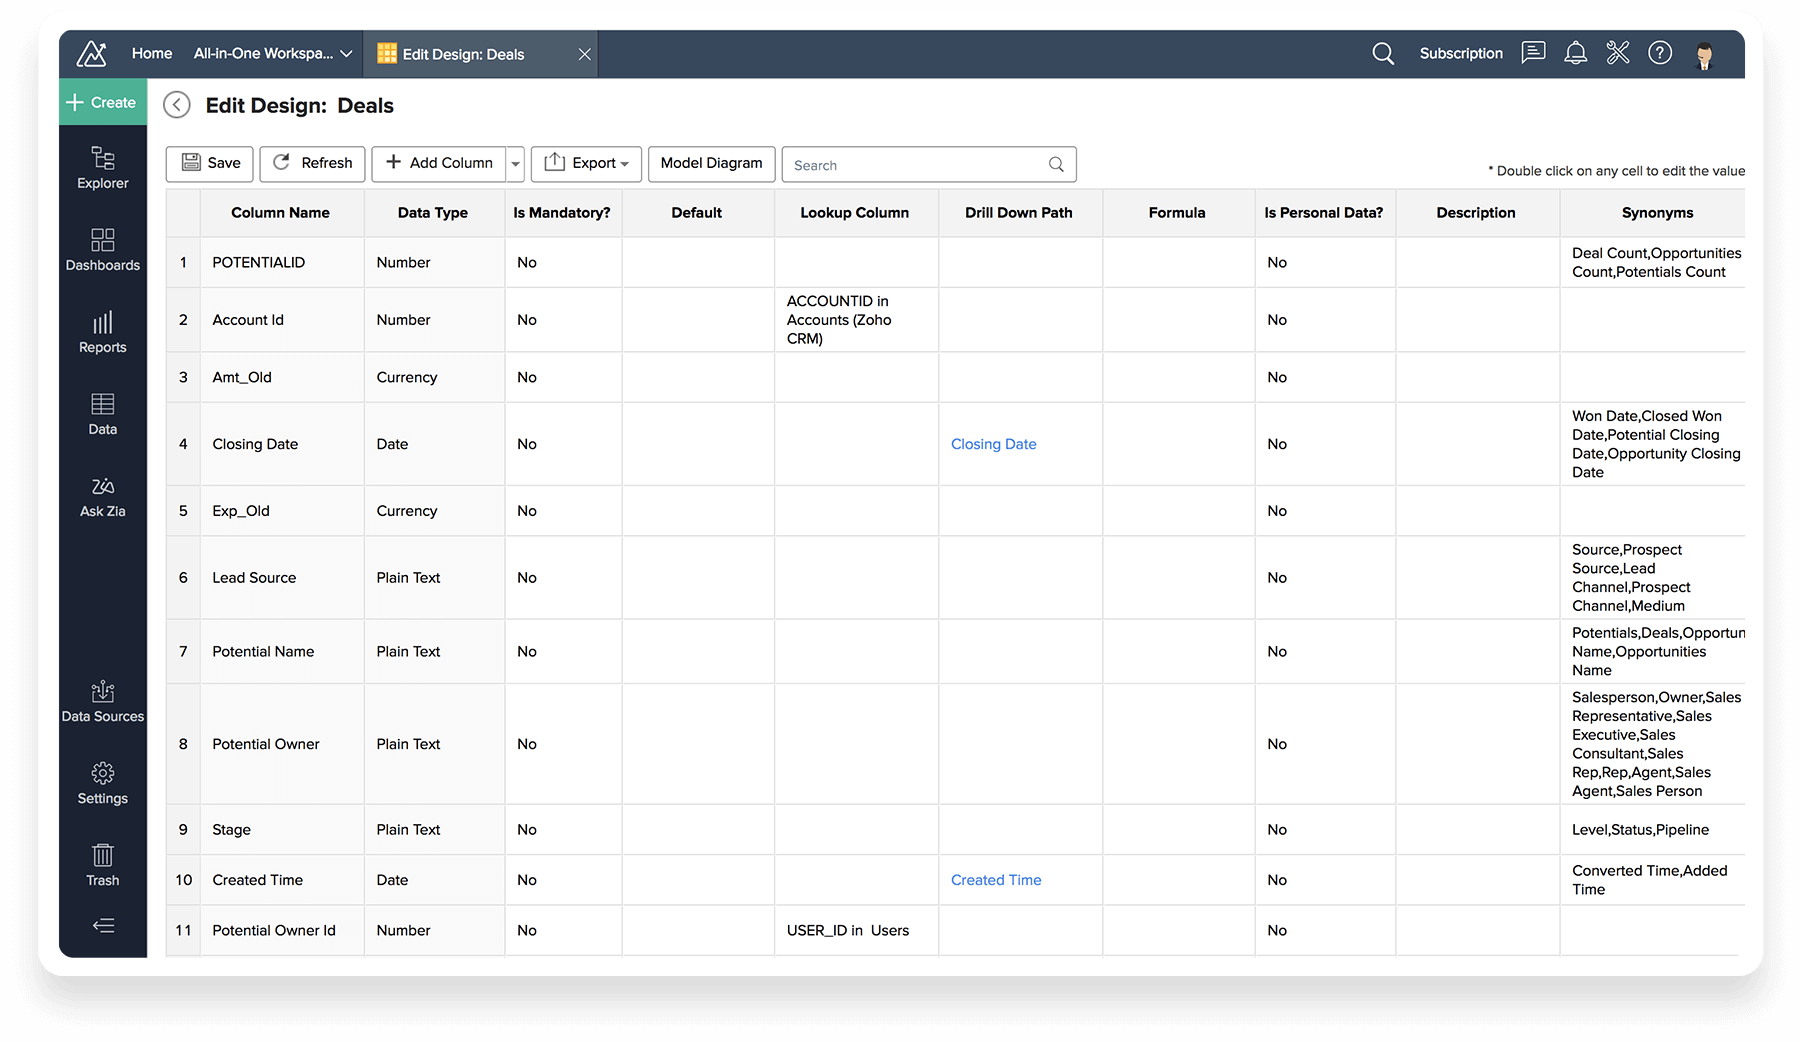
Data Blending
You can link connected data sets through lookup columns. This enables you to create reports & dashboards blending data together across different data sources.
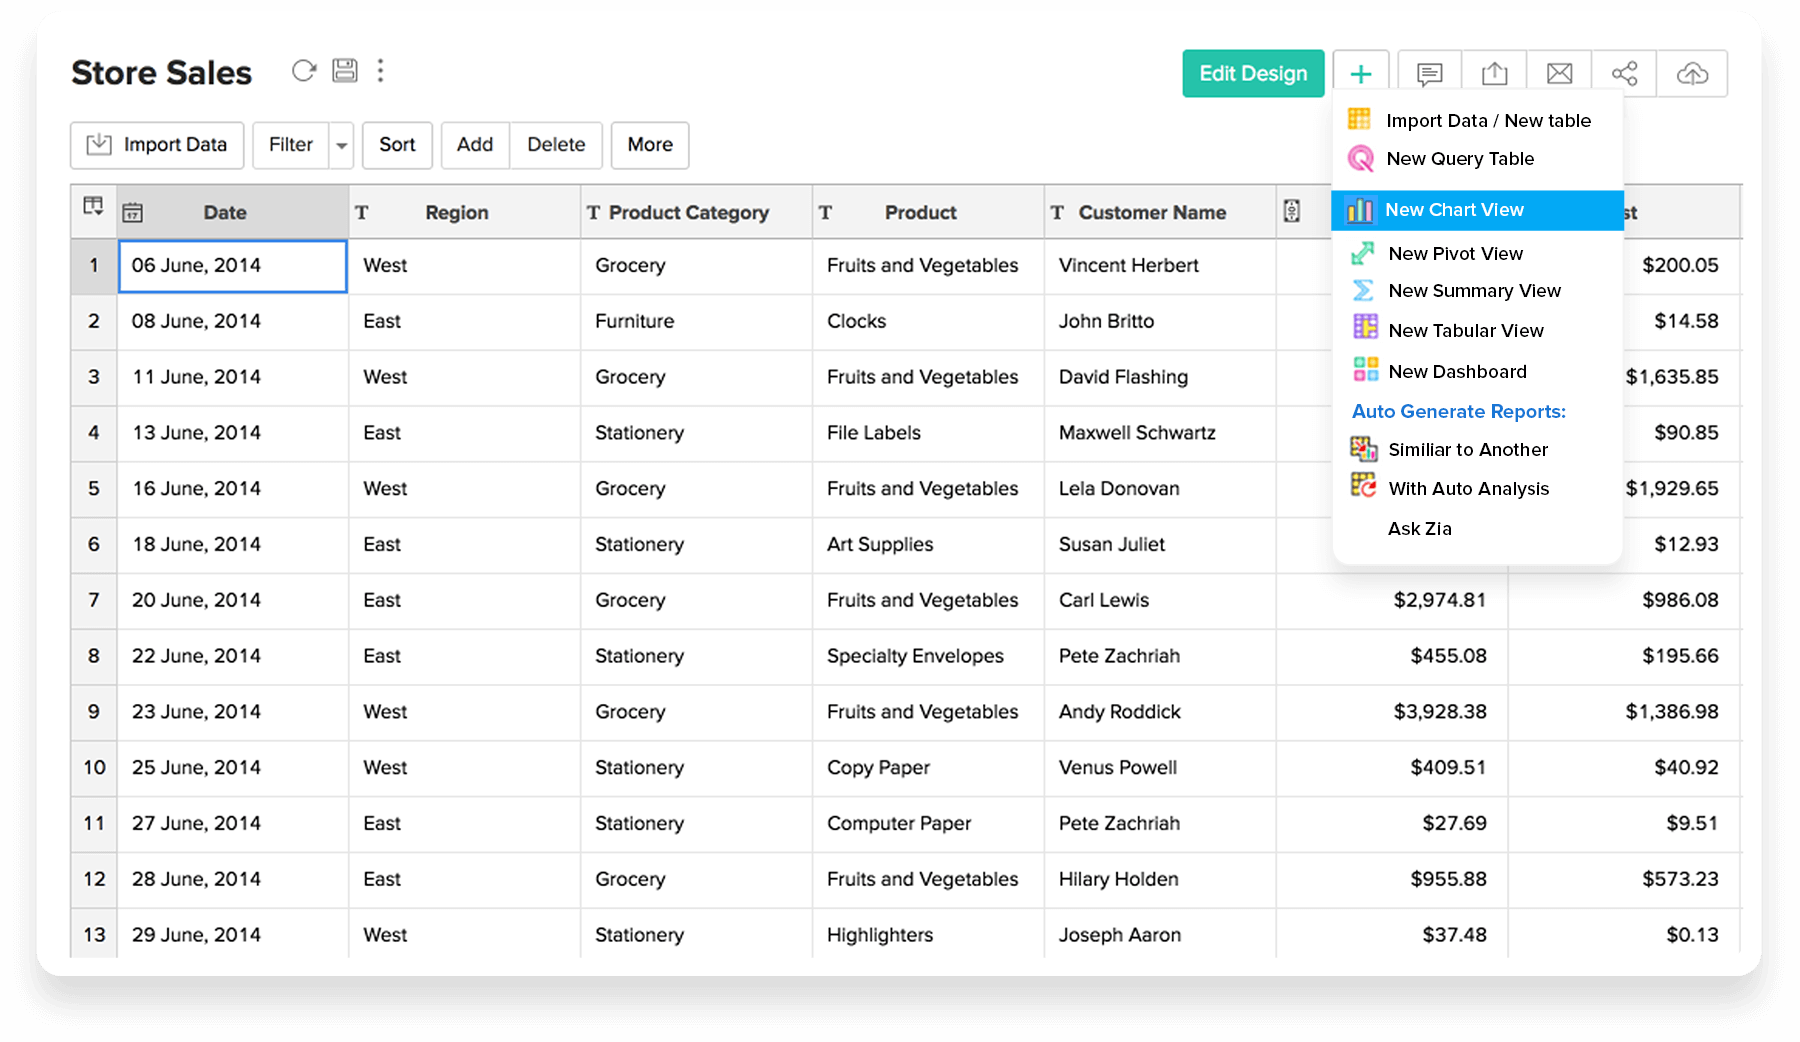
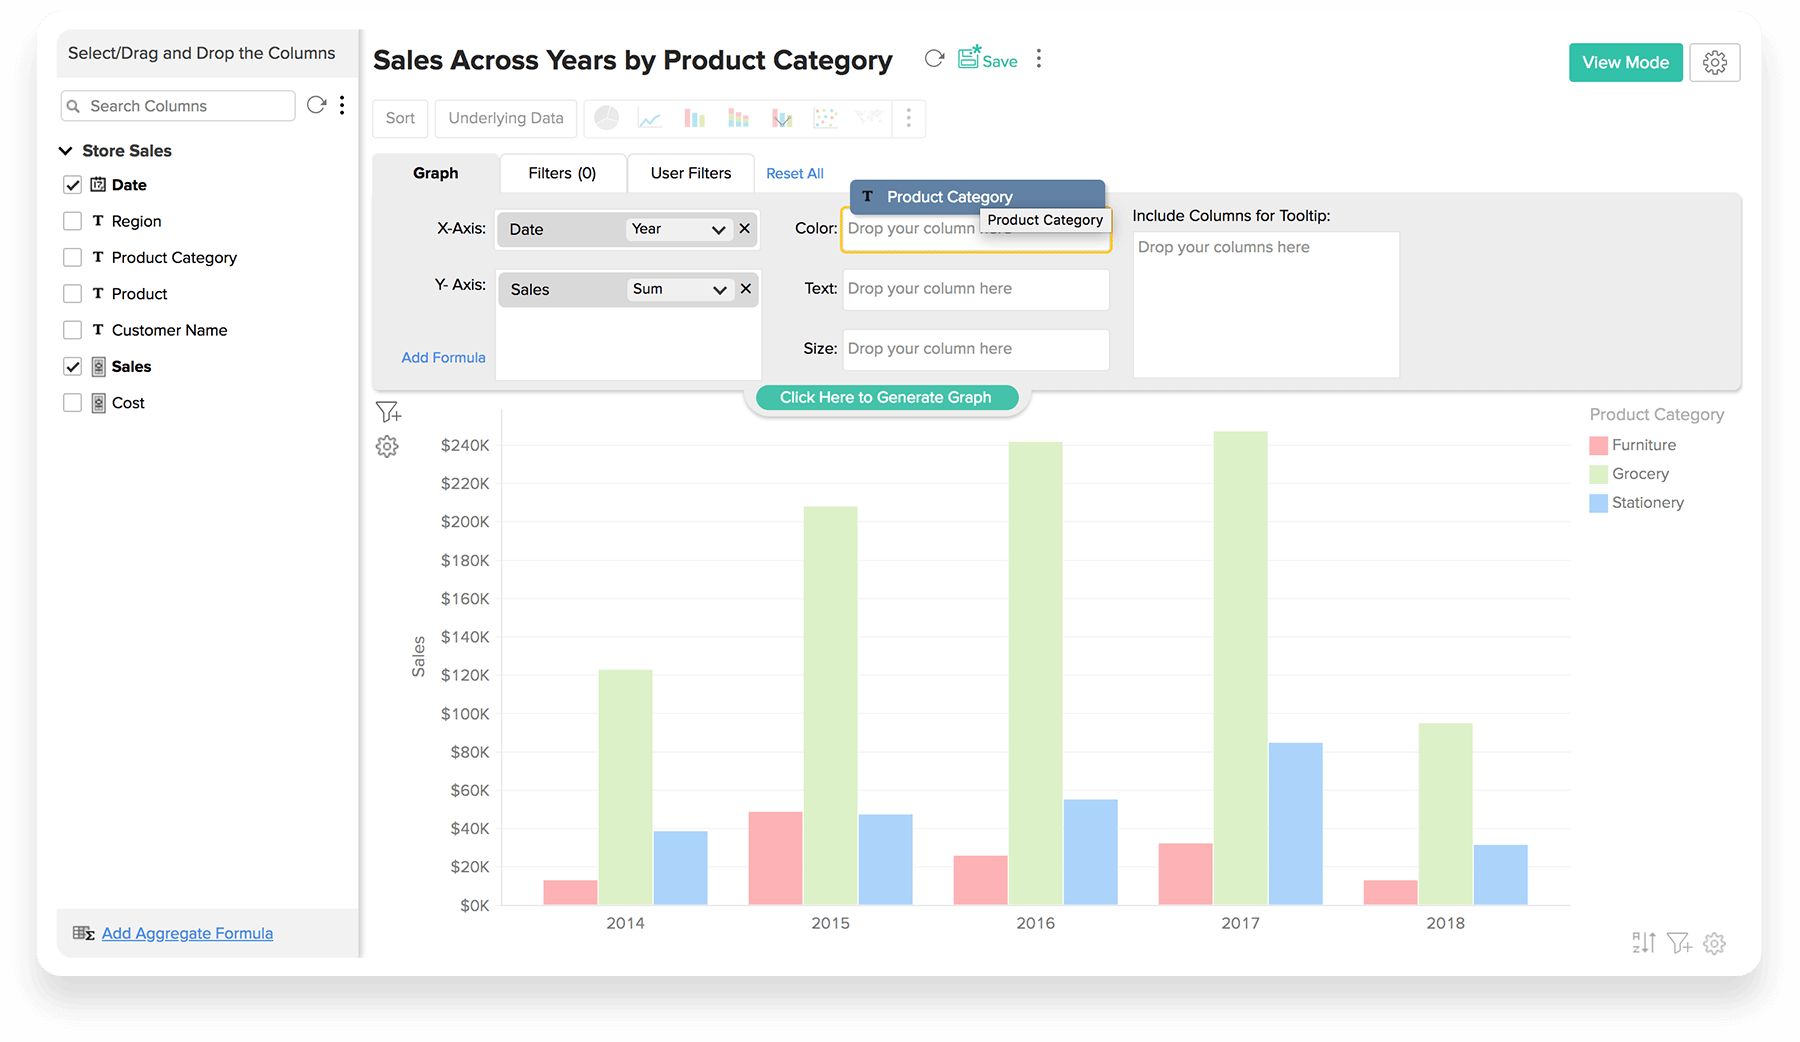
Charting
Chart Creation
To create a chart, click New -> New Chart View, upon selecting the corresponding data table.
Drag & Drop
Use the intuitive drag and drop based designer to construct the required chart. Drag the columns listed on the left pane and drop them in the appropriate shelves in the design area. Learn more
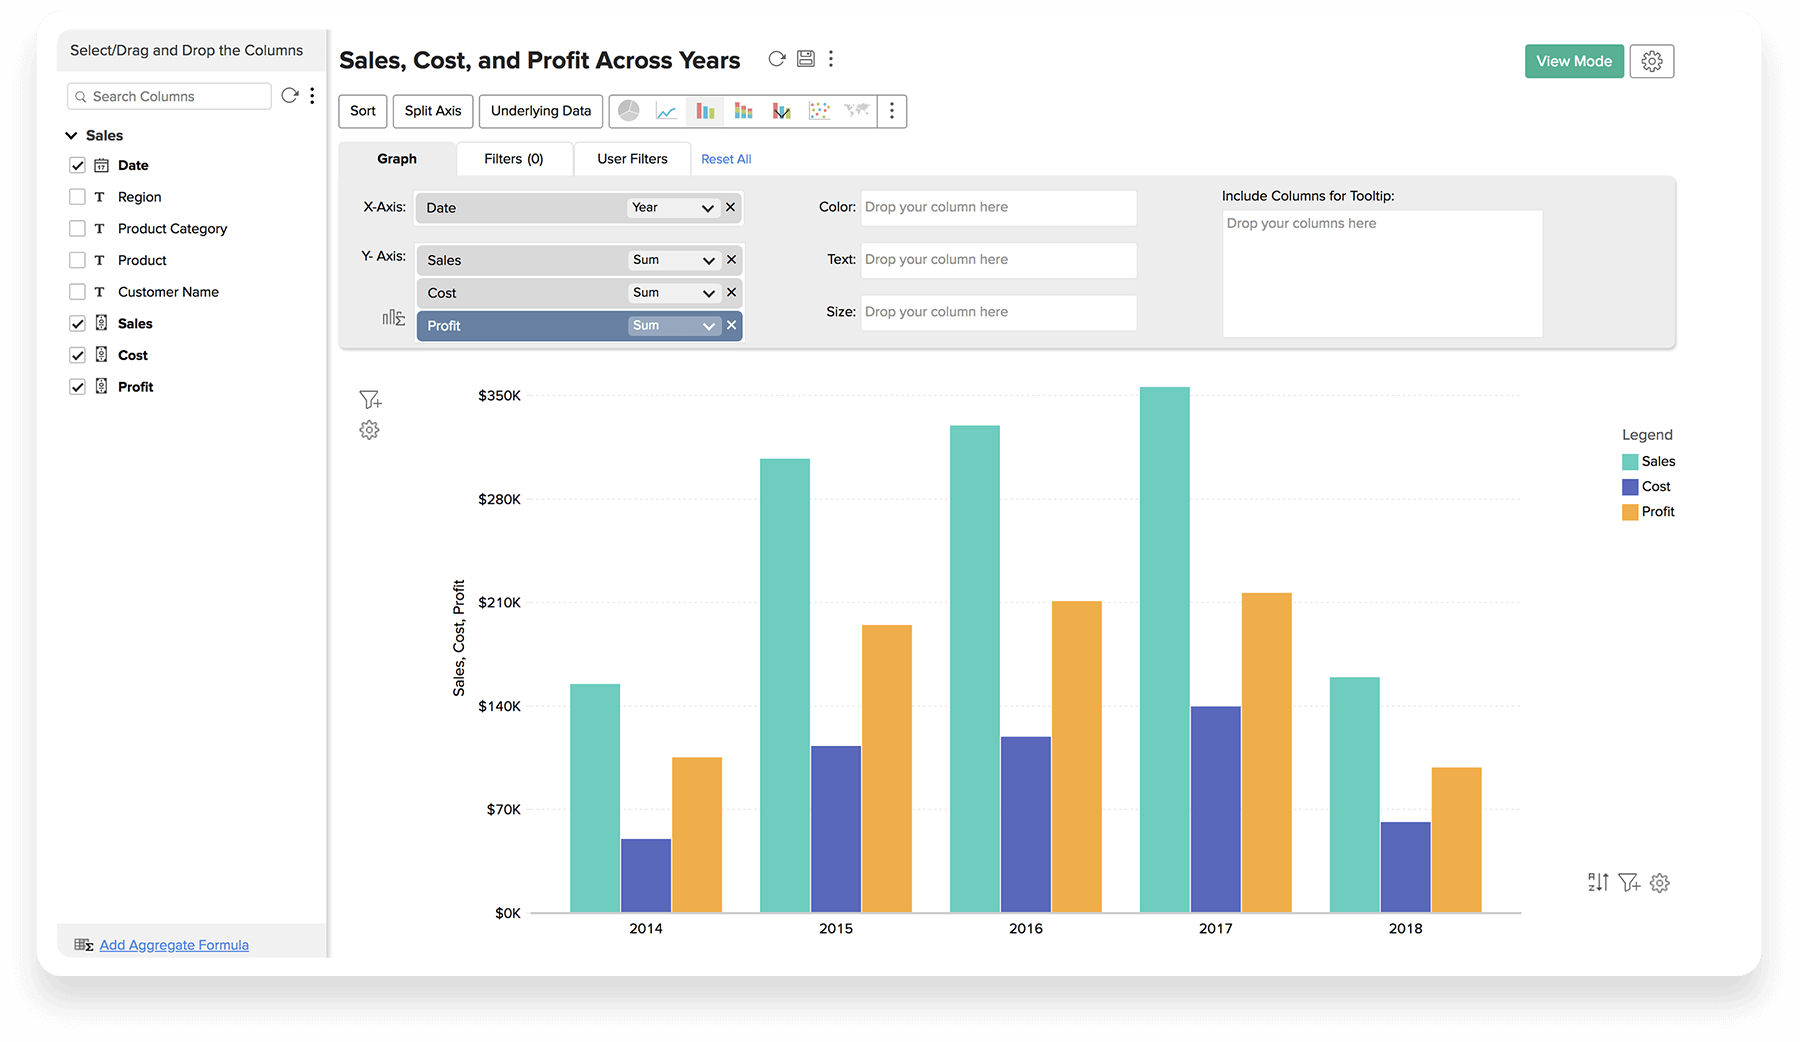
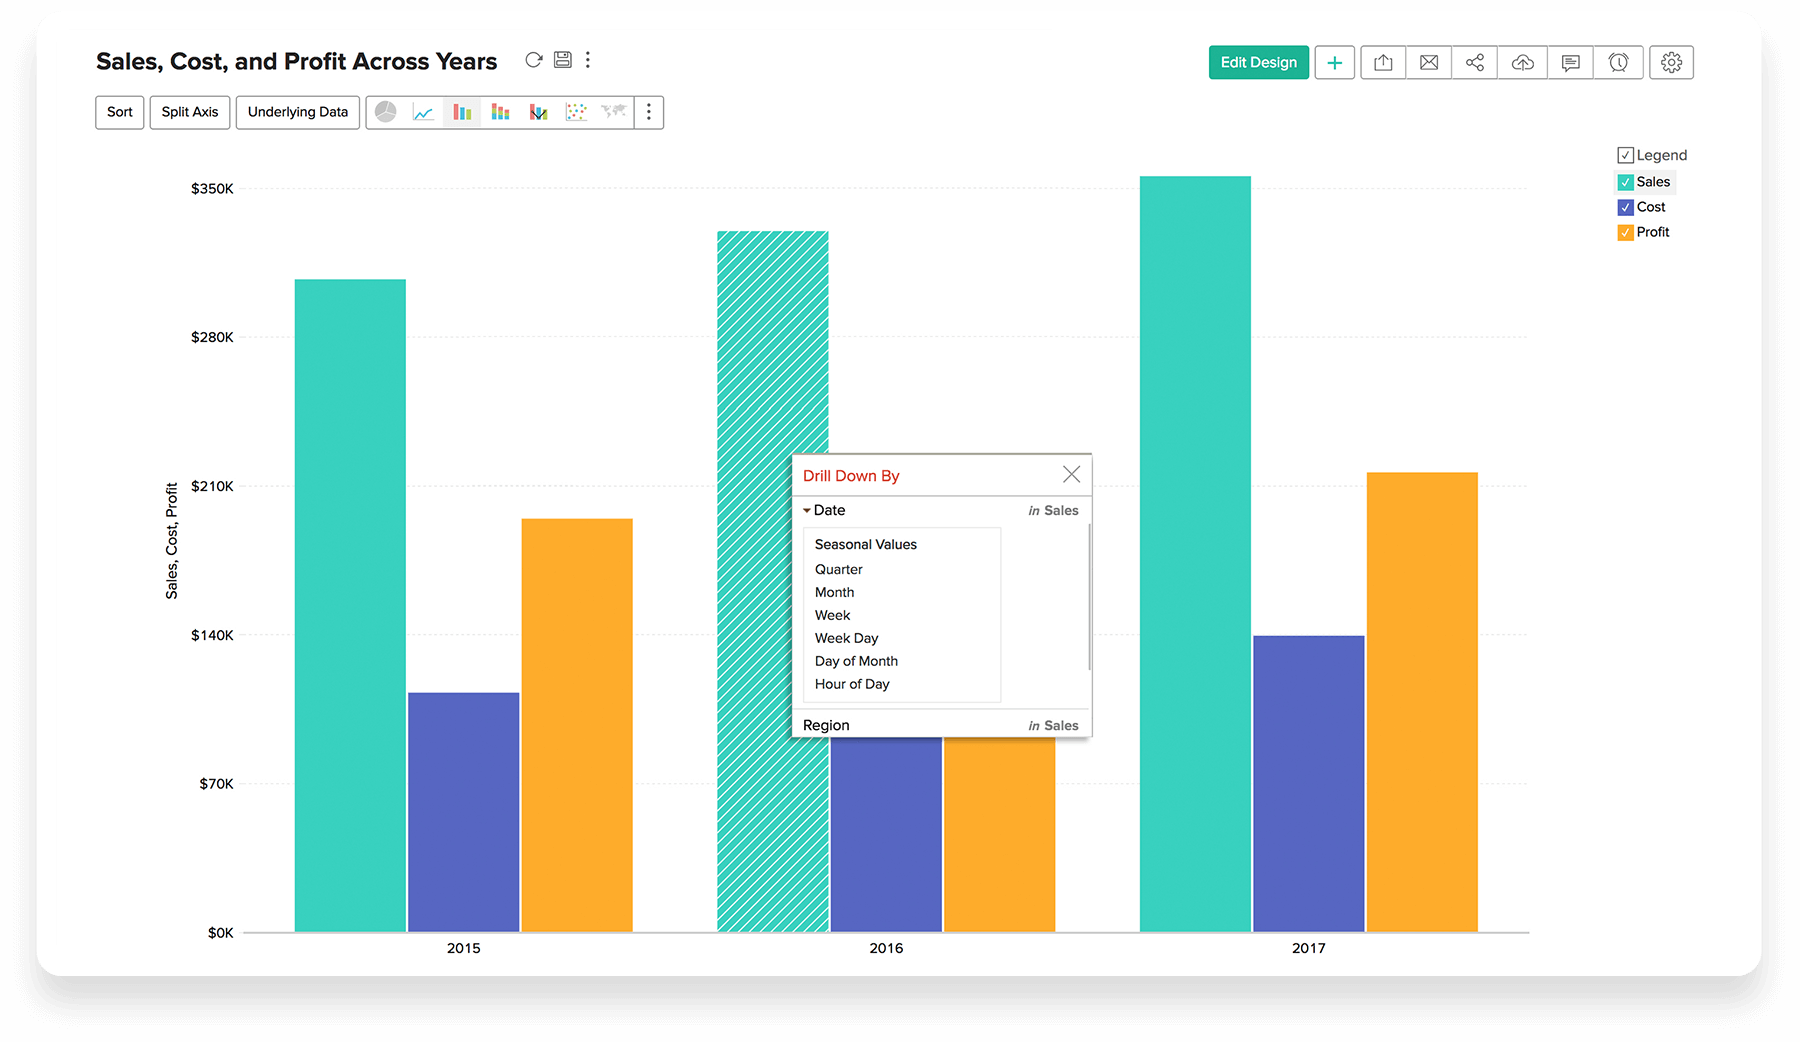
Multiple Y - Axis
You can create charts with multiple Y - axis. Example chart shown has Sales and Cost in the Y-axis.
Applying Powerful Filters
You can apply powerful filters over charts by selecting the Filters tab in the design area. These are design time filters applied when you create a chart. Learn more
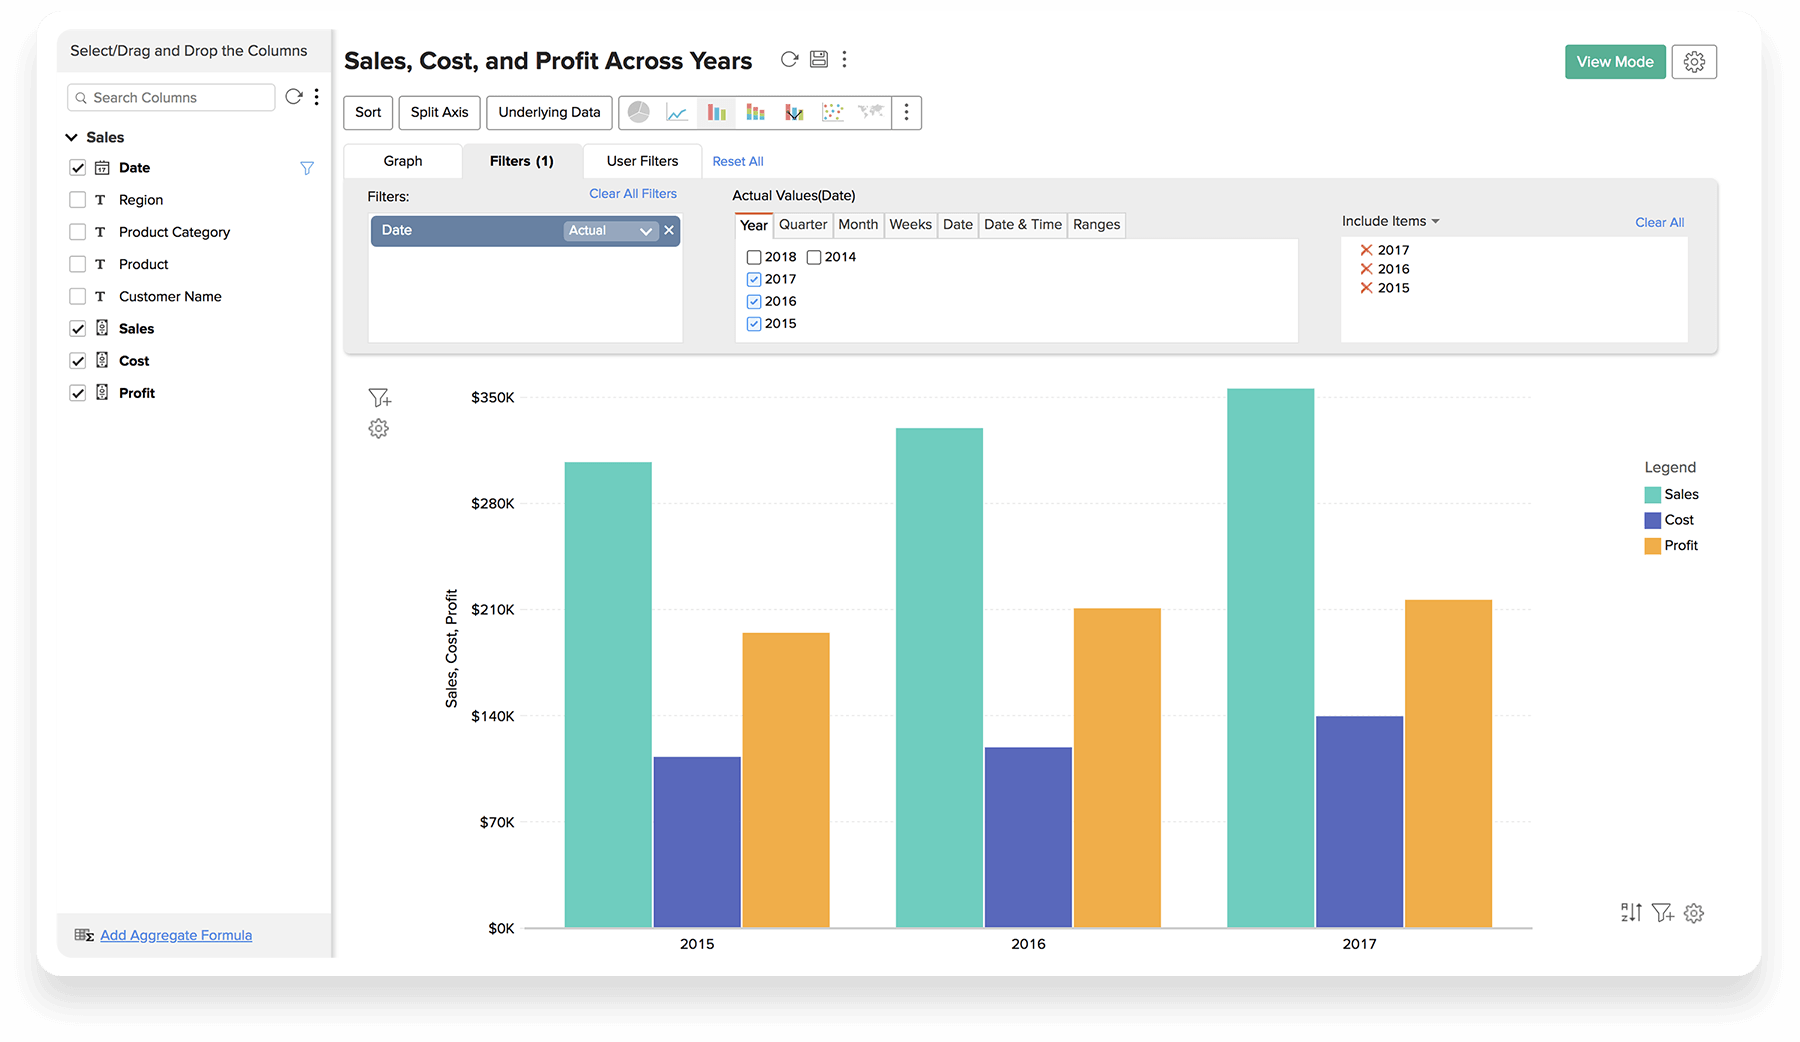
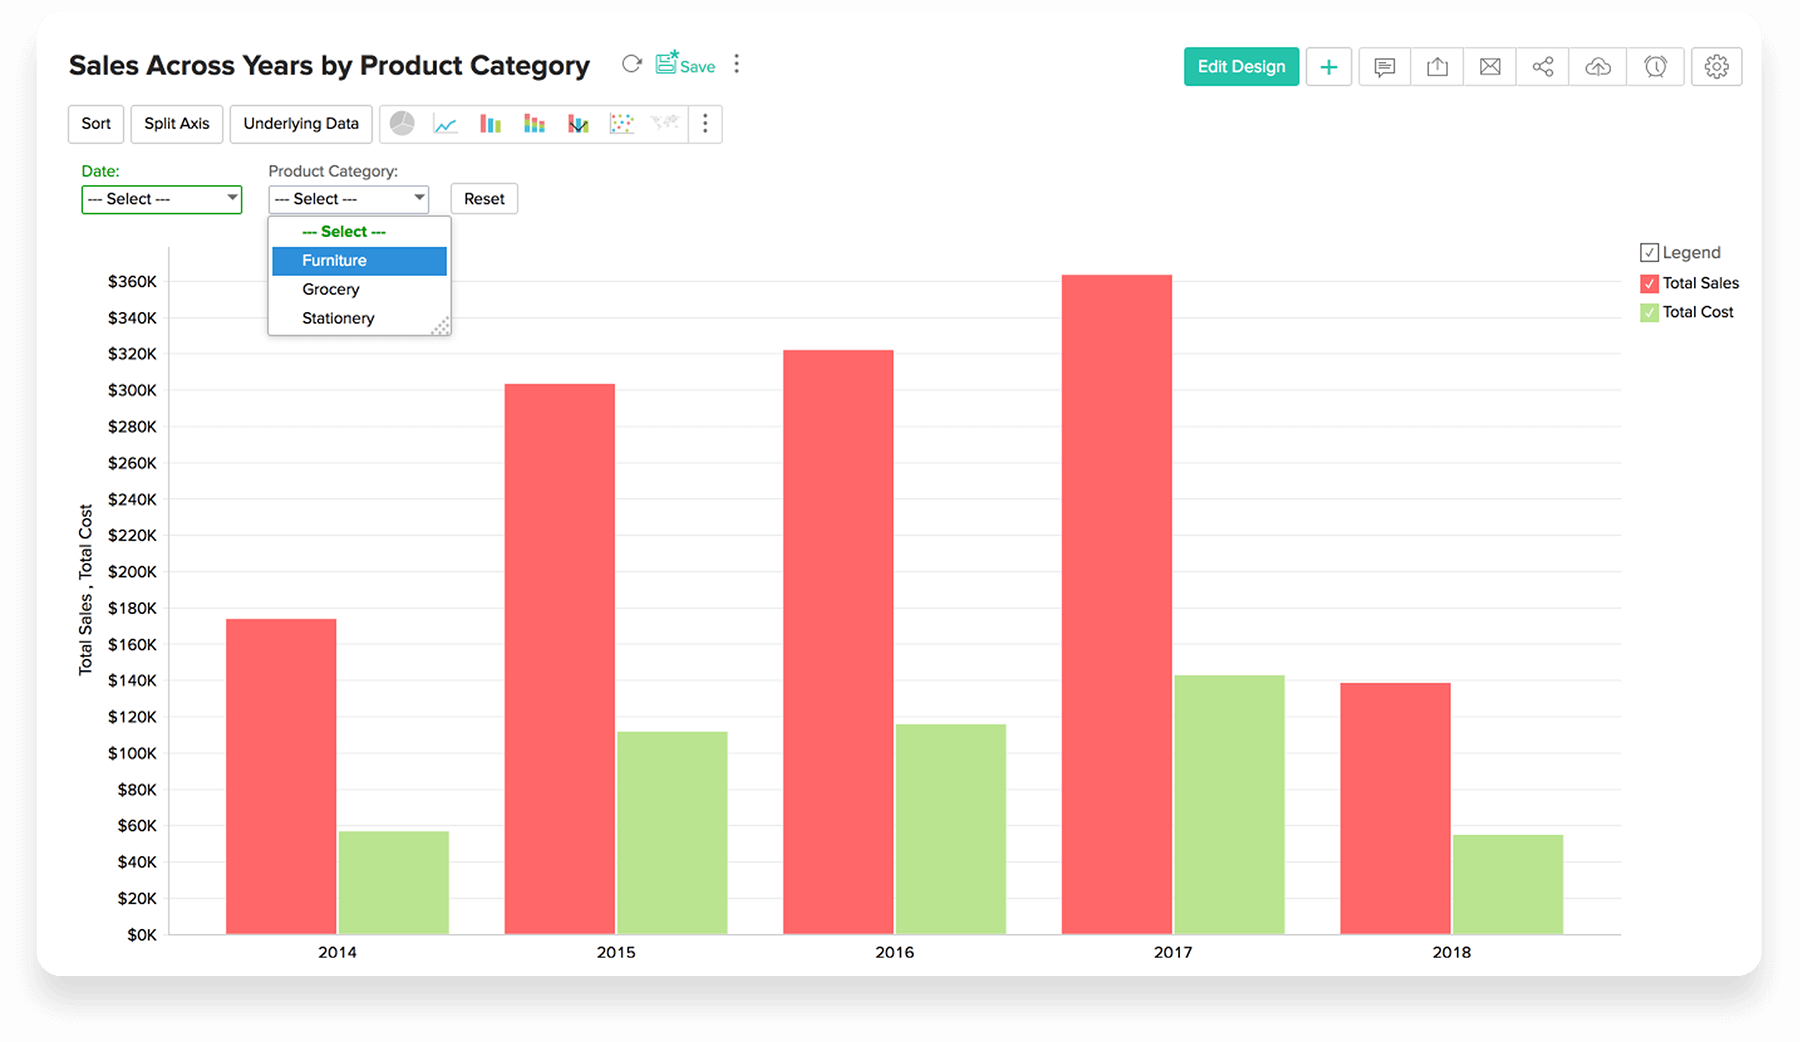
Dynamic Filters
Zoho Analytics allows you to include dynamic filtering capability in the reports you create, known as "User Filters". User filters enable your users who access the report, to apply filters on the data displayed. Learn more
Drill Down
With the drill down feature, you can start with a category in the chart to drill down the hierarchy. This helps you to perform exploratory analytics of the category, right away in the same window. Learn more
Highly Interactive
Charts are highly interactive providing options like contextual tooltips, area highlight, legend filters, drill downs and more. This enables dynamic analysis.

Chart Types
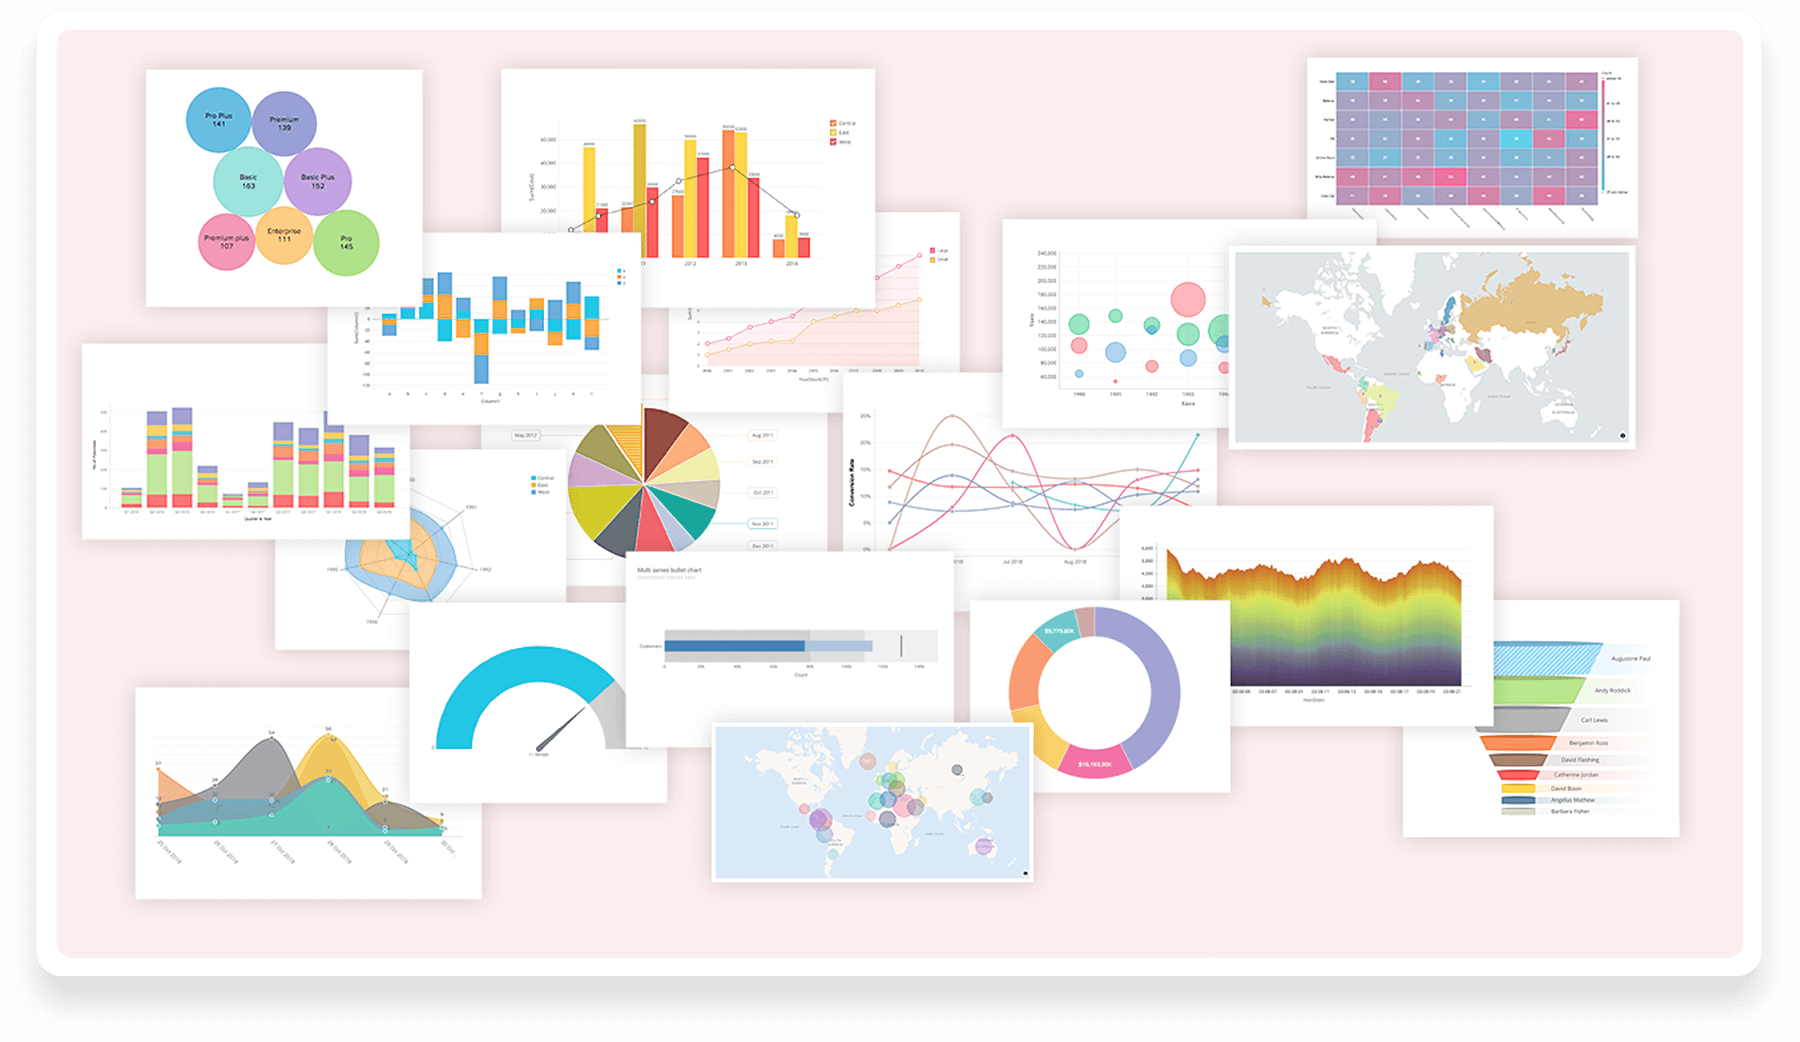
Zoho Analytics supports 40+ chart types including Line, Bar, Combination, Geo Maps, Heat Maps, Scatter, Stacked Bar, Pie, Funnel, Ring, Area, Stacked Area, Web and Table chart types.
Pivot Tables
Pivot Table
Variously called as Cross Tabs or Matrix View, Pivot is an important report type useful in data analysis. Zoho Analytics supports a flexible and feature-rich pivot table report type. Learn more
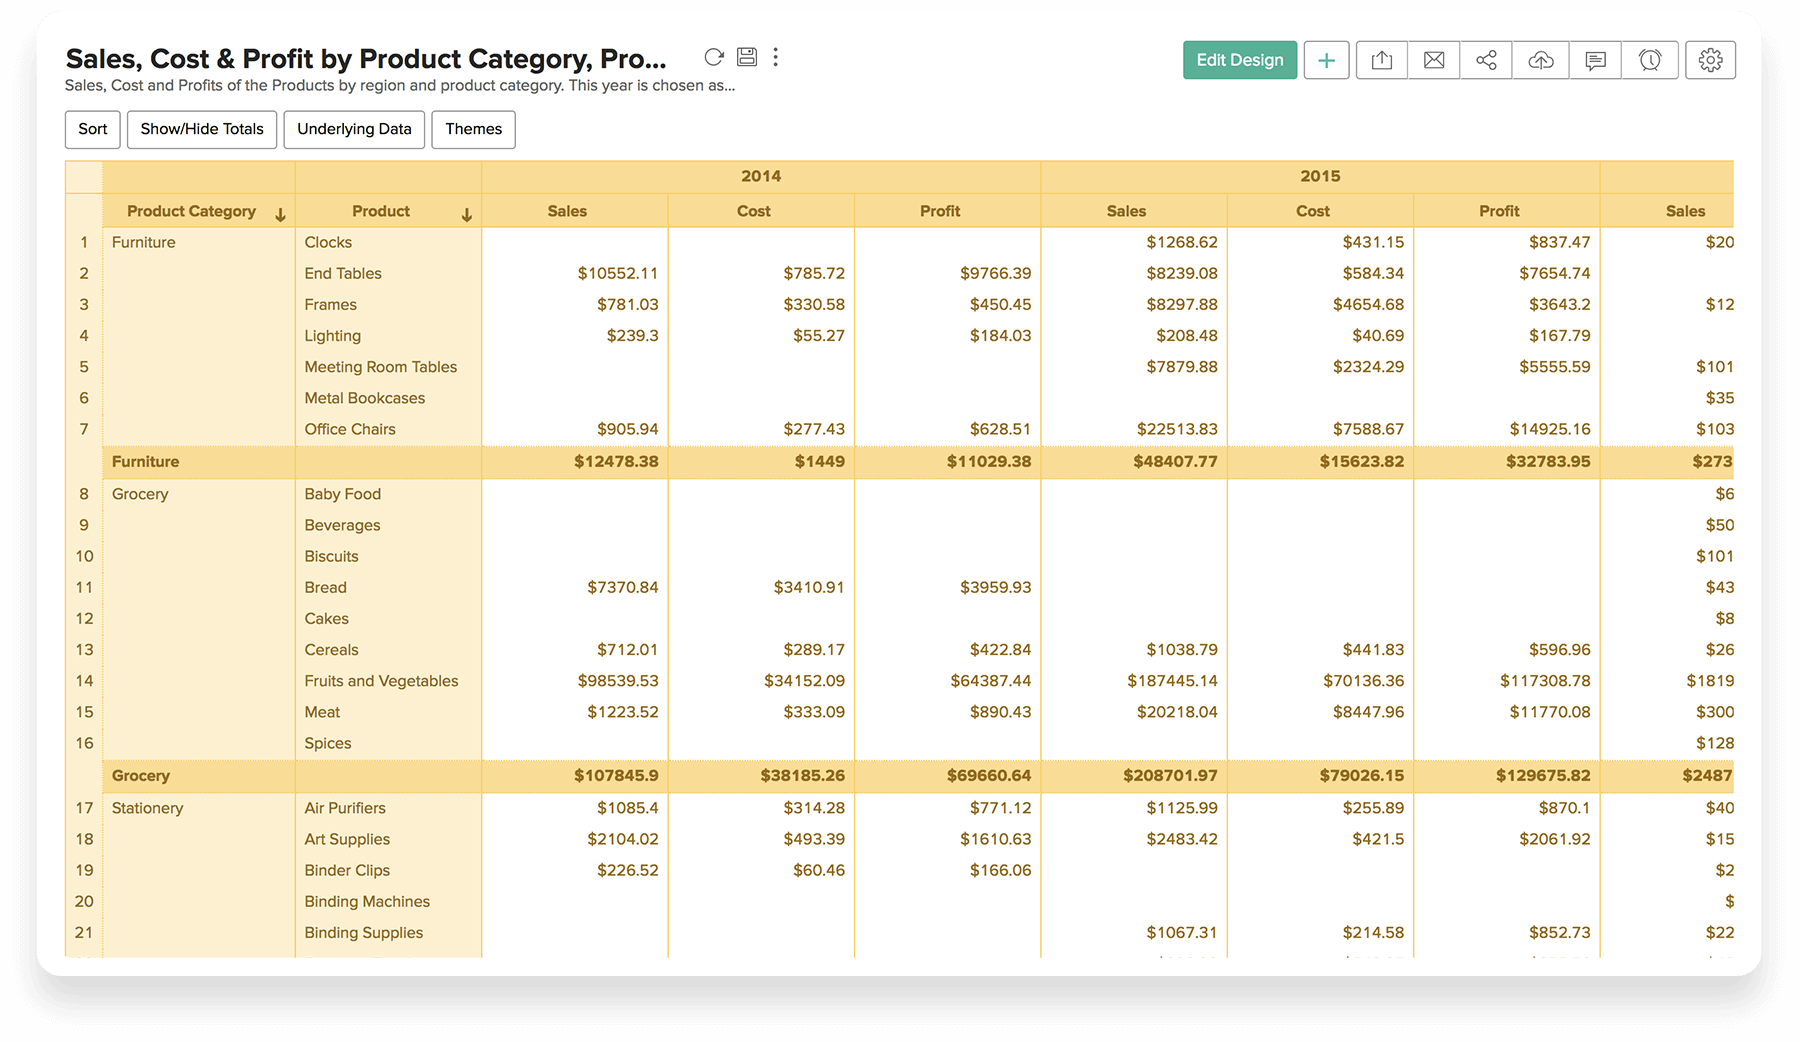
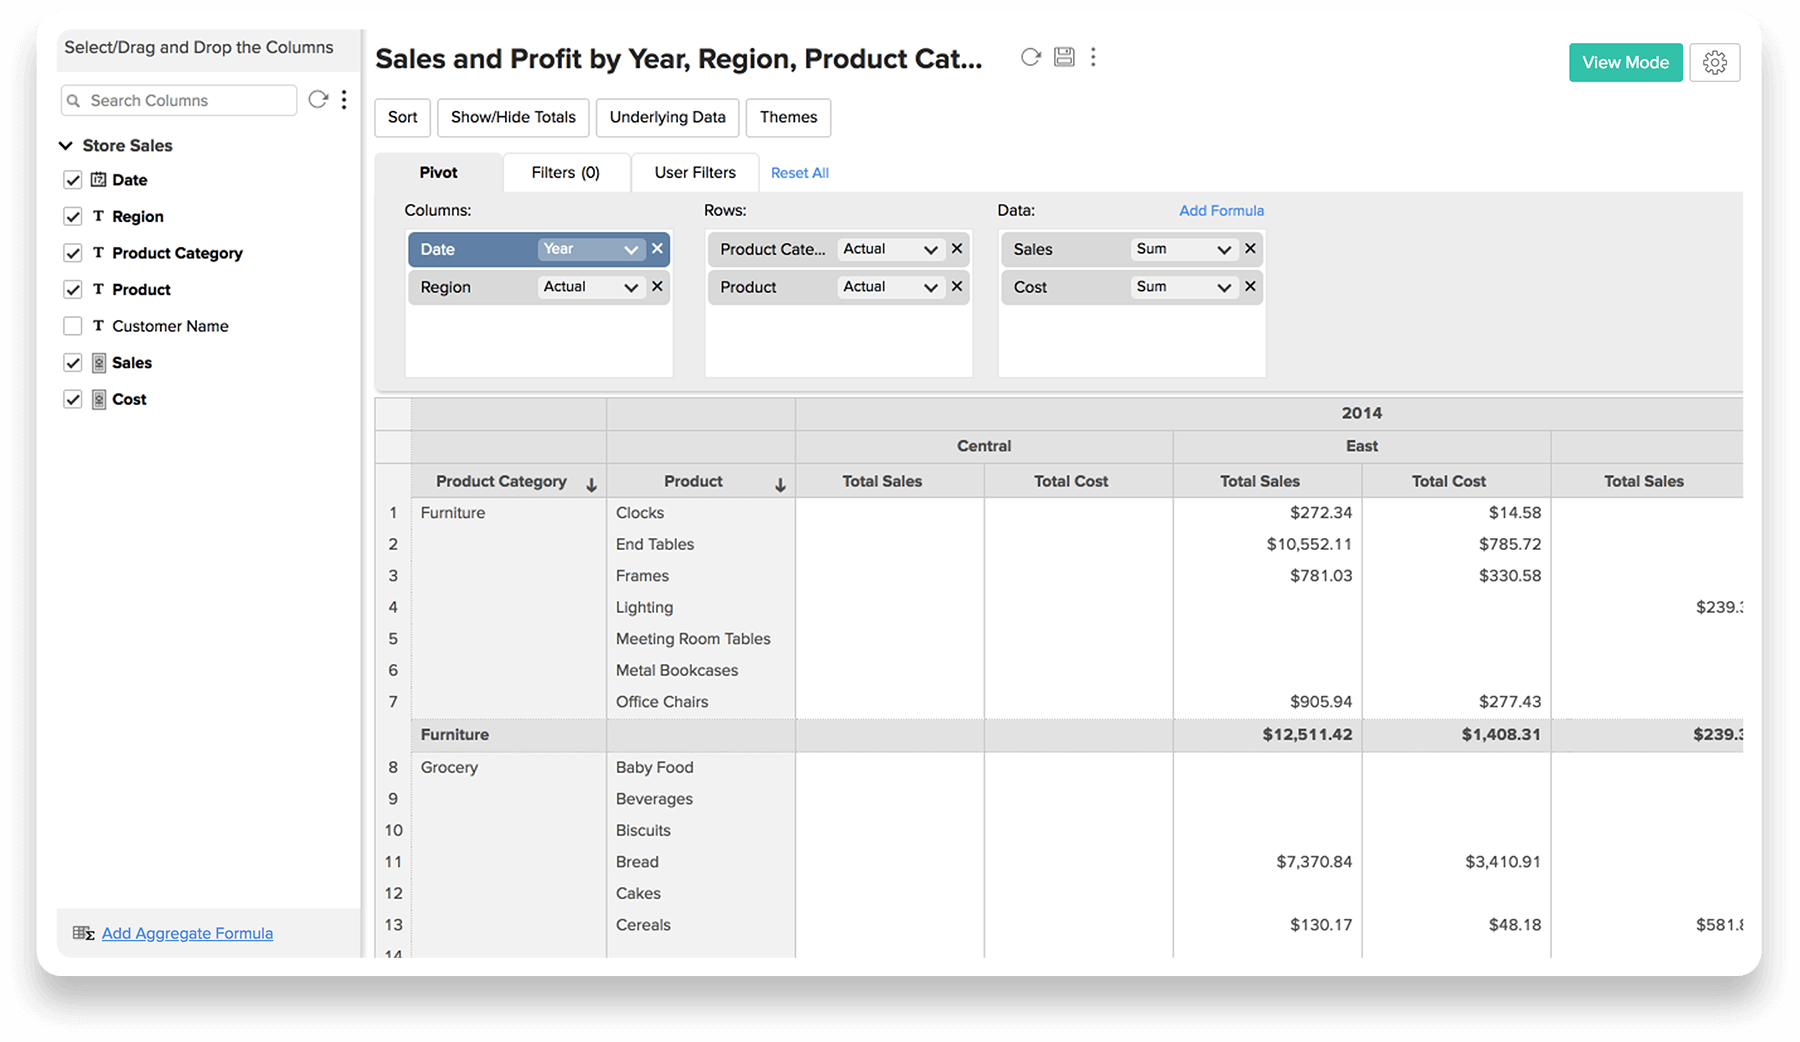
Multi-level Pivot View
You can create Multi-level pivots too. The screenshot shows a pivot table grouped at multiple levels on both row and column level, summarizing sales & cost.
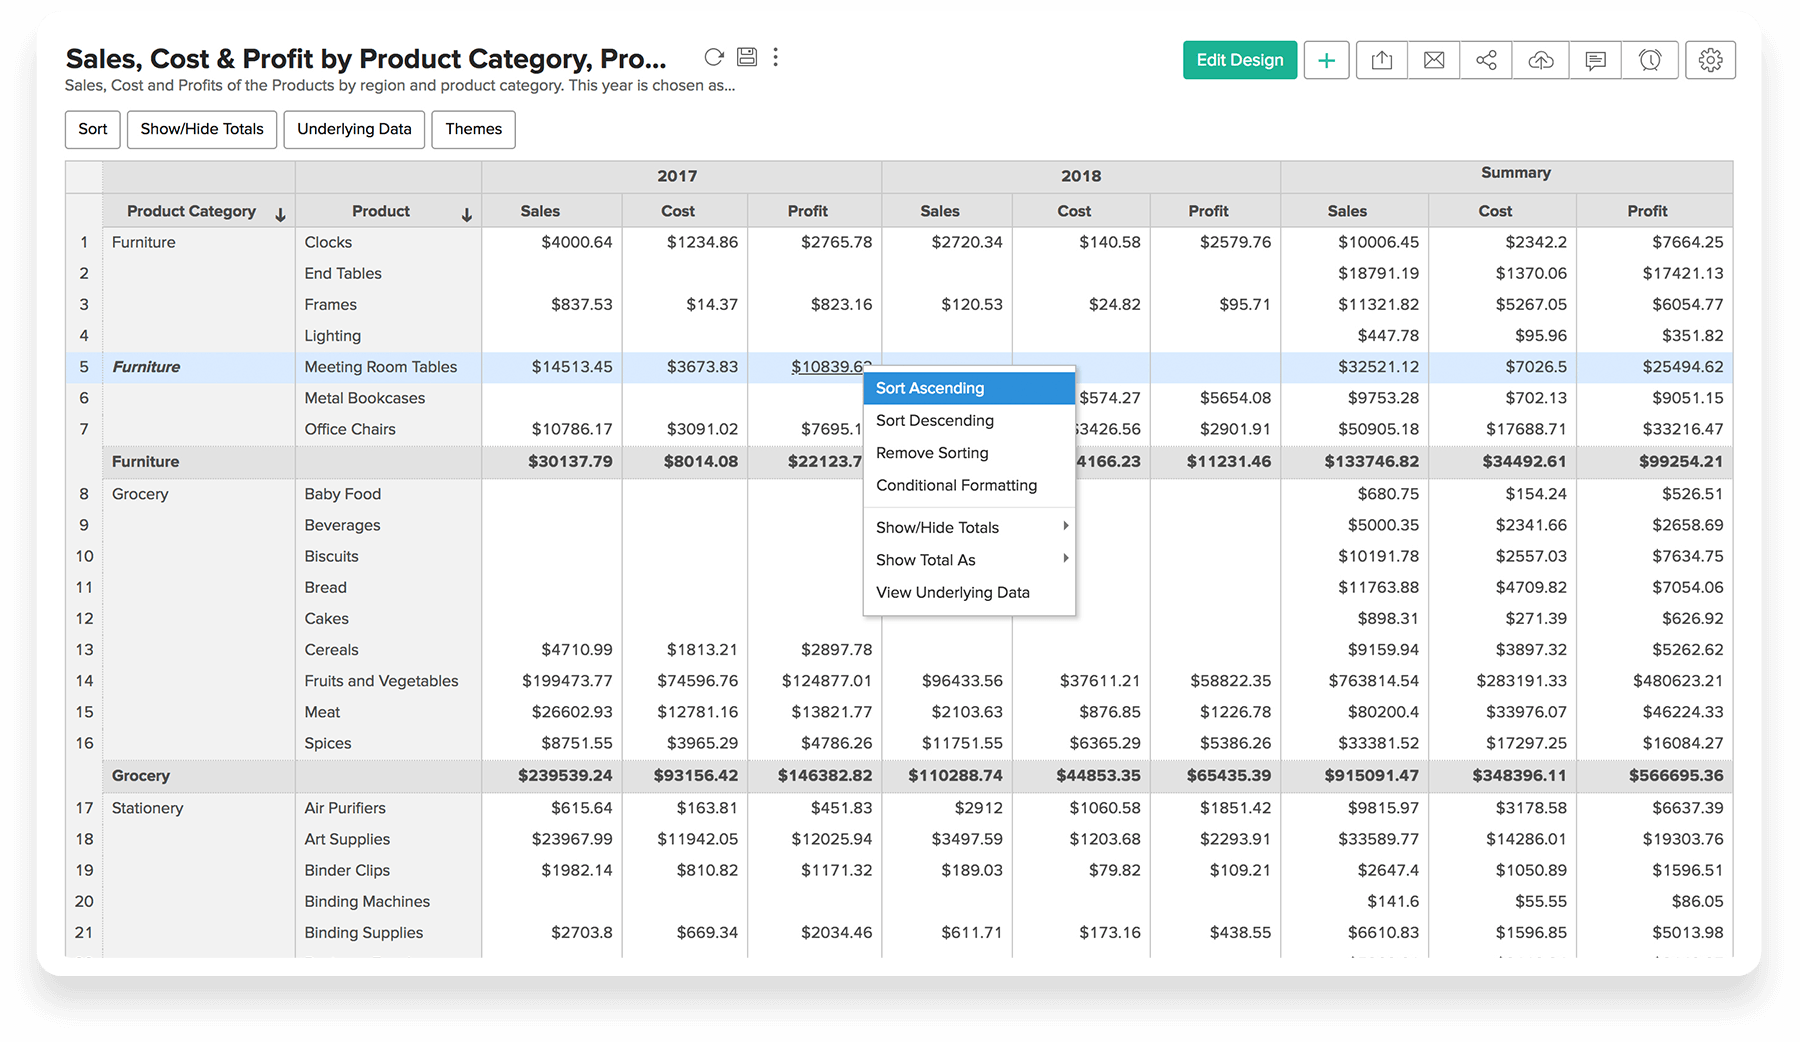
Sorting
The pivot table can be sorted based on any column by either clicking the corresponding sort icon or by selecting the required options from the sort menu. Learn more
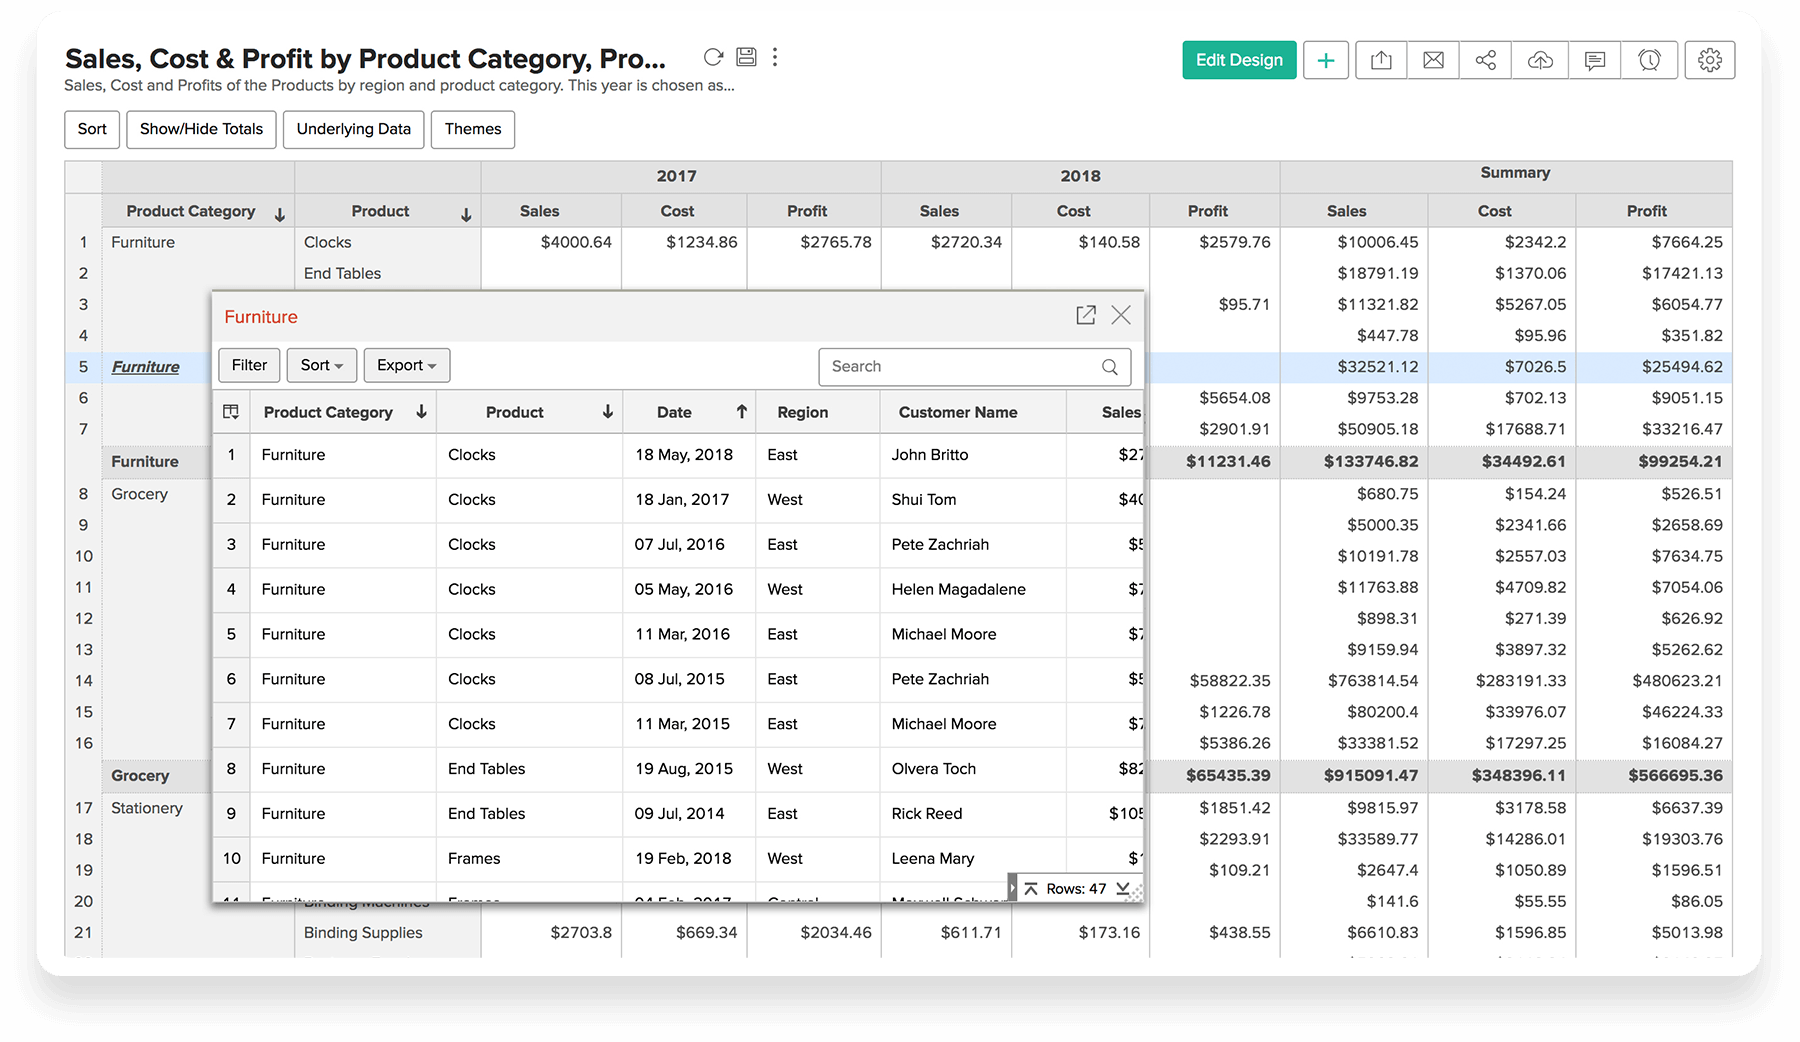
View Underlying Data
Data underlying any point in the pivot can be seen by clicking on the same. Learn more
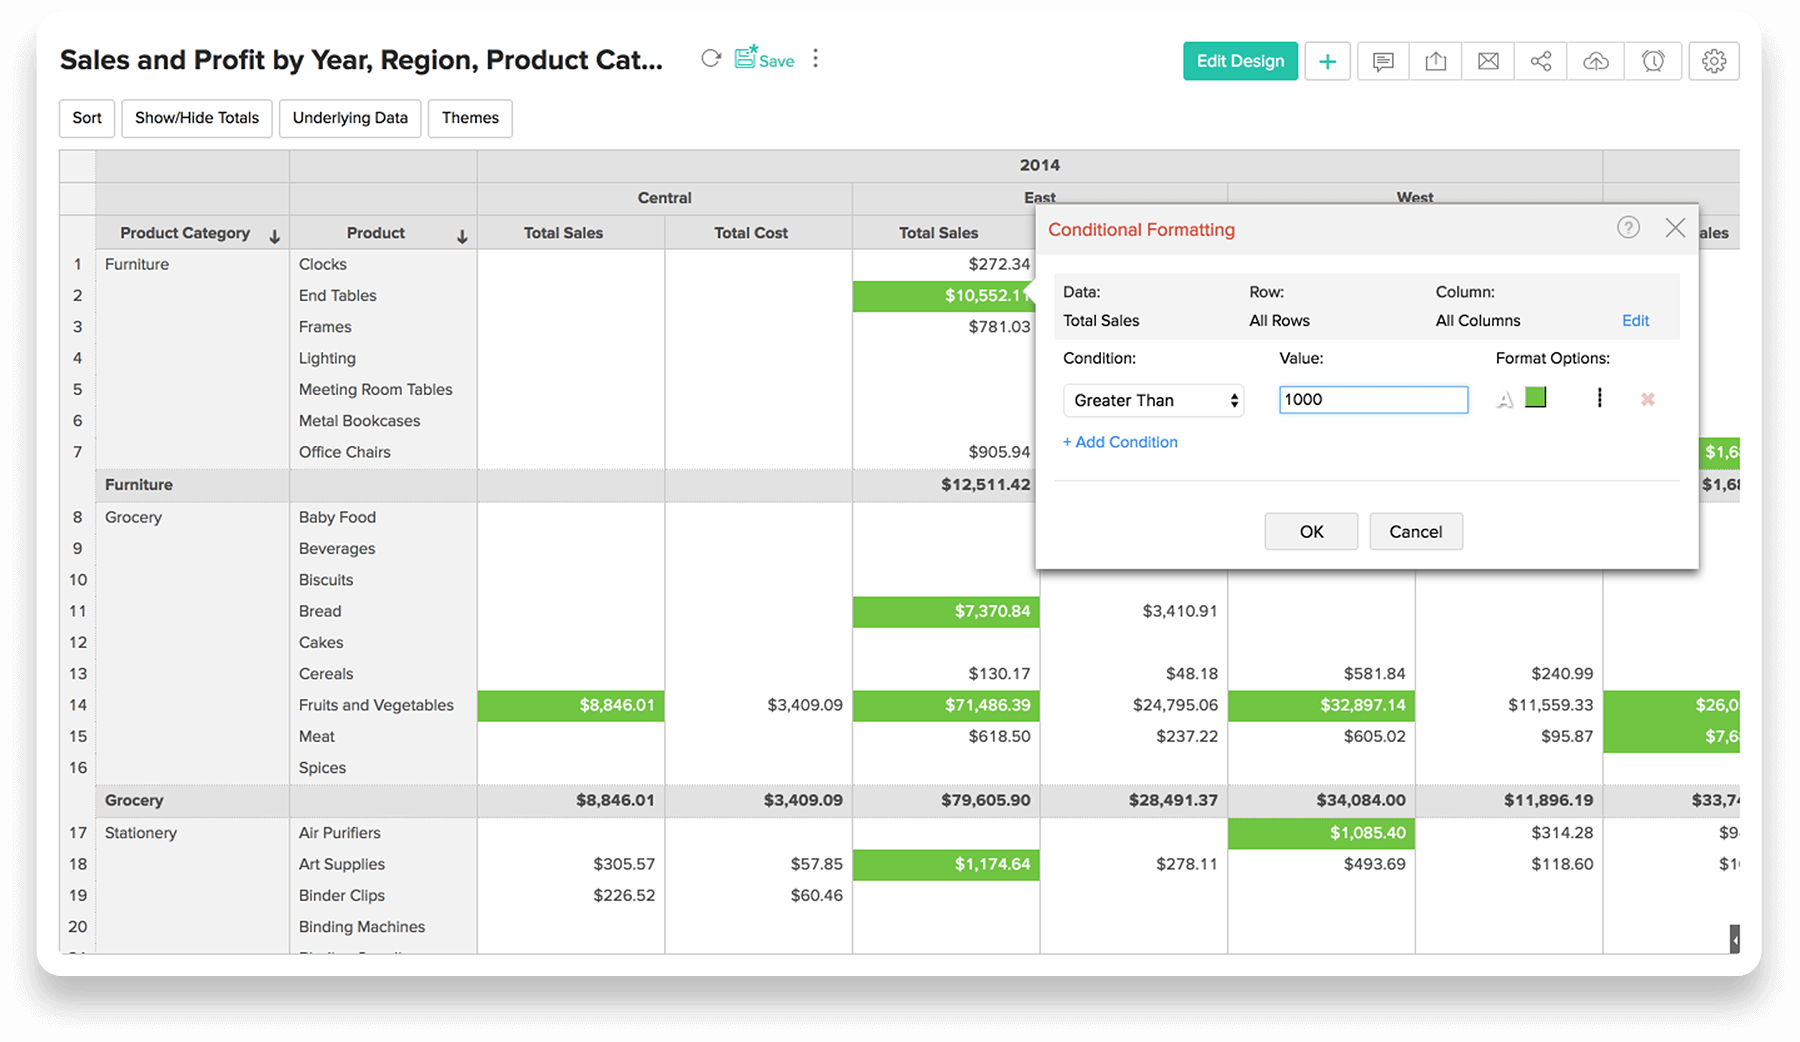
Conditional formatting
Conditional formatting feature allows you to visually highlight data cells in a pivot table with different styles based on matching conditions. Learn more
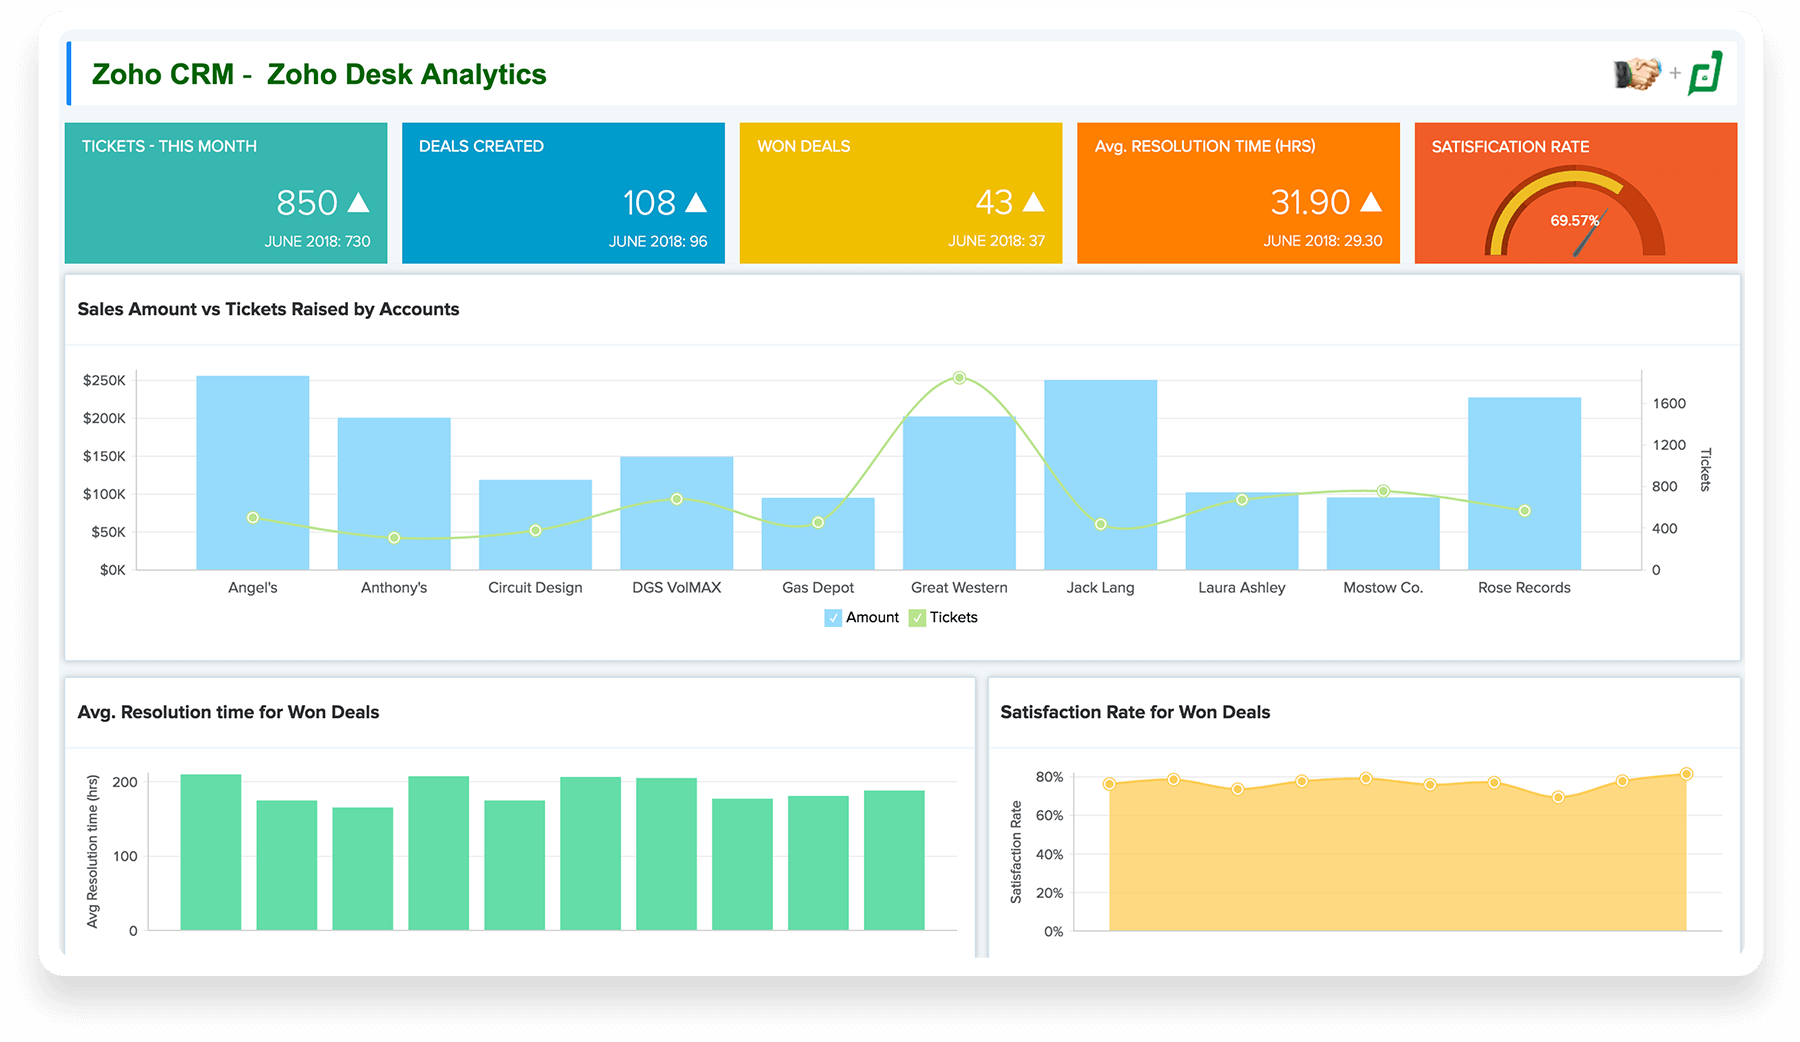
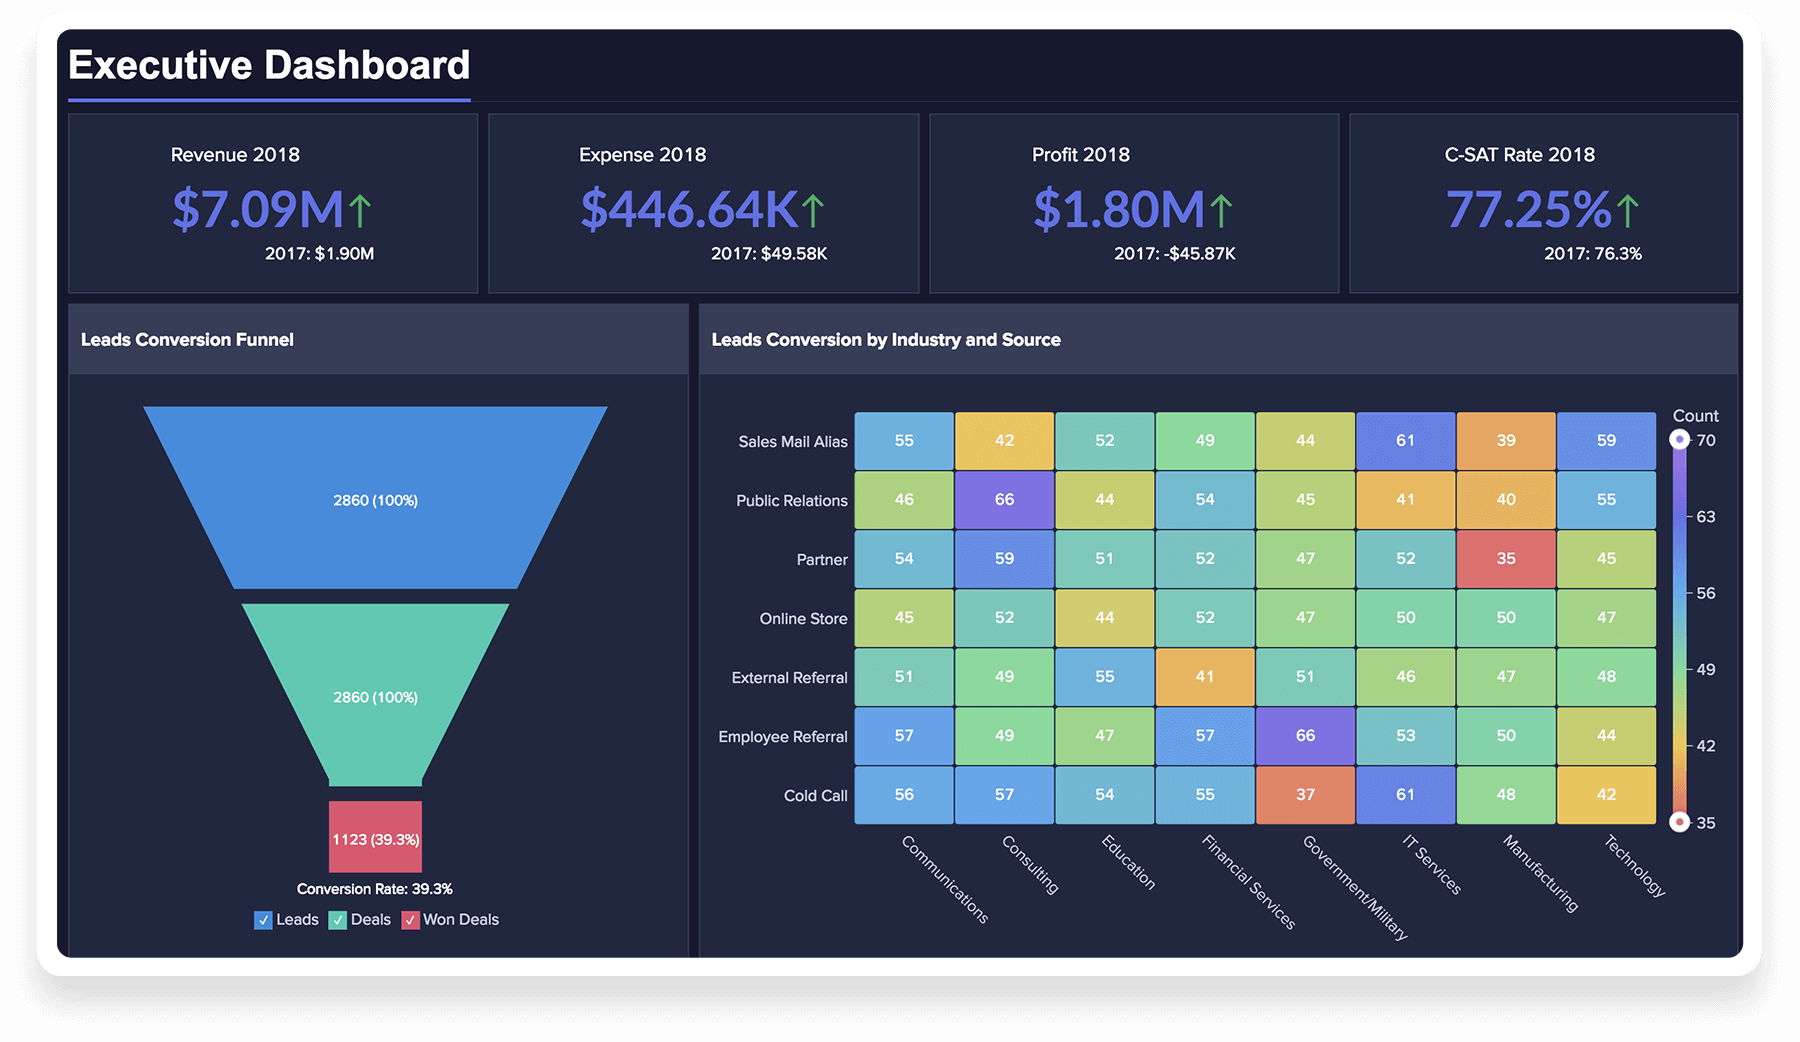
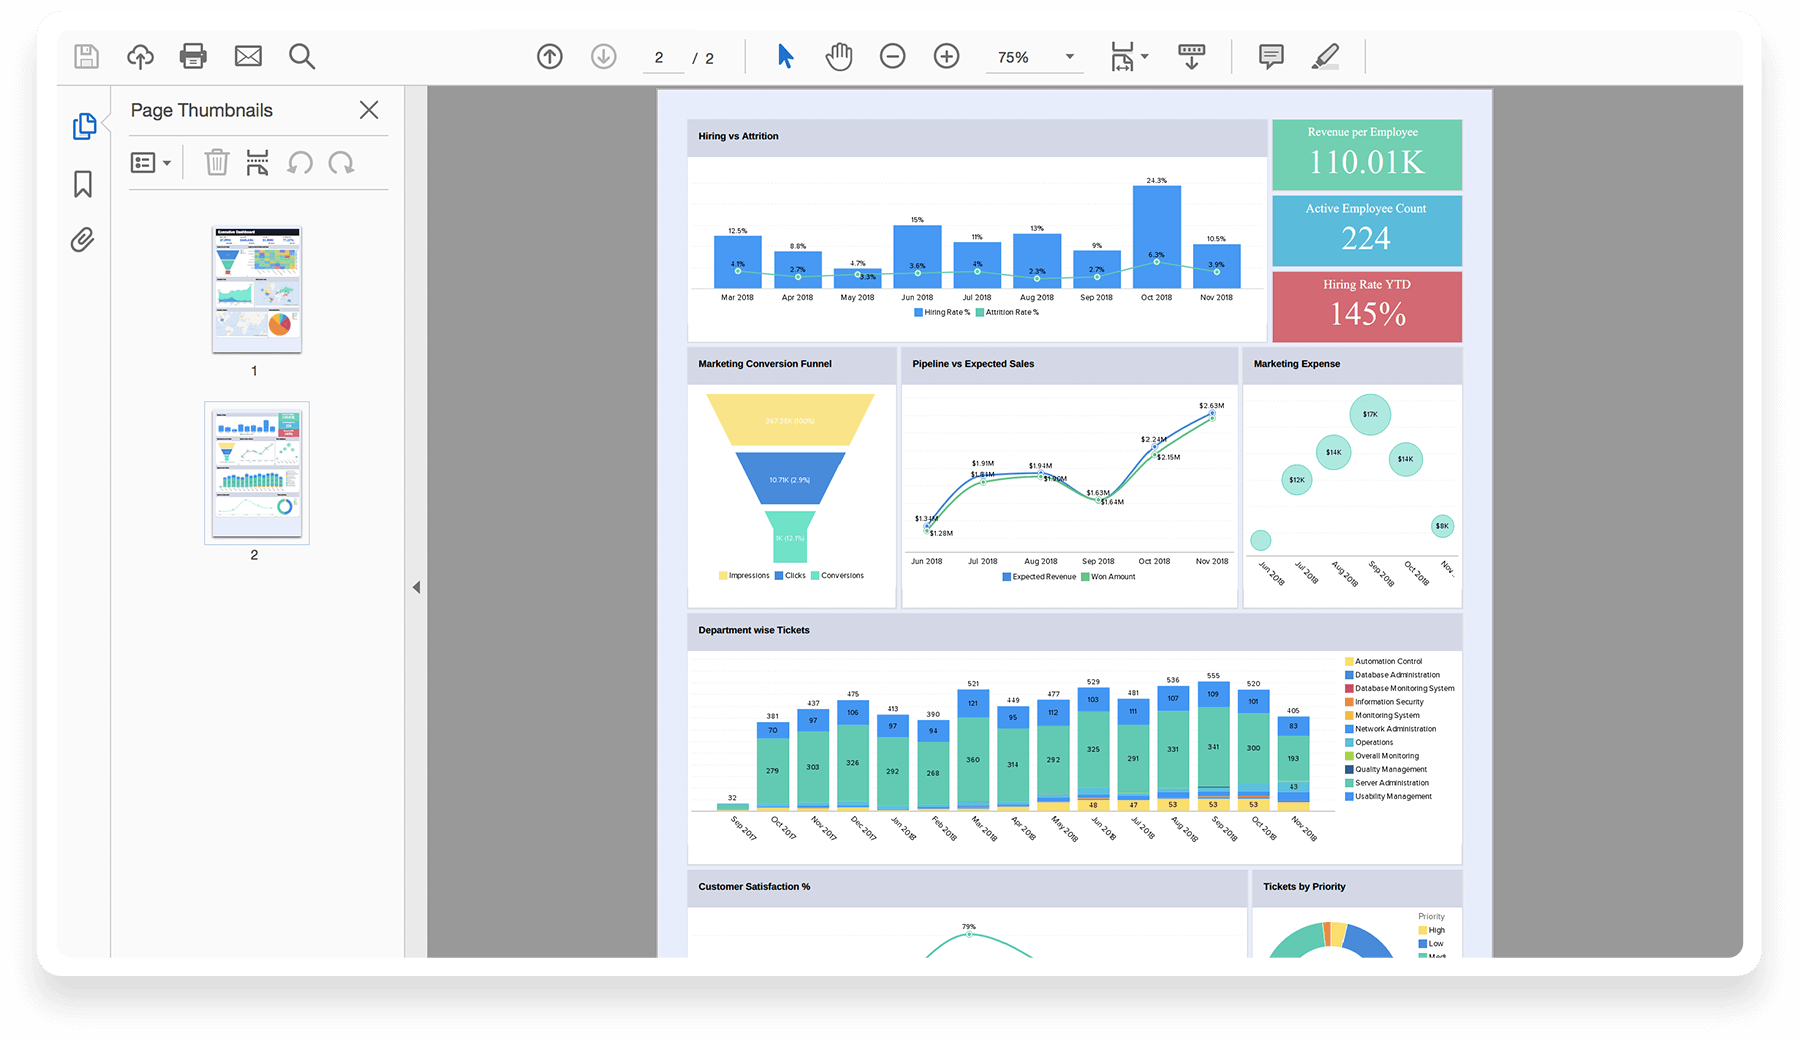
Dashboards
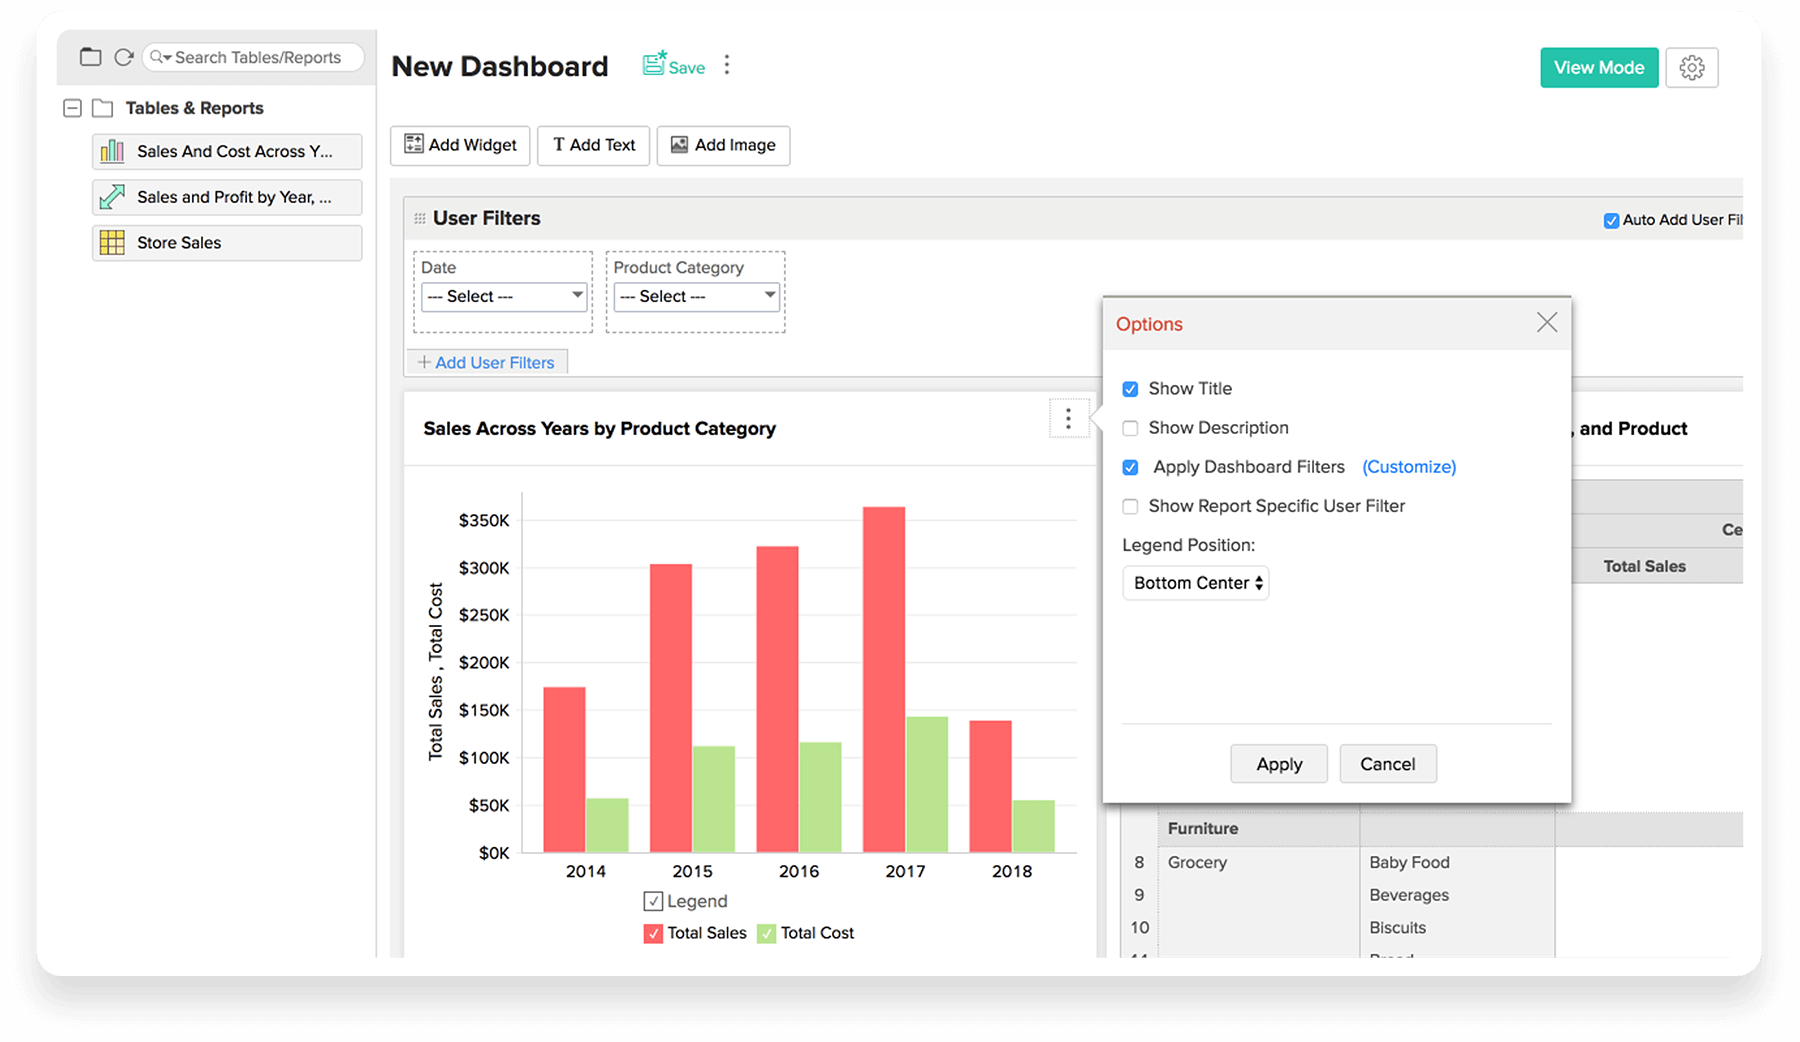
Dashboards provide a snapshot view of your key business metrics for quick and easy analysis. A dashboard can contain reports, KPI widgets, images, rich formatted text along with dynamic filters organized in a flexible layout.
Drag & drop
Dashboard creation is completely drag & drop based. In the designer, you will see the list of reports on the left pane. Drag & drop any report into the design area to make it a part of the dashboard. Learn more

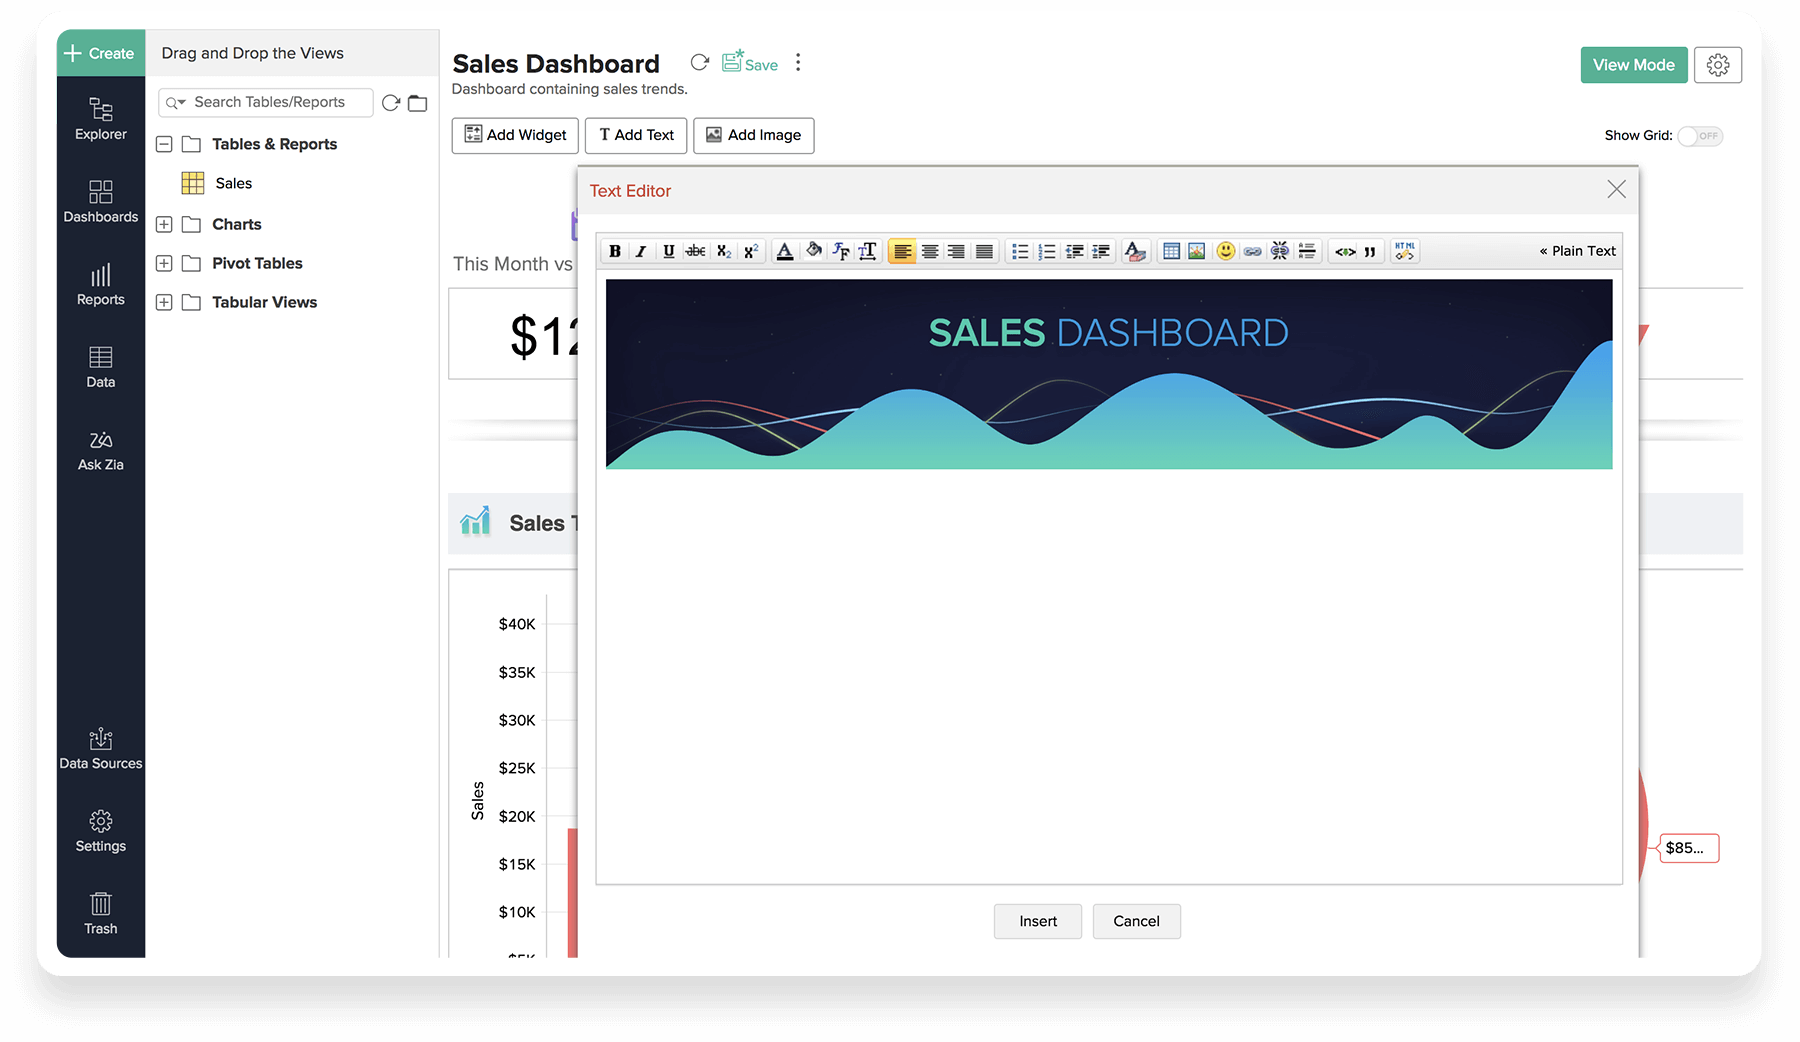
Add Rich Formatted Text
You can add rich formatted text along with images and URL Links to provide a rich look & feel to your dashboard. Learn more
Flexible Layout
You can arrange your reports in a multi-column layout. Resize them to your needs. Use contextual options to customize the components embedded in the dashboard. Learn more
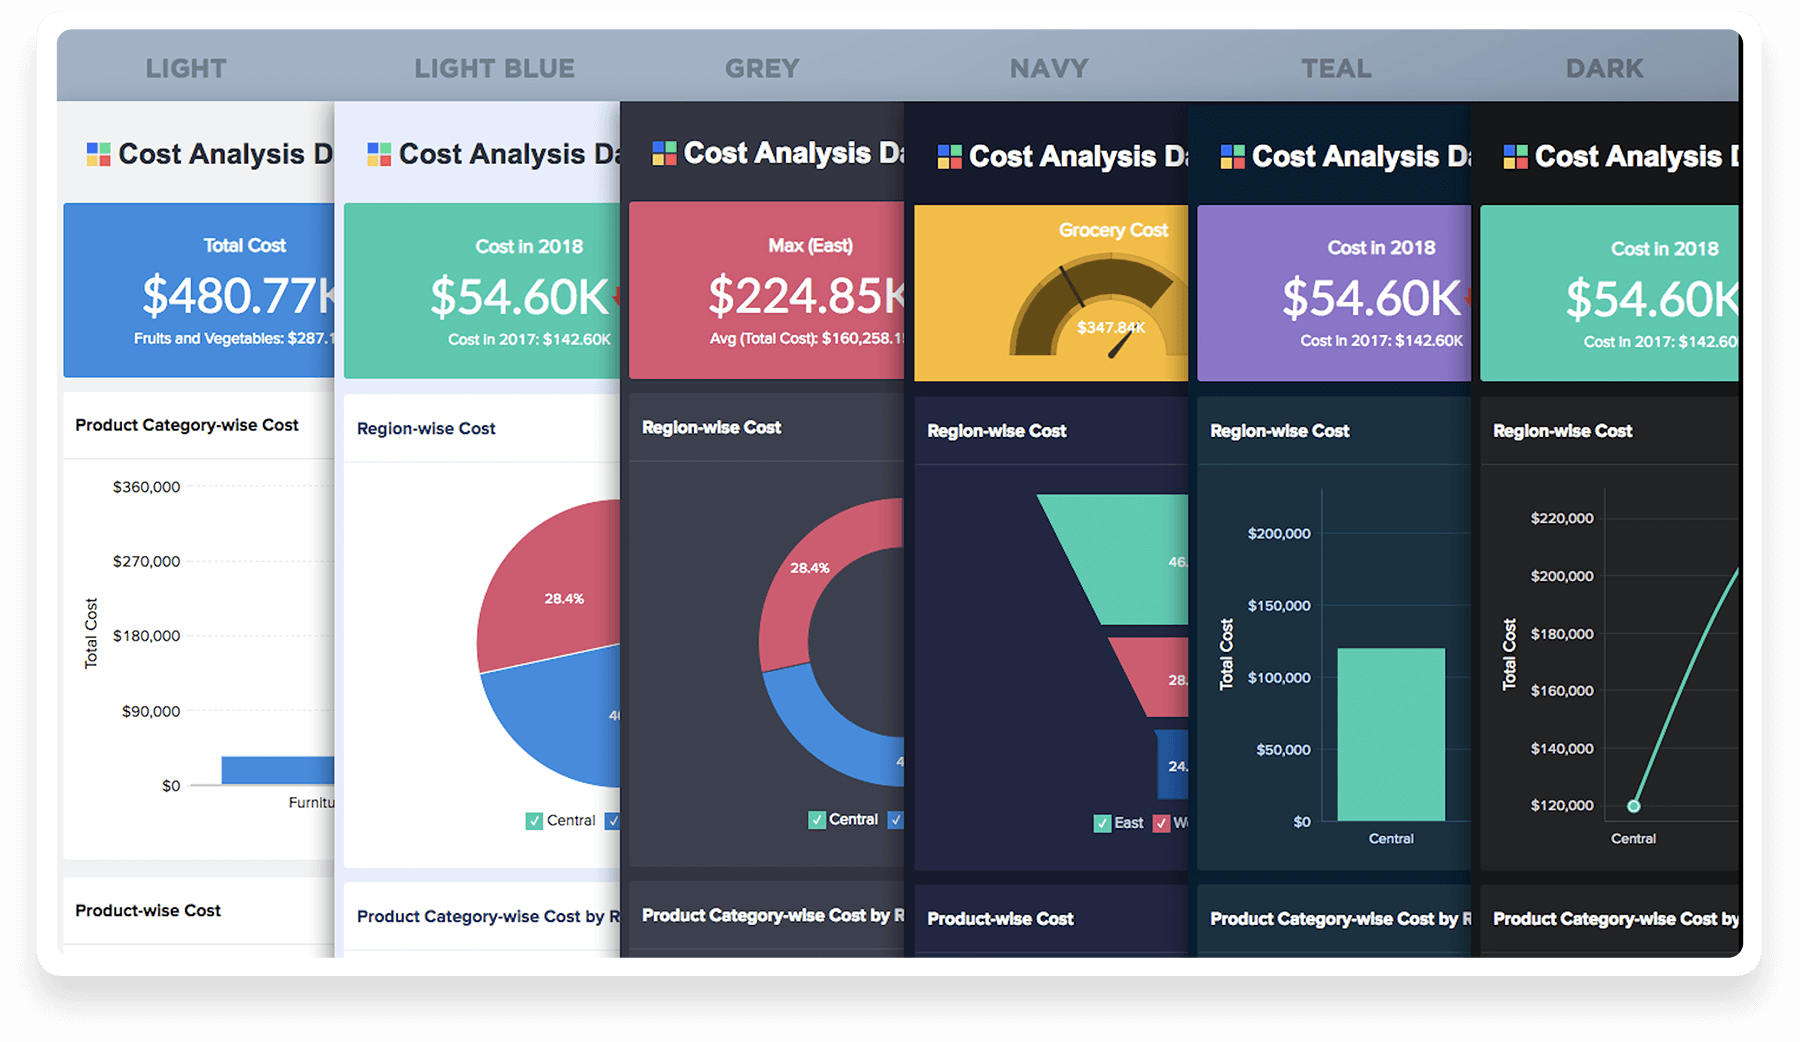
Themes
Choose from a range of visually appealing themes for your dashboard. Try any of the packaged themes available, or customize your own theme. Learn more
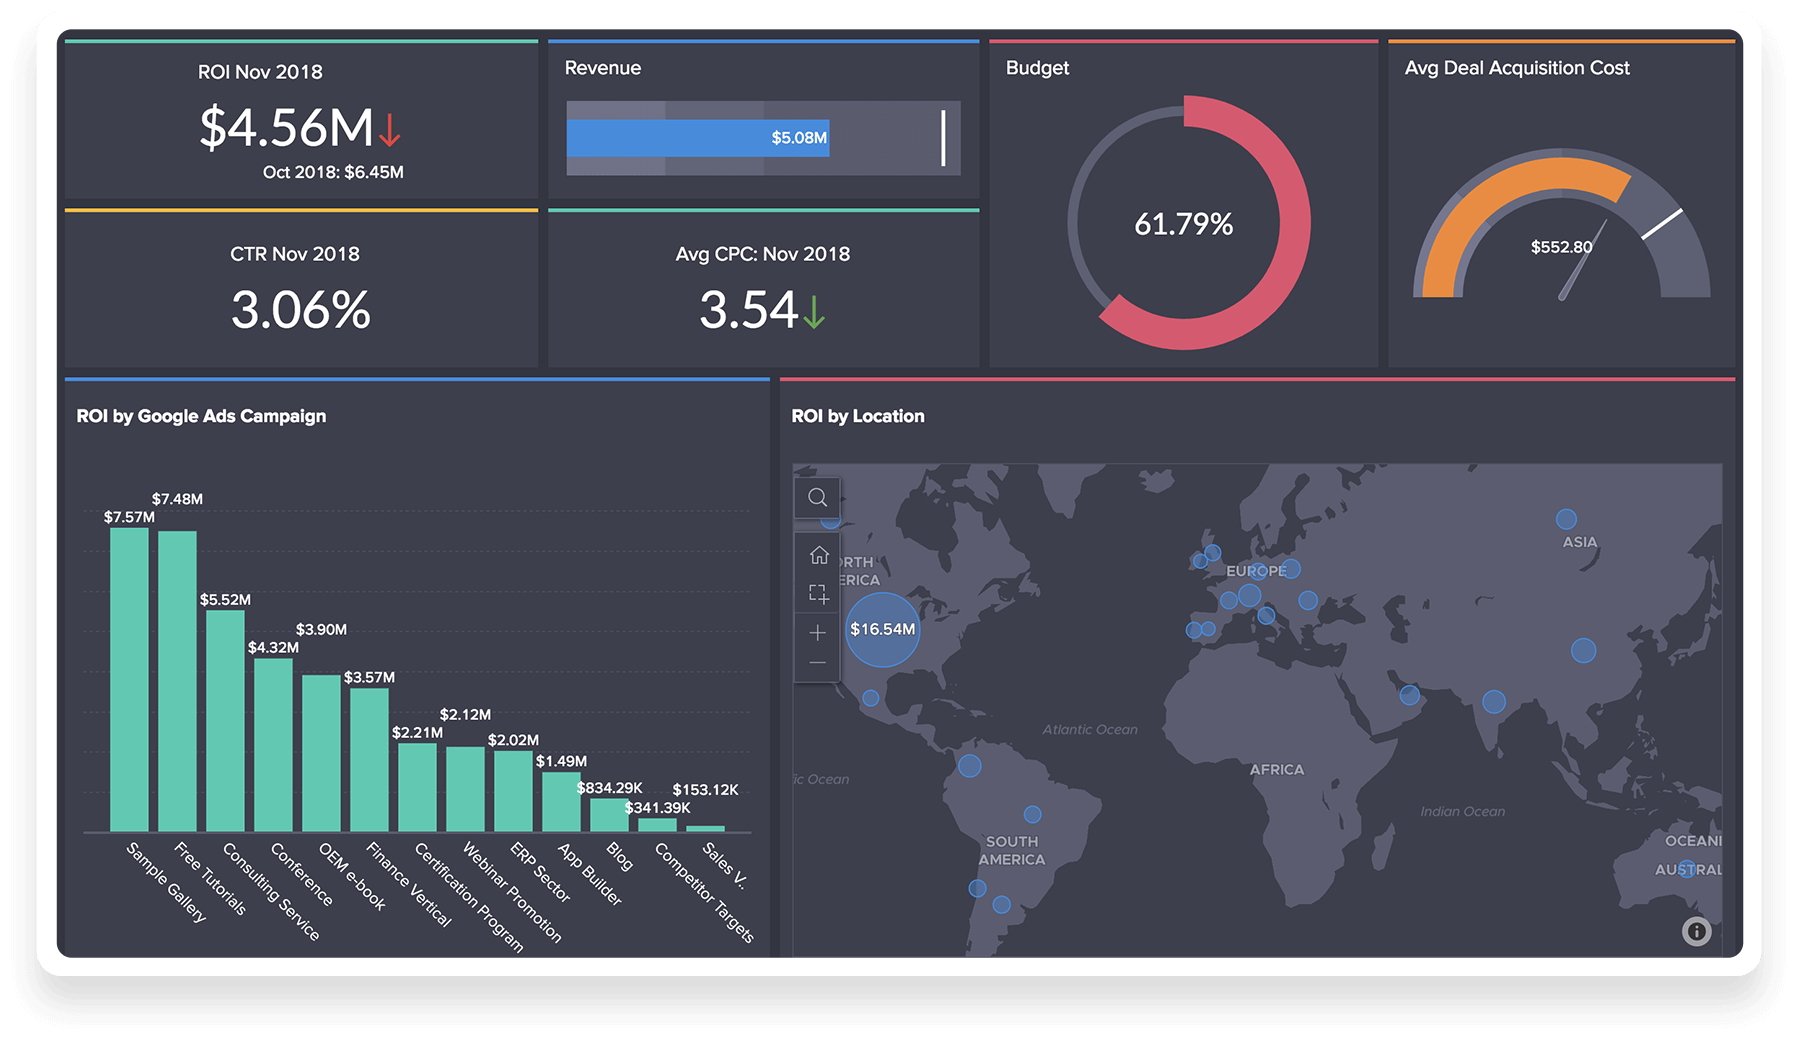
KPI Widgets
KPI Widgets are single metric view components, with possible trend indicators, providing a quick & easy visualization of any data metric. Learn more
Export, Share & Publish
You can export a dashboard as a PDF (printer friendly) or HTML file. You can also share, publish, and embed the dashboards. Learn more
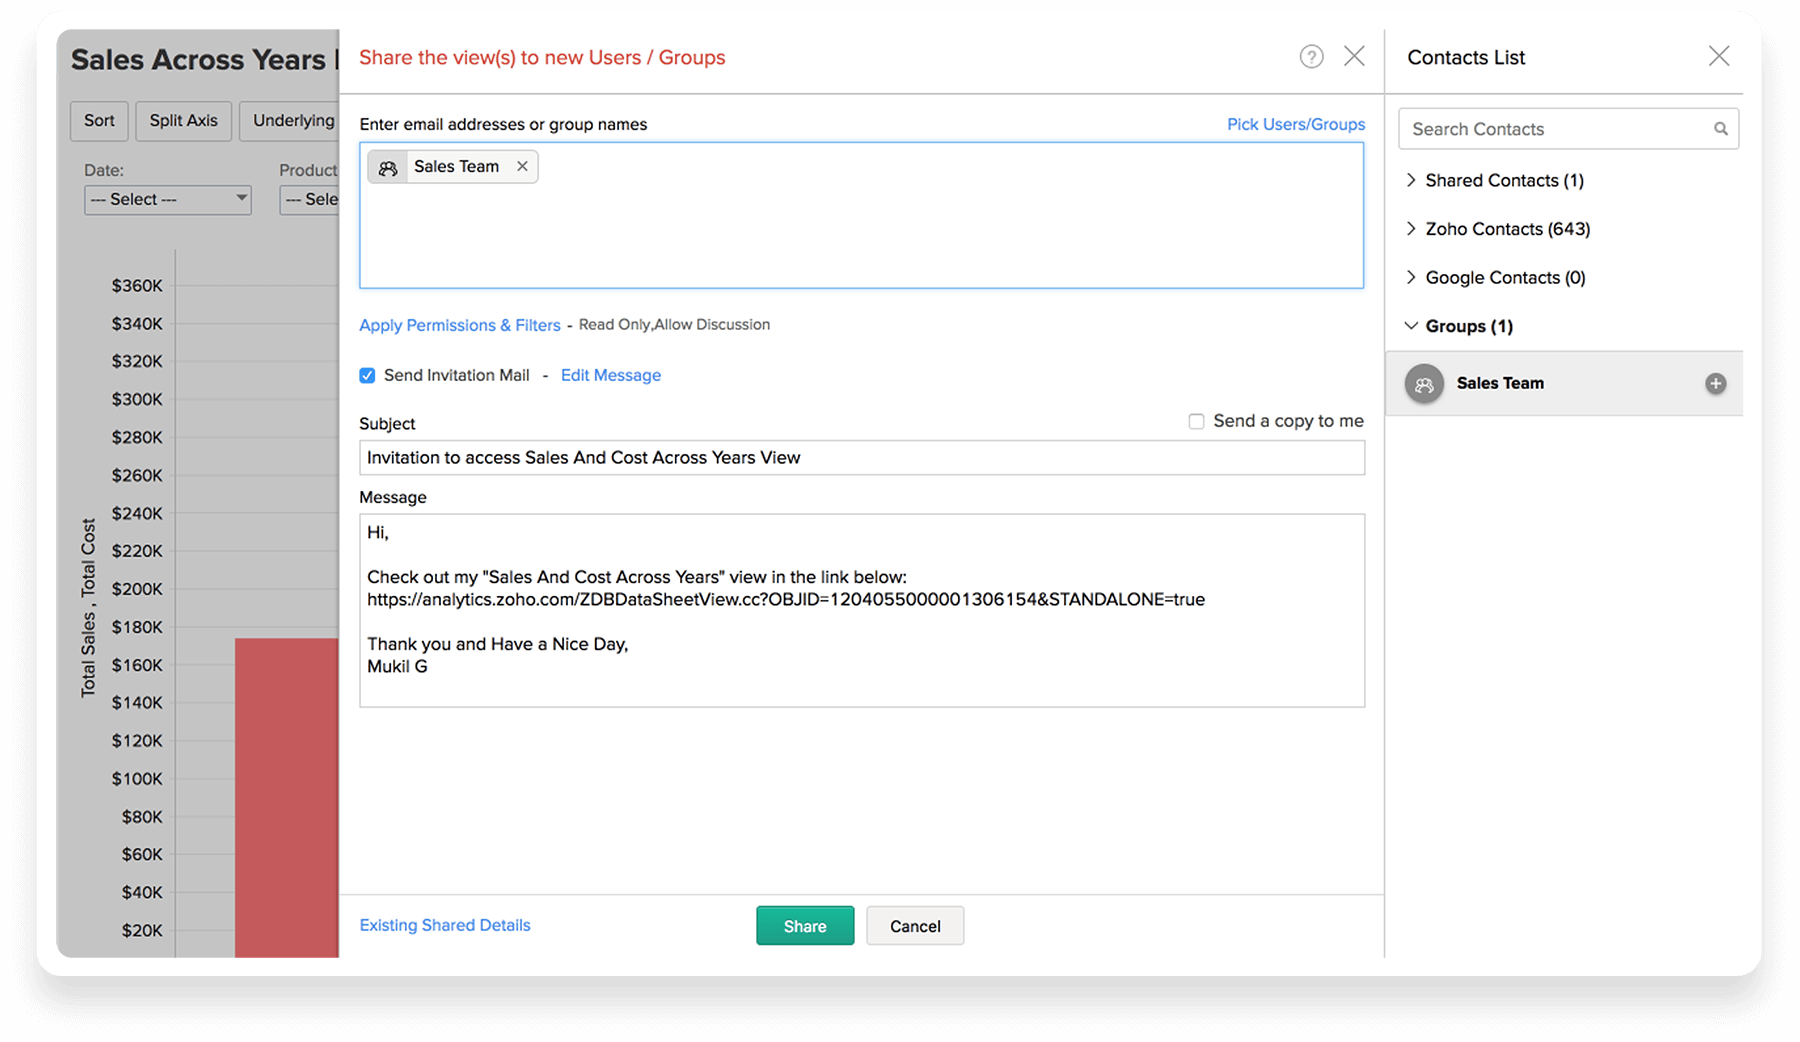
Sharing & Publishing
Collaboration
Accessible over the web, Zoho Analytics helps you collaborate easily with whoever you choose to - peers, clients, vendors - with its intuitive sharing and publishing options. Learn more
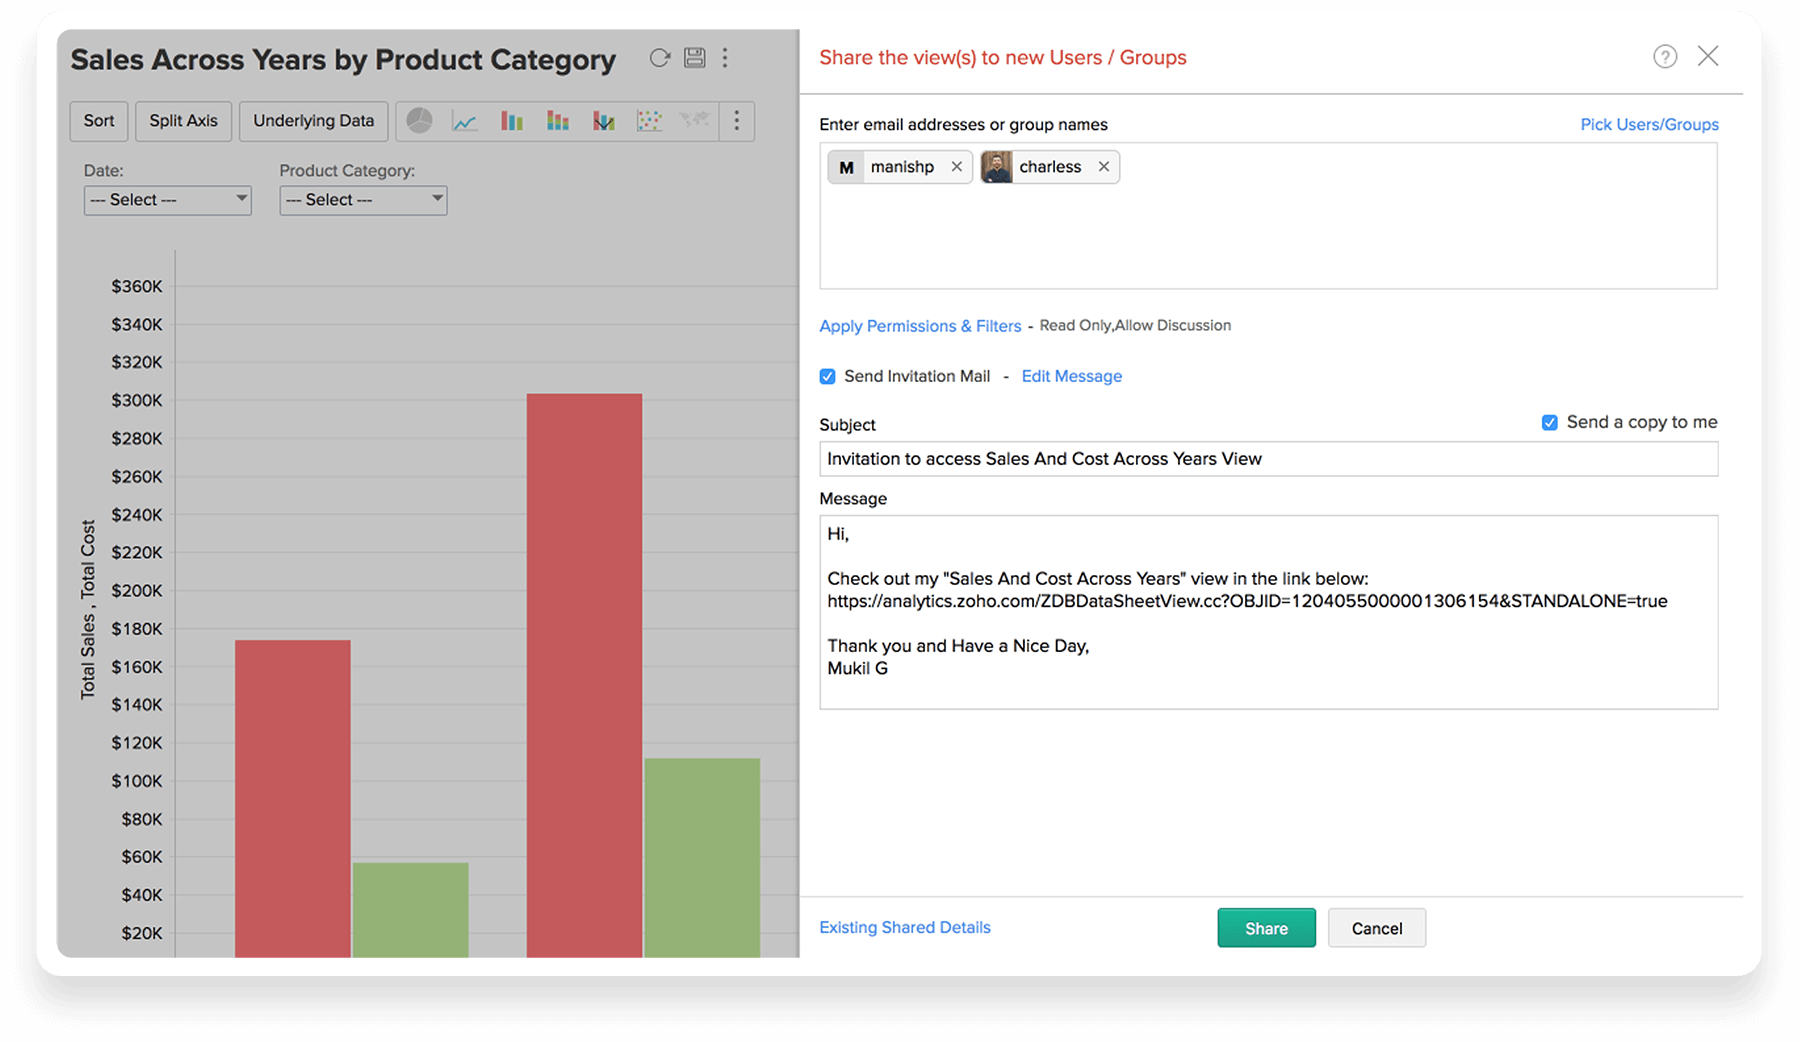
Sharing to Group
A group is nothing but a collection of email addresses of individuals. Setting a workspace group helps in easy collaboration within a group of people.
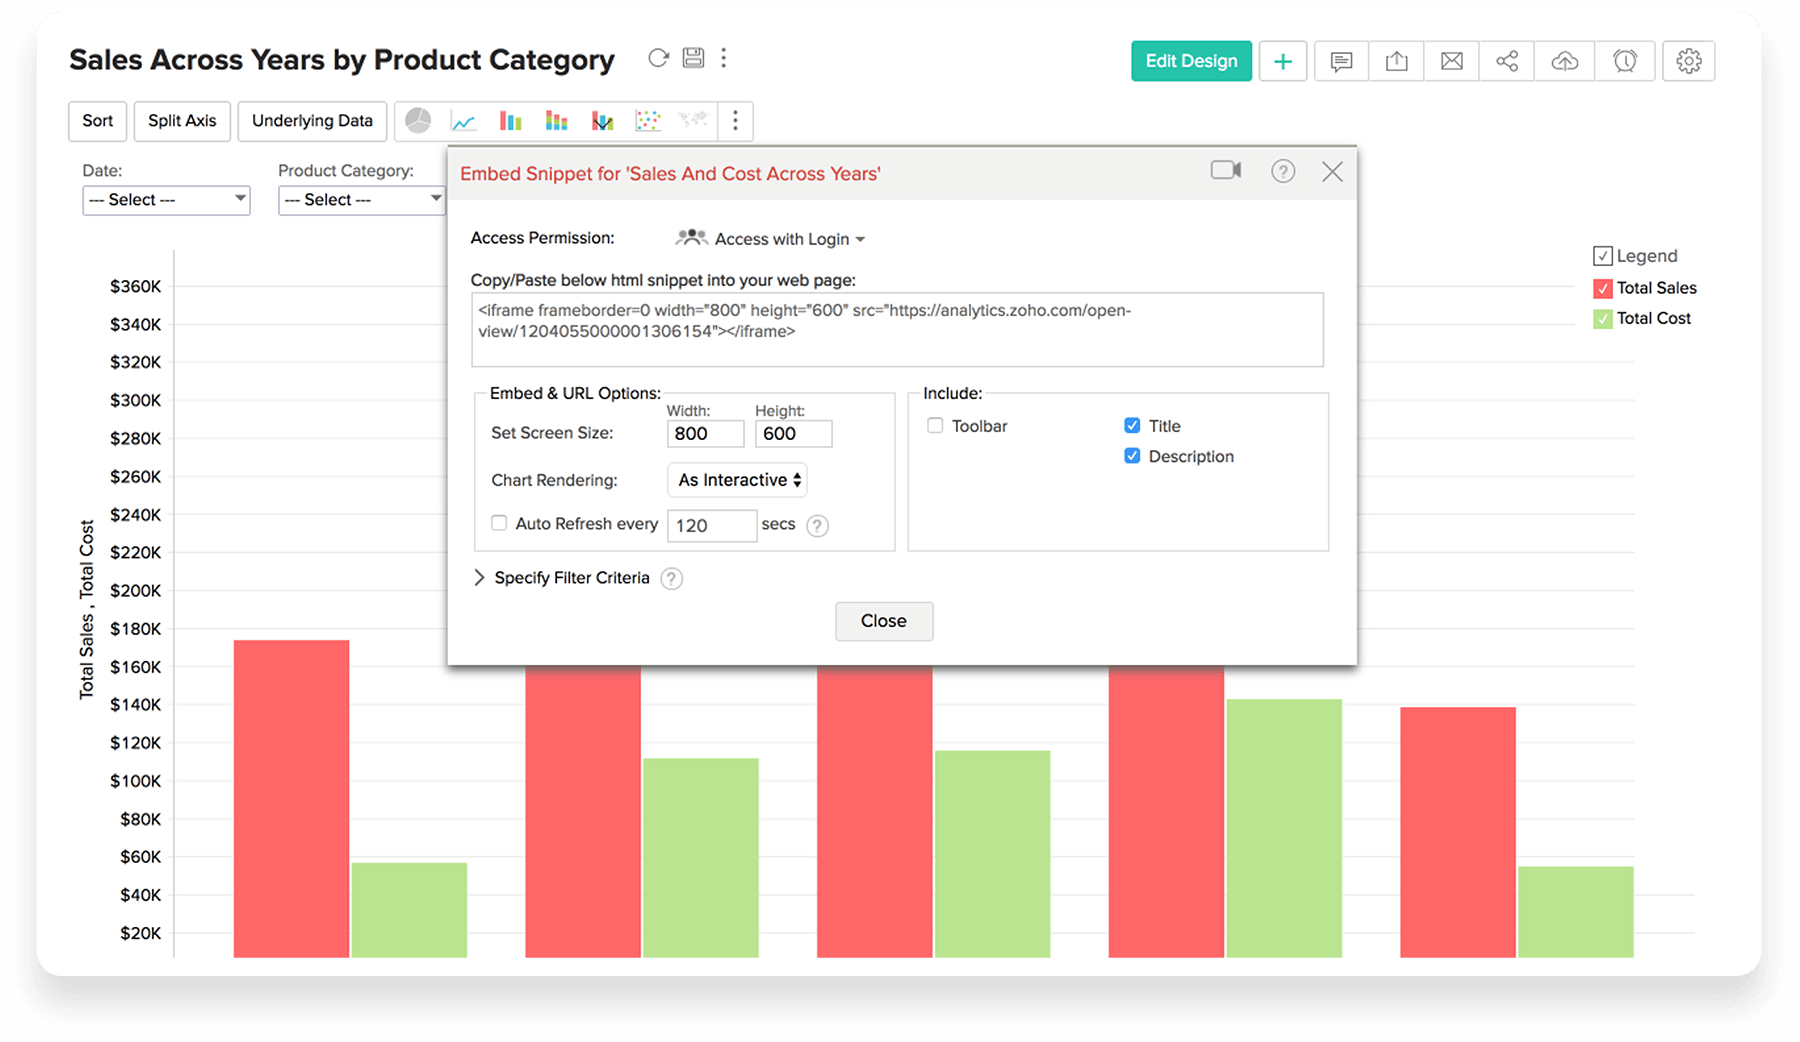
Embedding
Dashboards and Reports can be embedded in your websites, intranet, blogs, and other web applications for wider access. The dashboards/reports embedded are live and interactive. Learn more
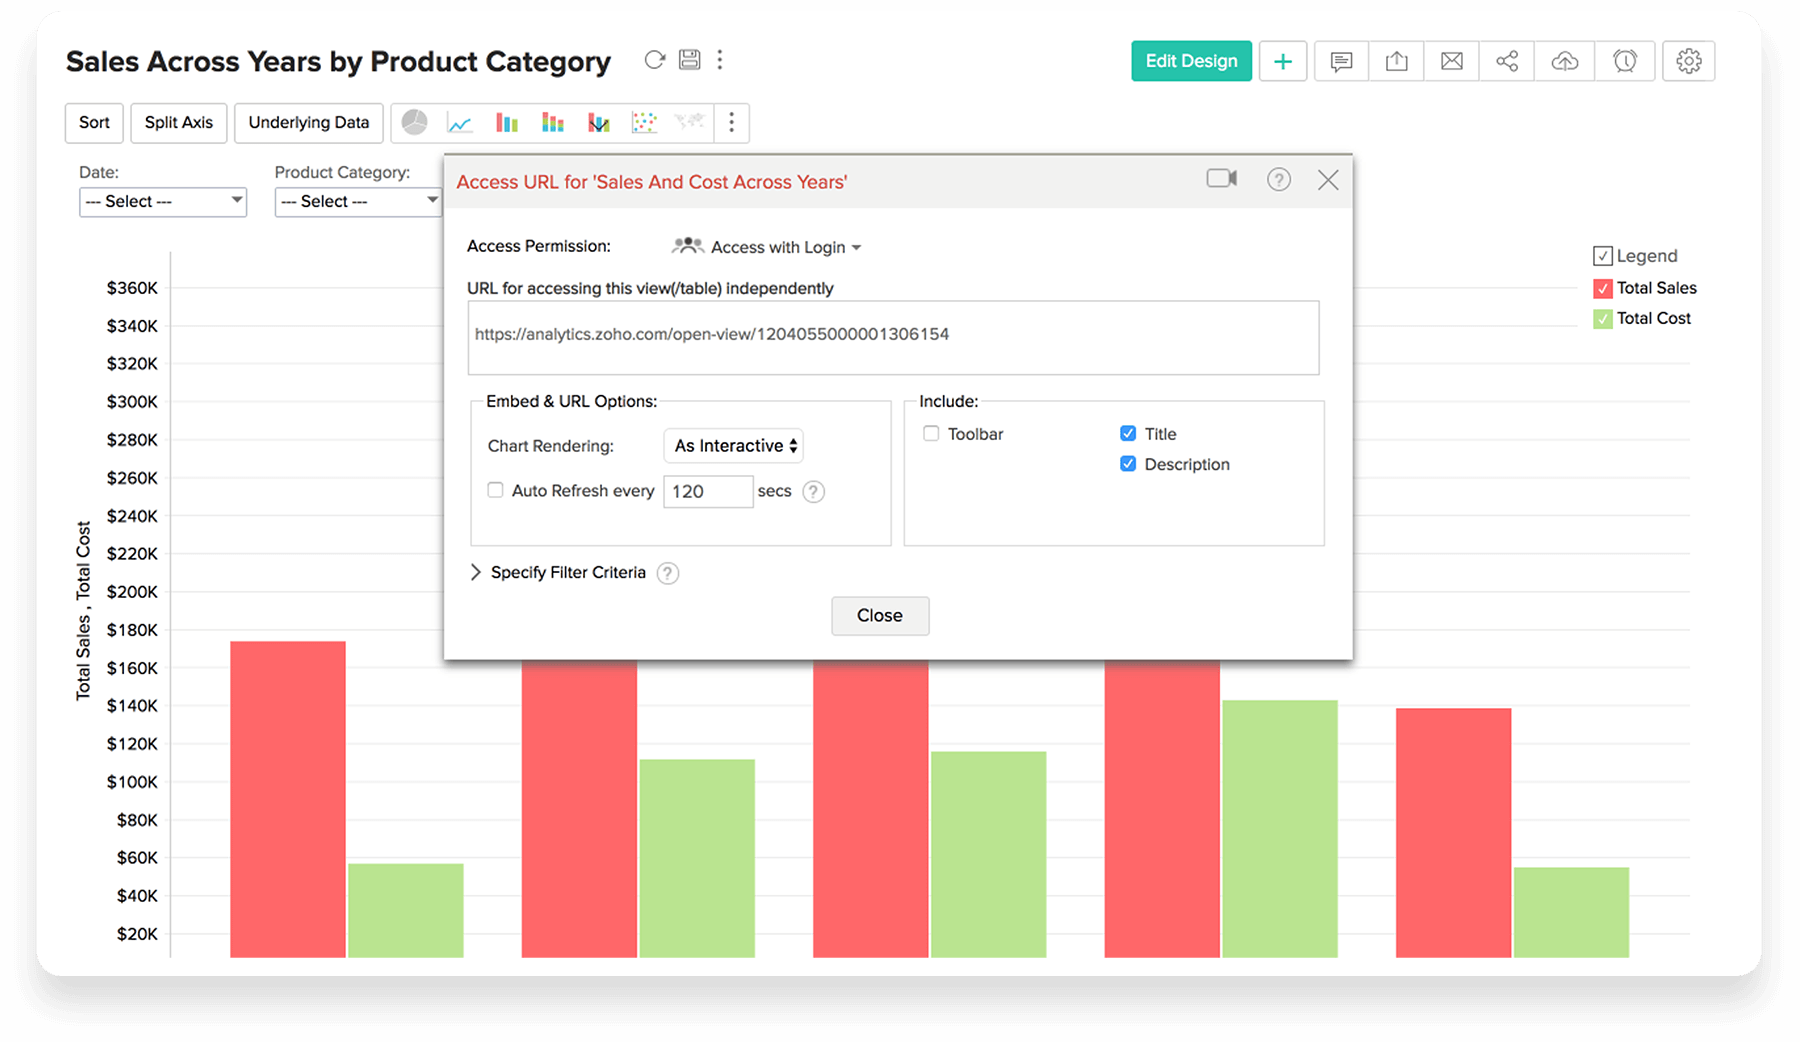
Share Link/URL
You can also generate a Link/URL for any dashboard or report, with appropriate permission, to access it standalone, directly from the browser. URLs make it easy for bookmarking and for circulation among users. Learn more
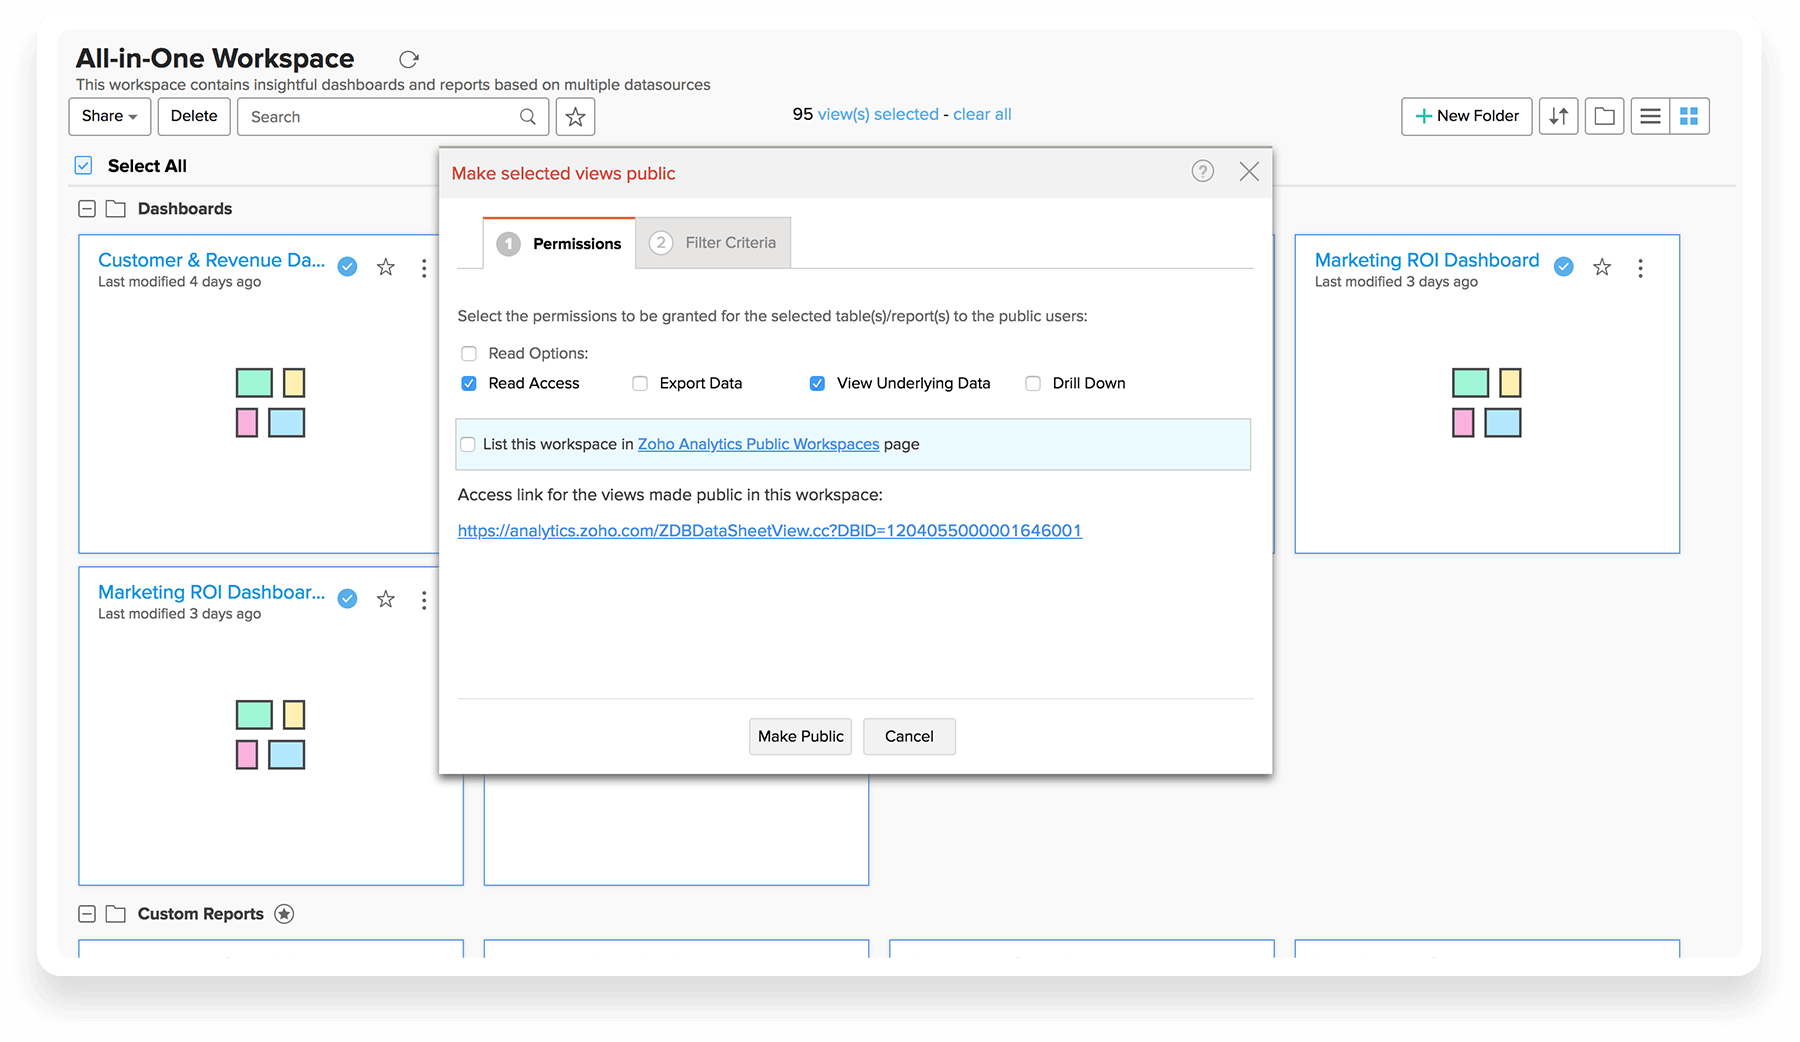
Make Views Public
You can choose to make the views created in Zoho Analytics public, thus making it accessible to everyone without login. These views can be accessed by knowing the access URL.
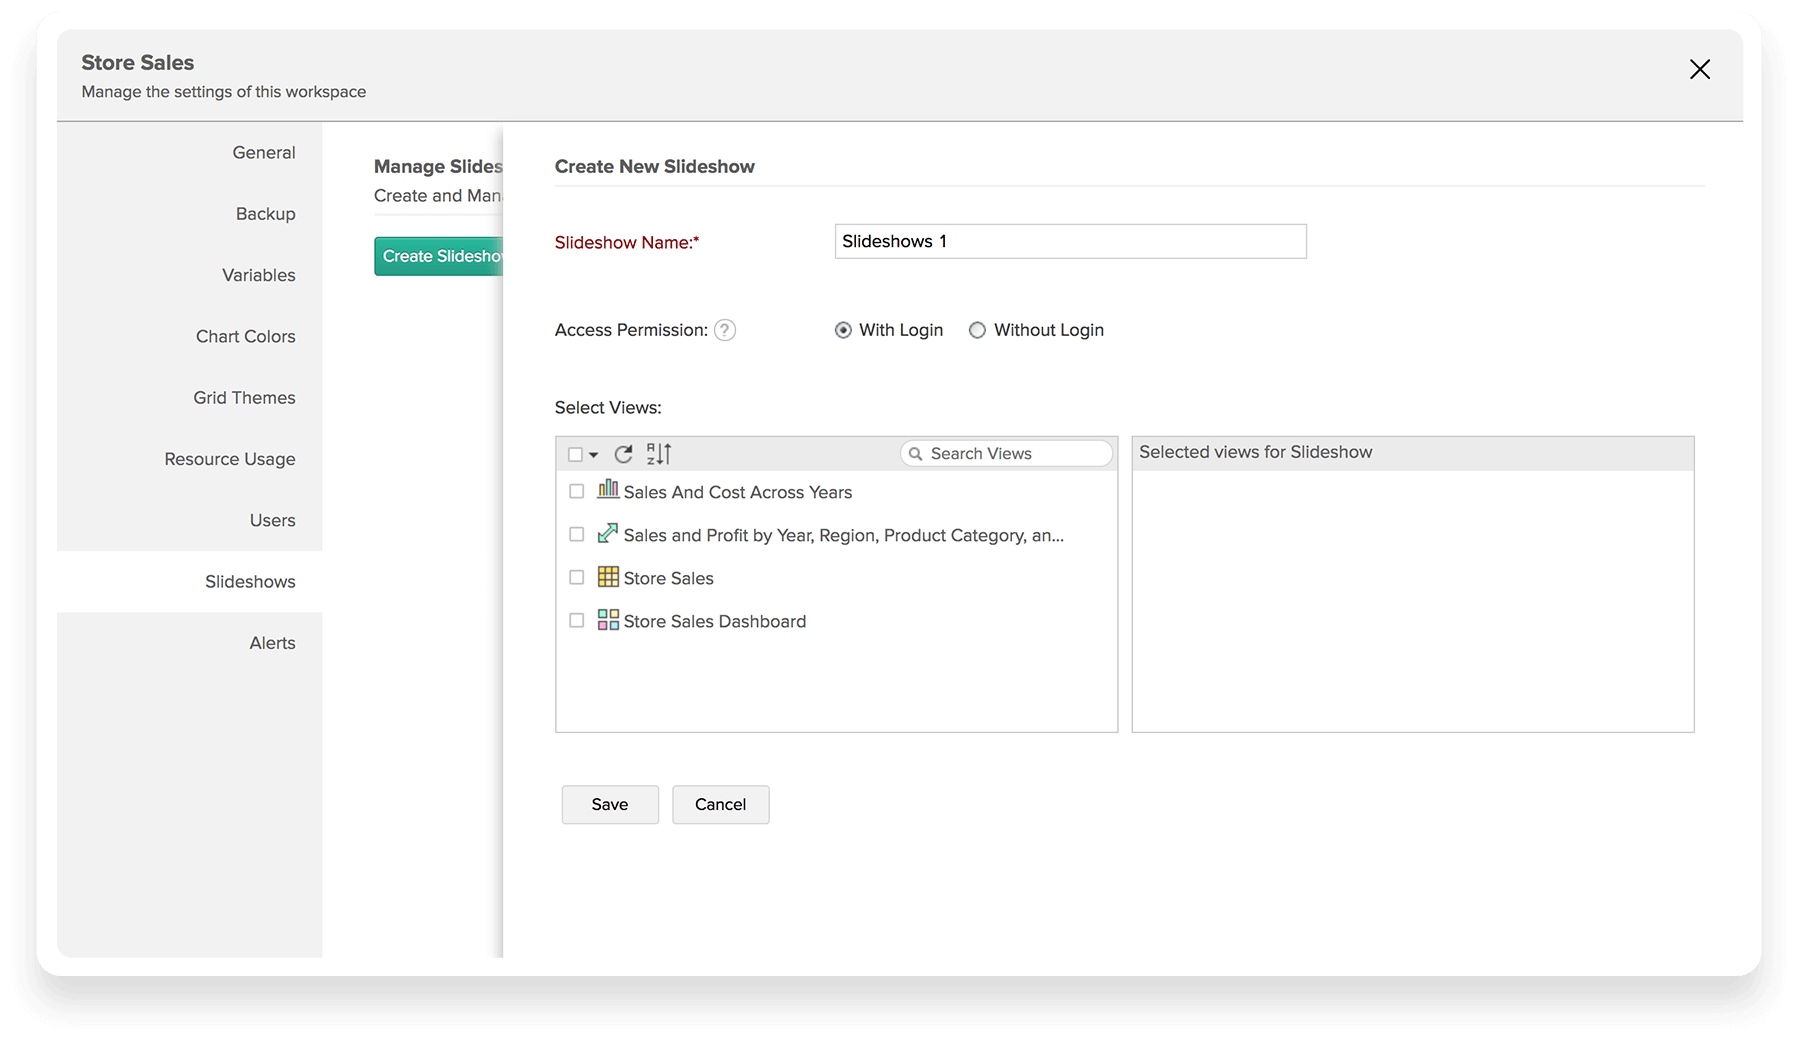
Slideshow
You will often need to exhibit your reports and dashboards live for a wider audience. Creating slideshows enables you to visually present your analytics as a story to your audience. Learn more
More Features
New users will feel comfortable working with Zoho Analytics as the interface closely resembles a spreadsheet. You can use the "spreadsheet-like" interface for easy data collection (add/edit), analysis and reporting.
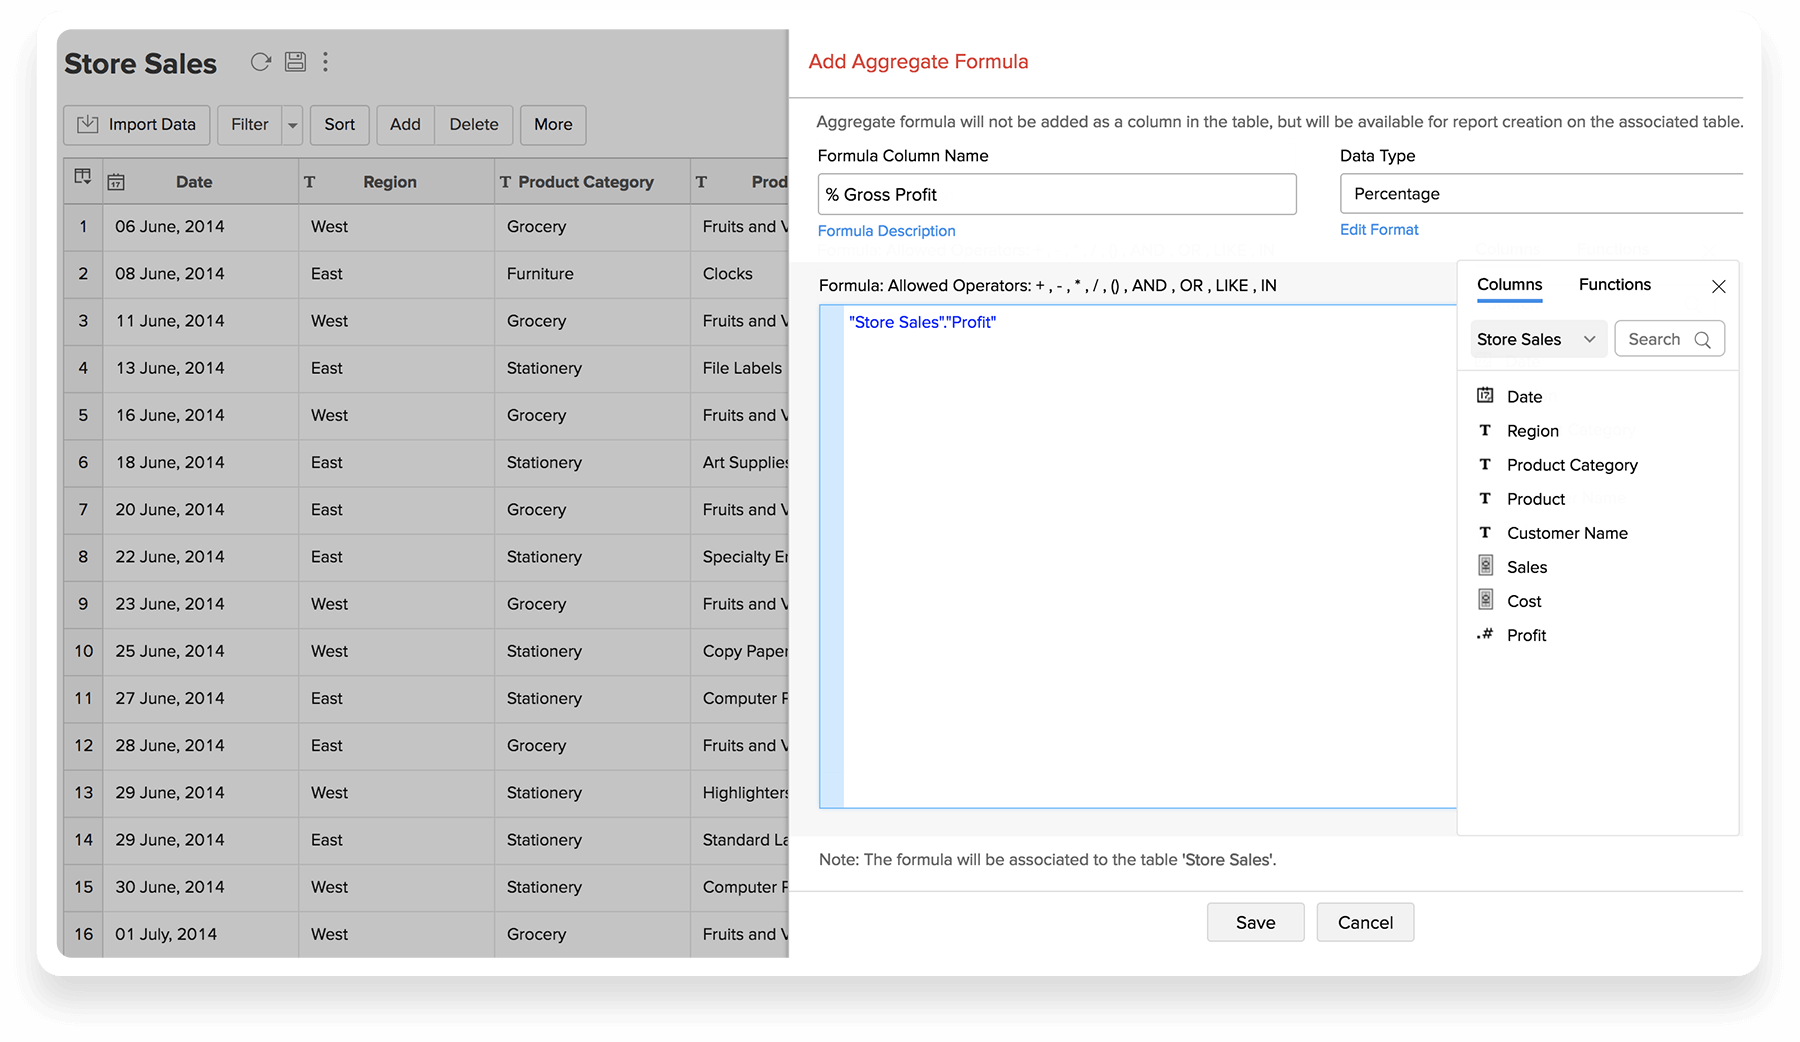
Formula Engine
Zoho Analytics has simple to use, click & apply pre-built analytical functions. Click on Add->Custom Formula in the table view, to create your own formula column based on your need. Learn more
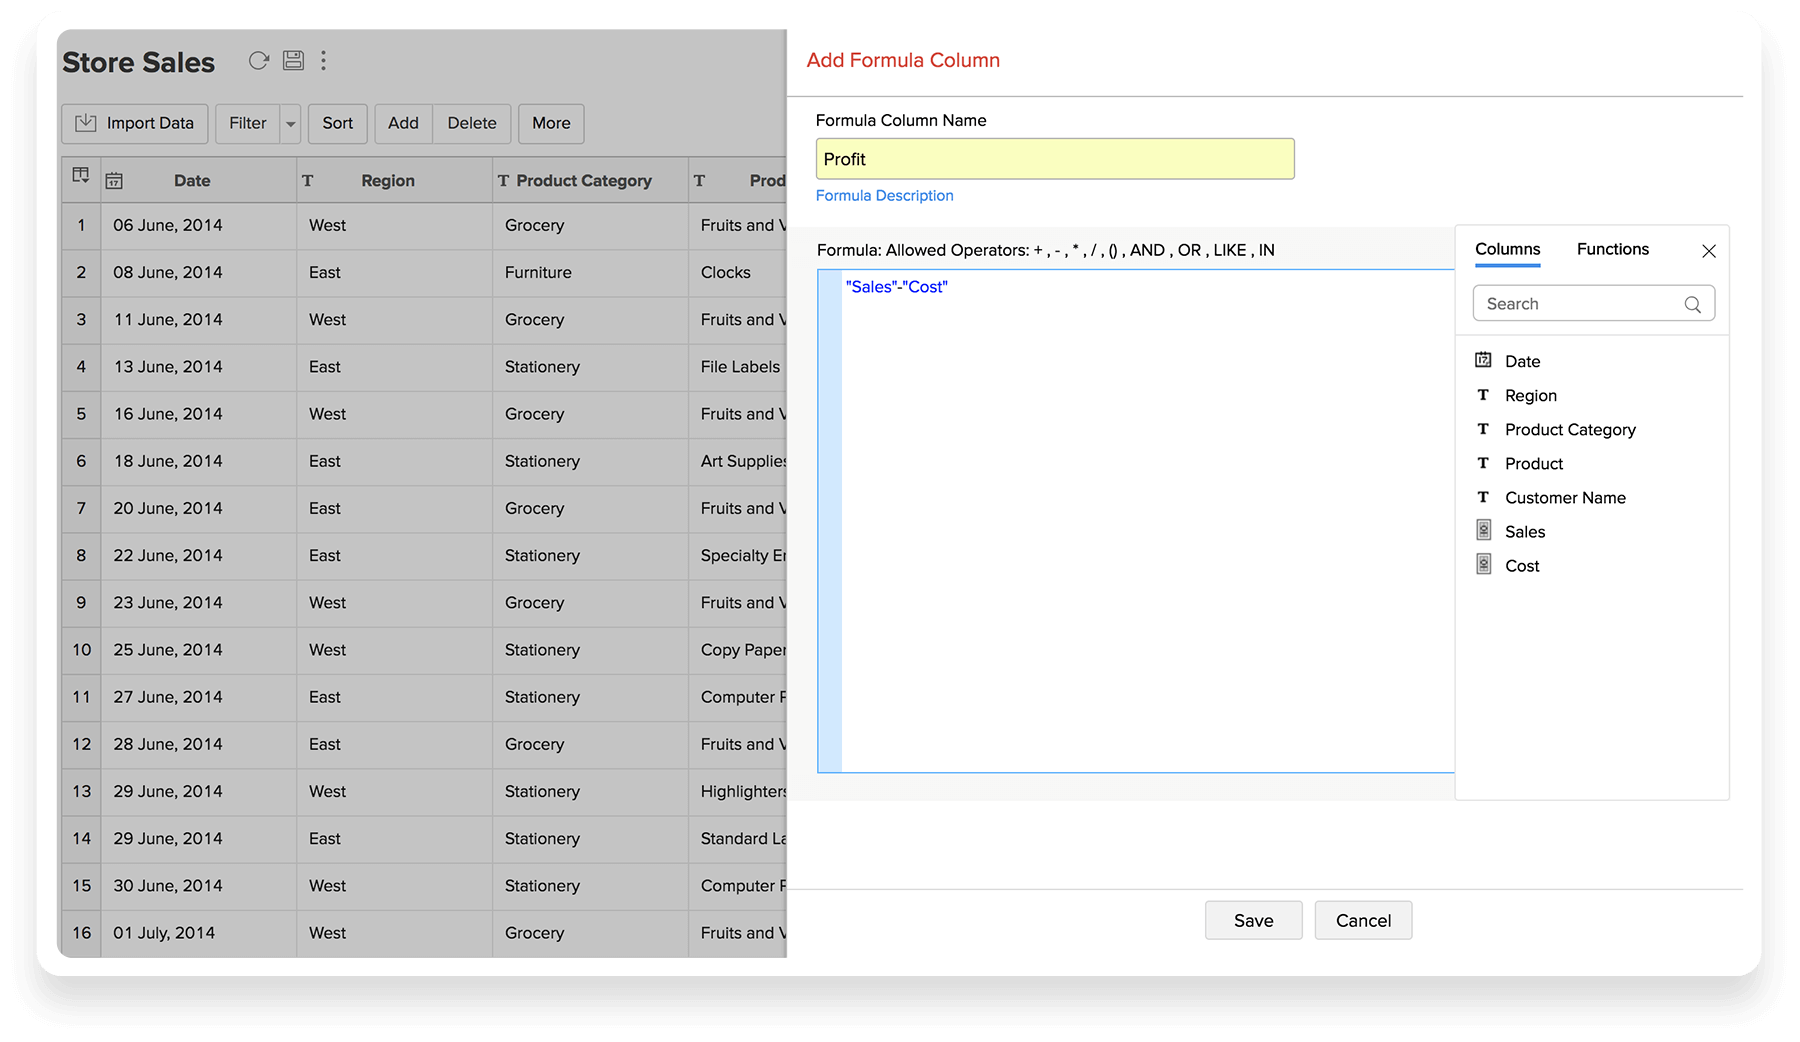
Click on Add
Aggregate Formula in the table view, to create your own formula column based on your need.
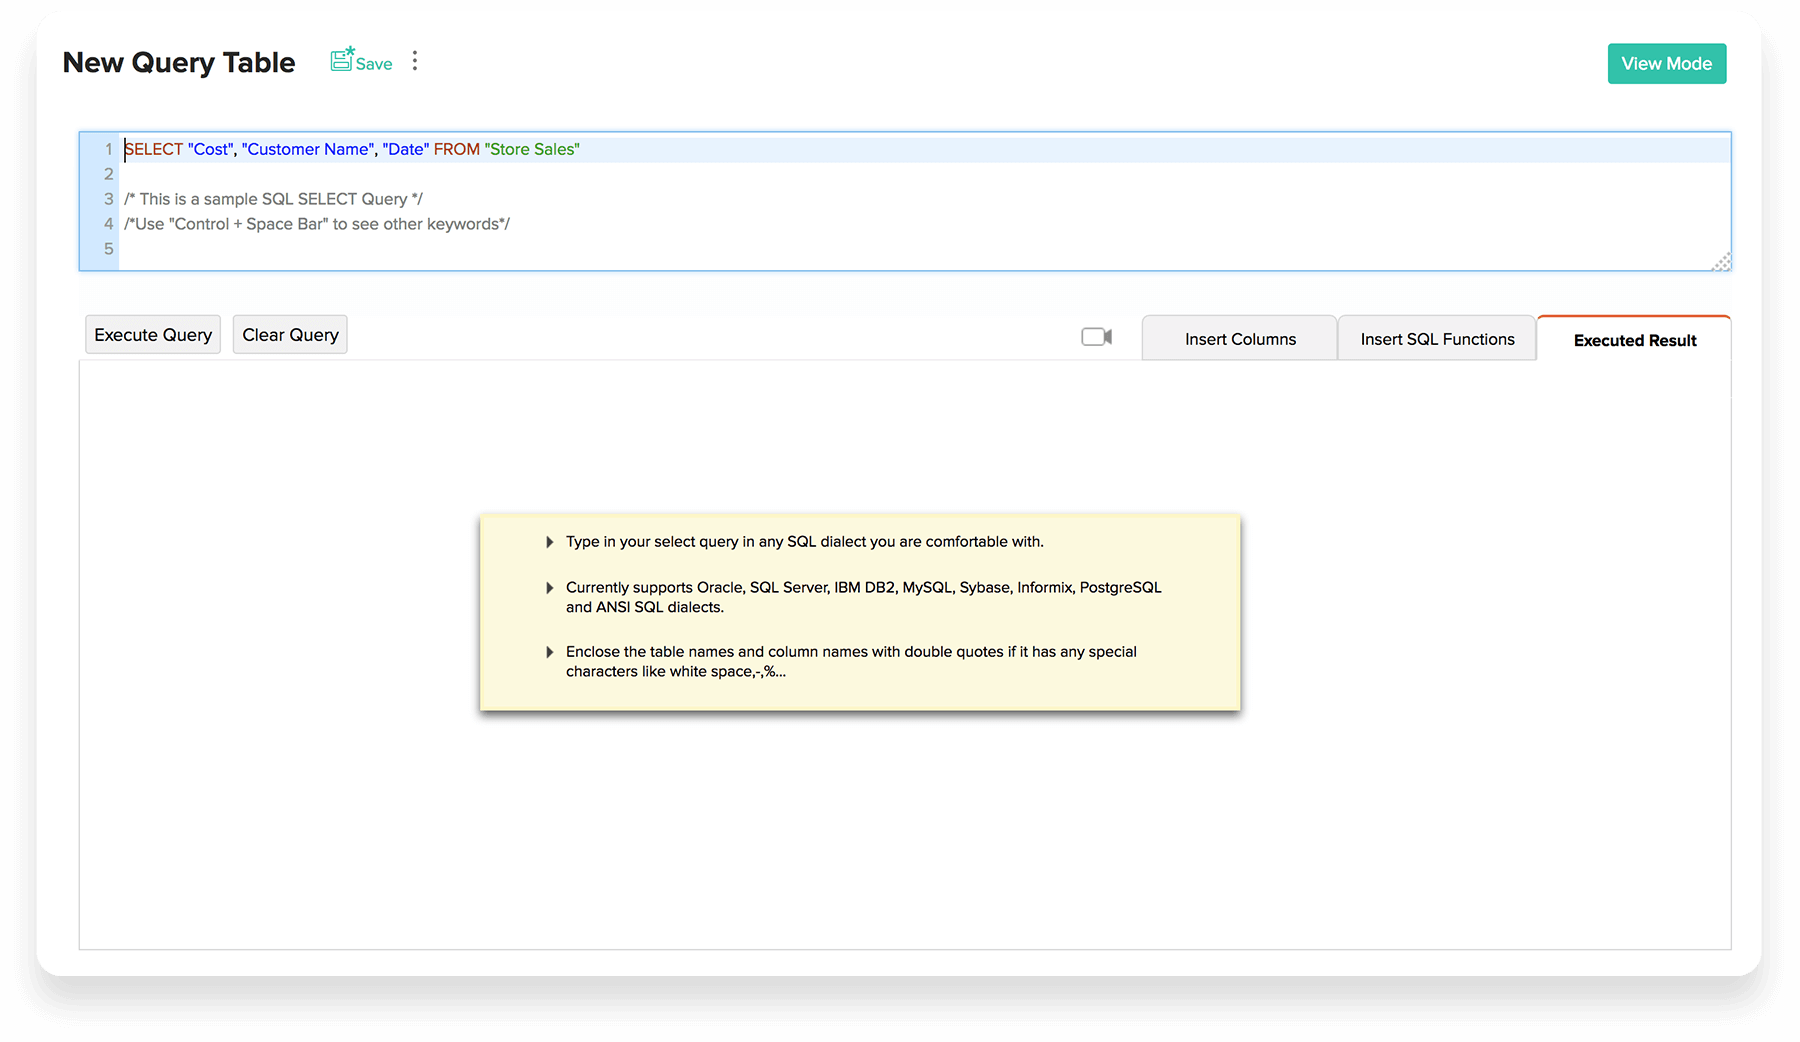
Query Table
Query the data using SQL to create powerful and flexible reports. You could construct SQL SELECT queries in any of the known database SQL dialects. Click on New -> New Query Tablefor creating your SQL query.
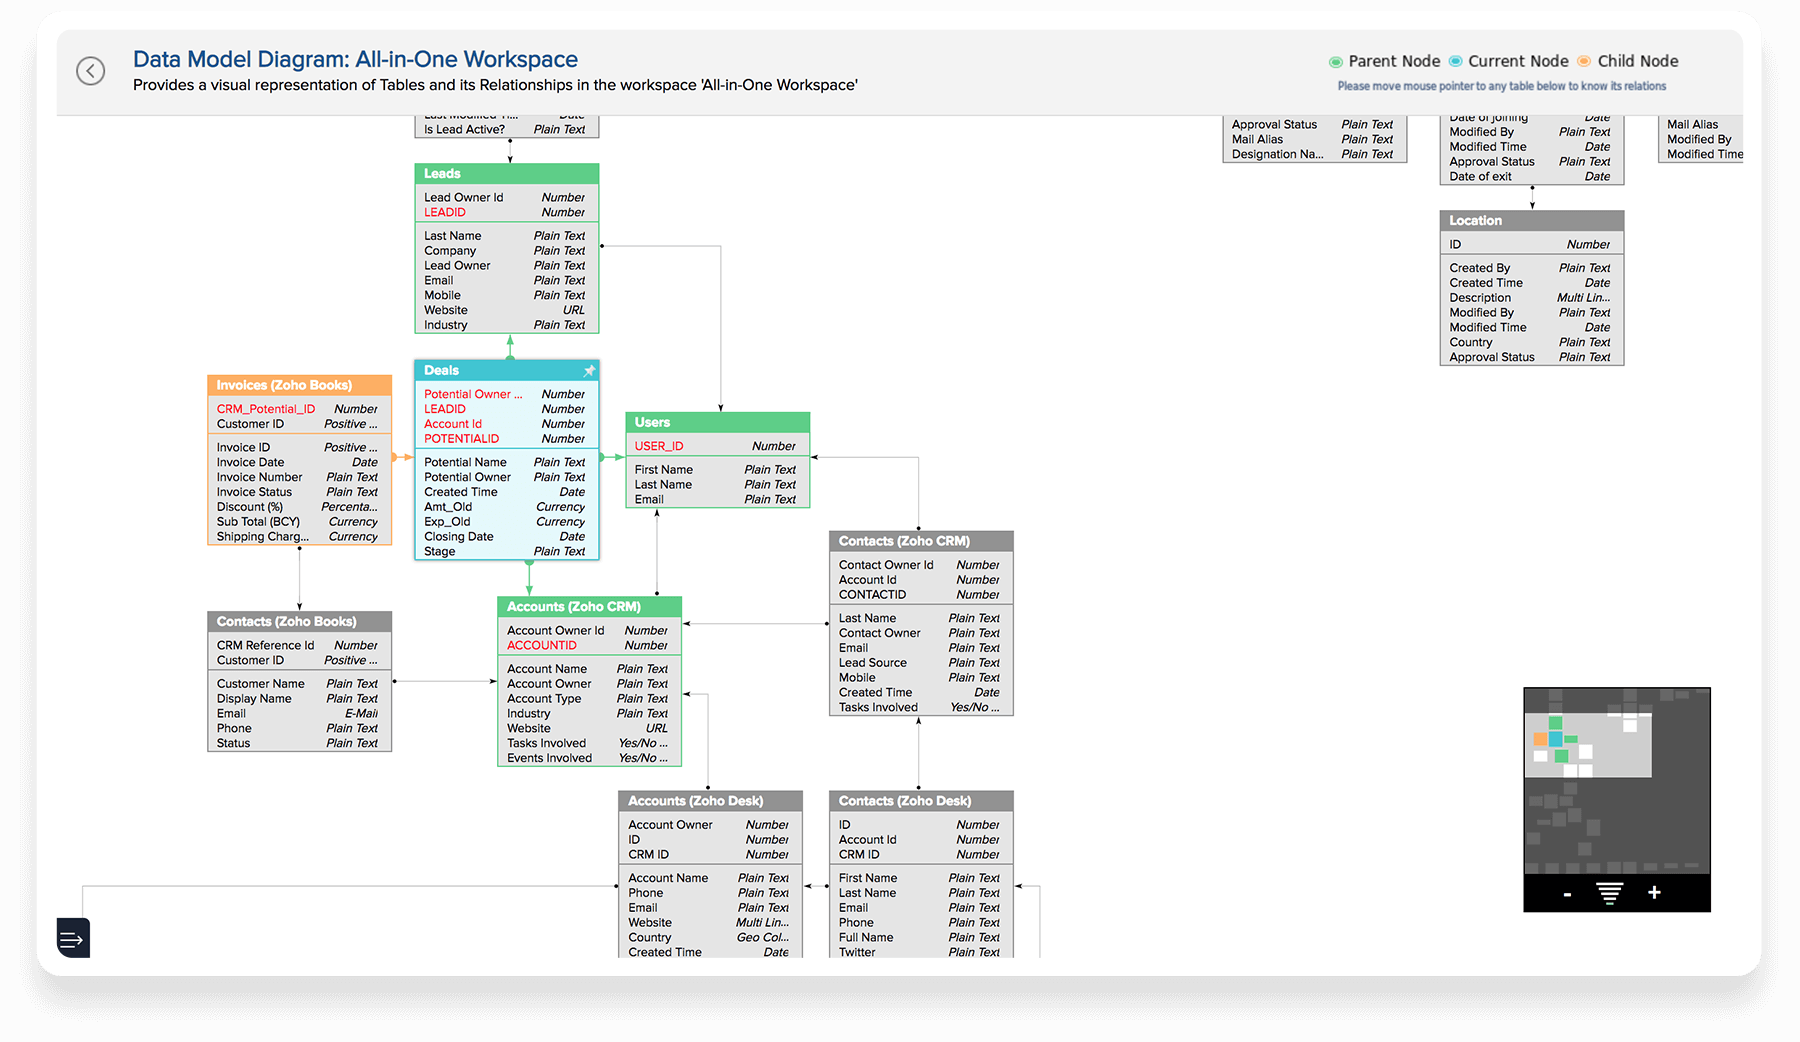
Model Diagrams
Model diagrams give a panoramic view of your reporting workspace. They give a visual representation of the tables and their relationships.
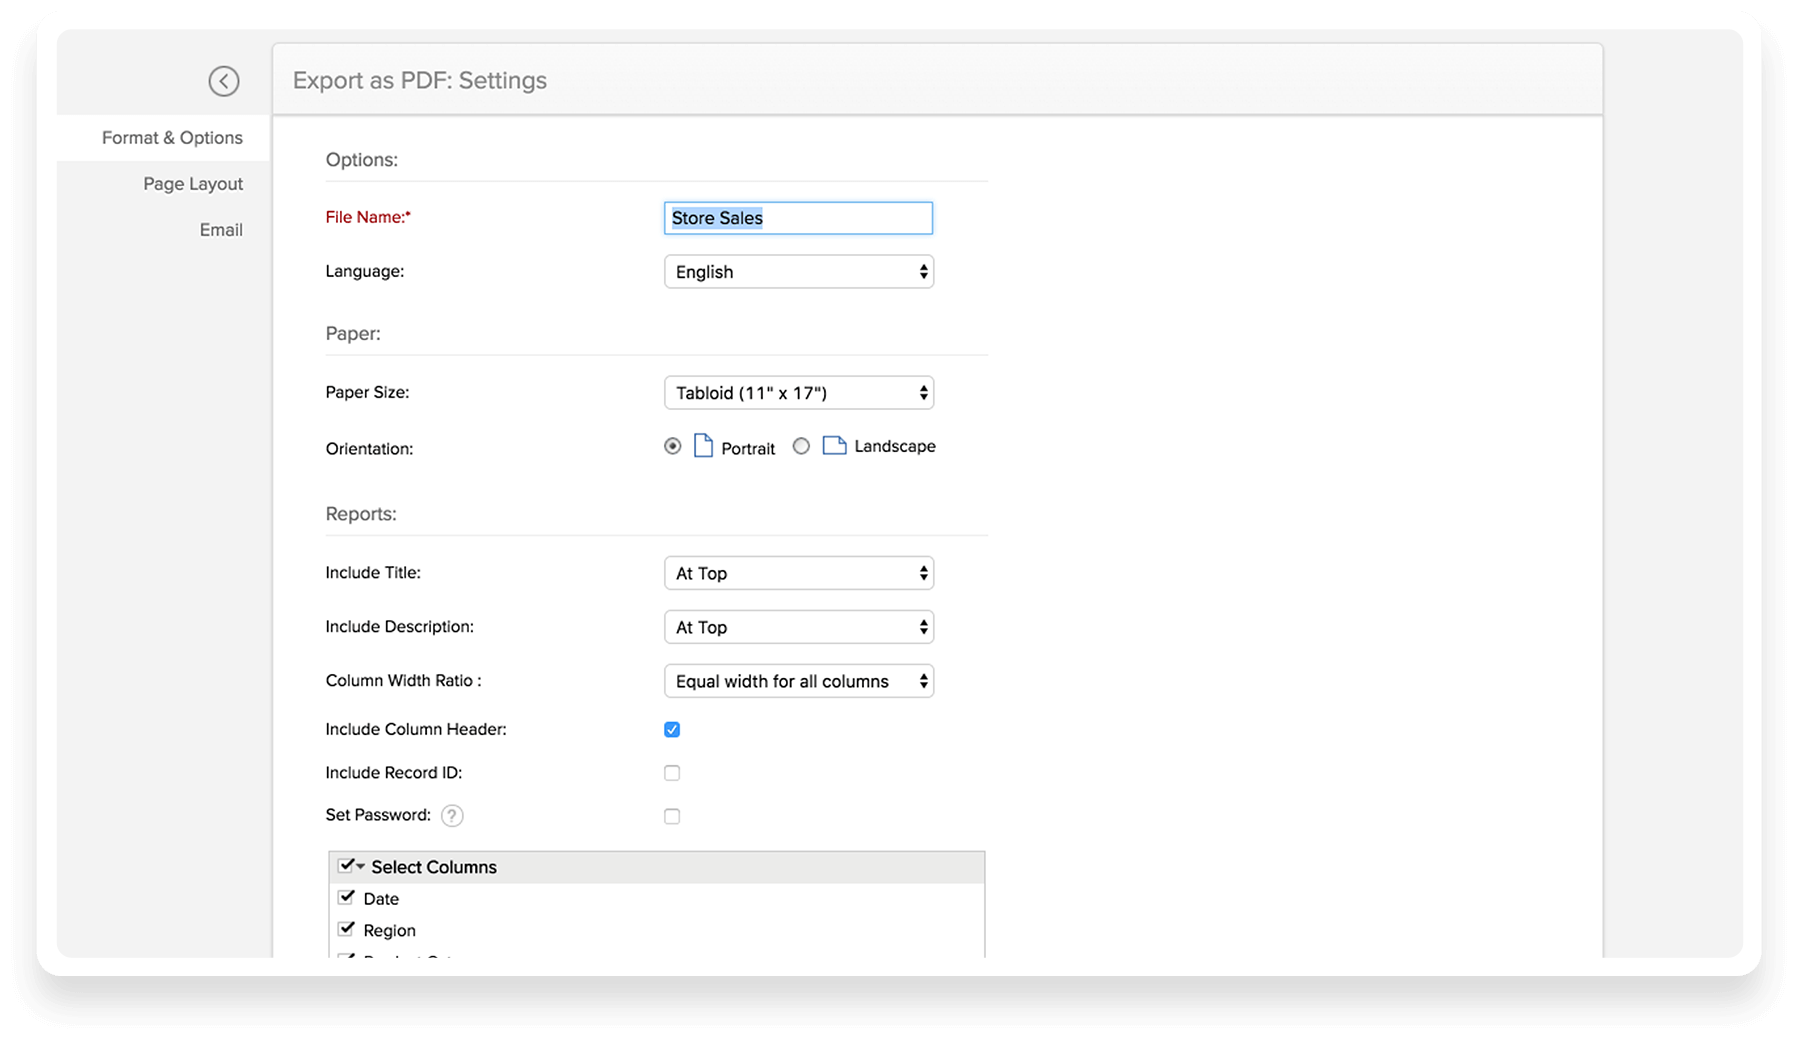
Printer Friendly
All the reports can be exported into a printer-friendly PDF files. You can customize the headers and footers in the PDF. You can also generate page numbers and table of contents. Learn more
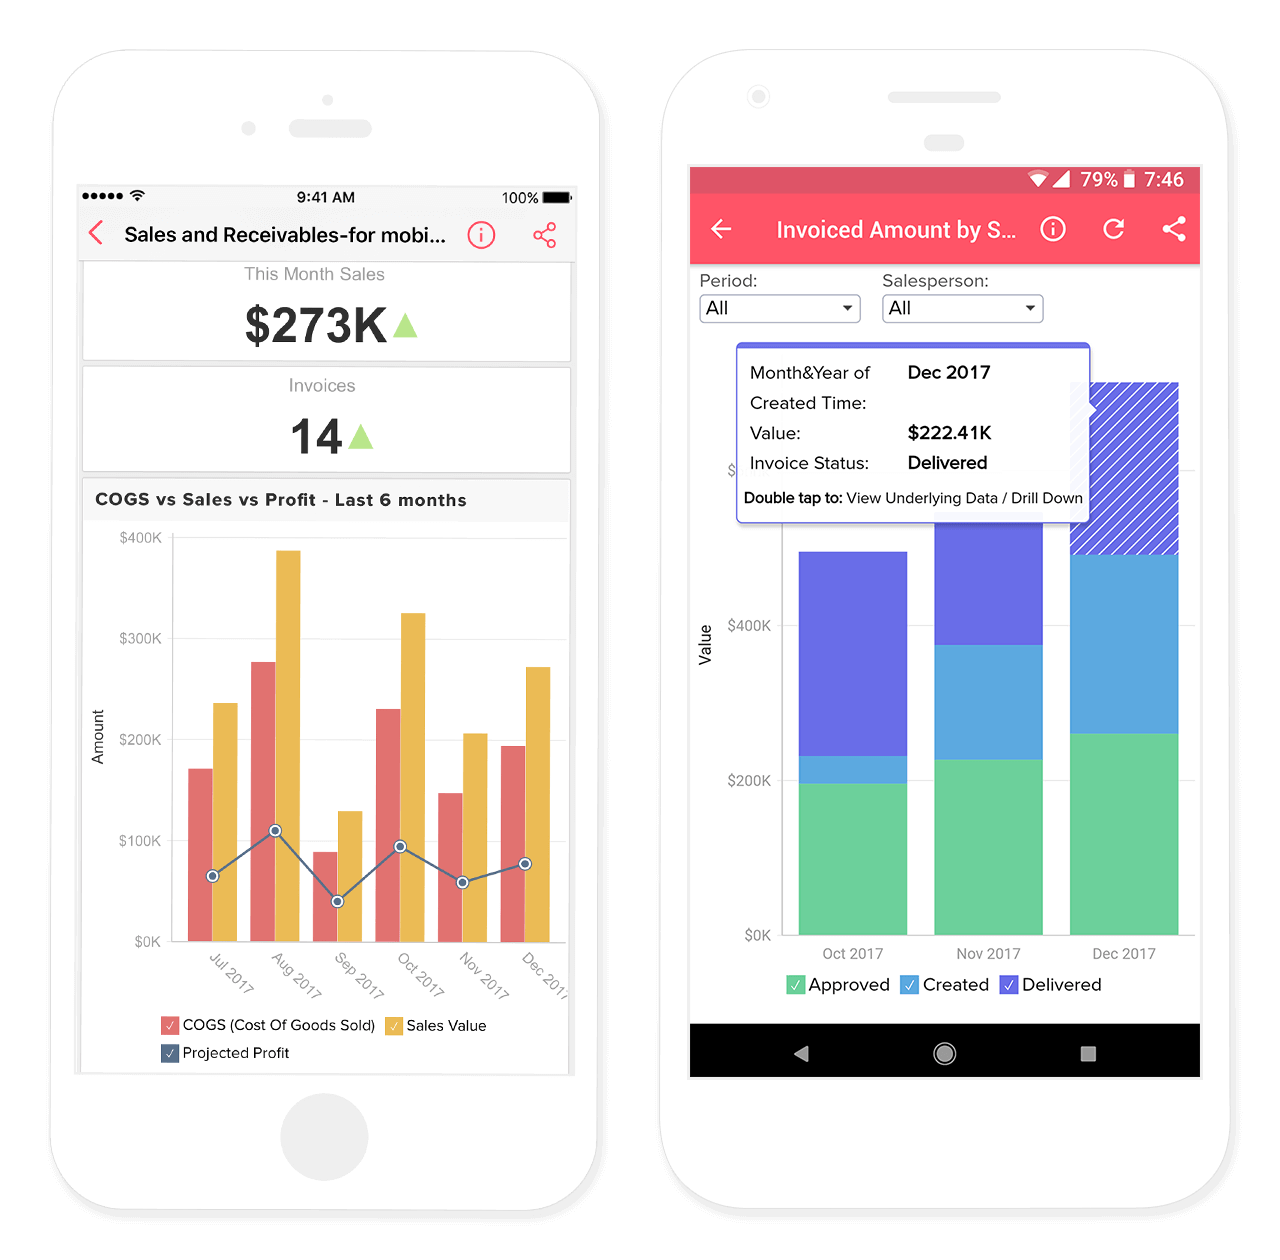
Mobile BI
Access and interact with the reports & dashboards that you create in Zoho Analytics service, on-the-move, from your iOS and Android-powered mobile devices. Learn more
"Generating reports is made super easy with their intuitive UI and excellent data integration. I also thoroughly enjoy the reporting options."

Joseph R. Sweeney
Senior Investigations Analyst at The TJX Companies, Inc.
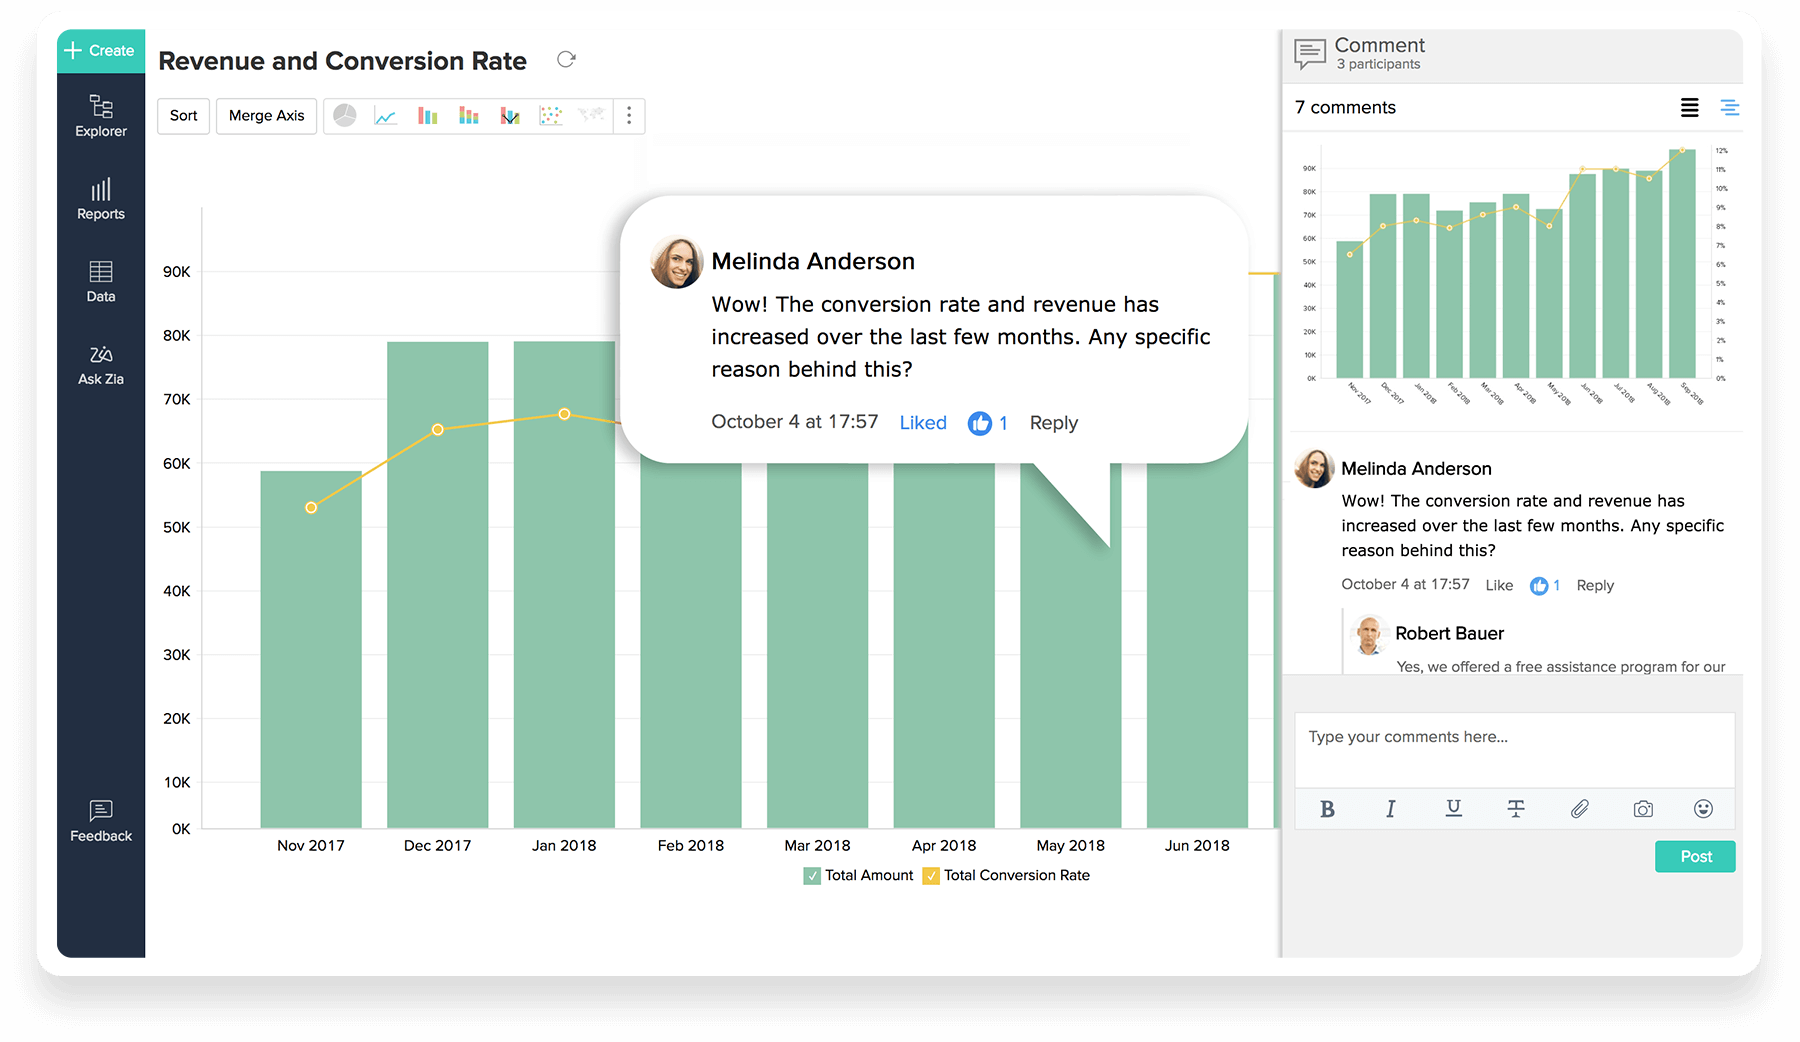
Commenting
Enable comments on any shared report or dashboard. Start commenting in real time and make data driven decisions together with your shared users.