Get end-to-end insights on your order management with ShipStation Analytics
Understand order distribution by customers, region and much more. Track the order pattern for different products and monitor shipment activities across multiple carriers and locations.
Sign up in less than 60 seconds
Analyze shipping insights in depth

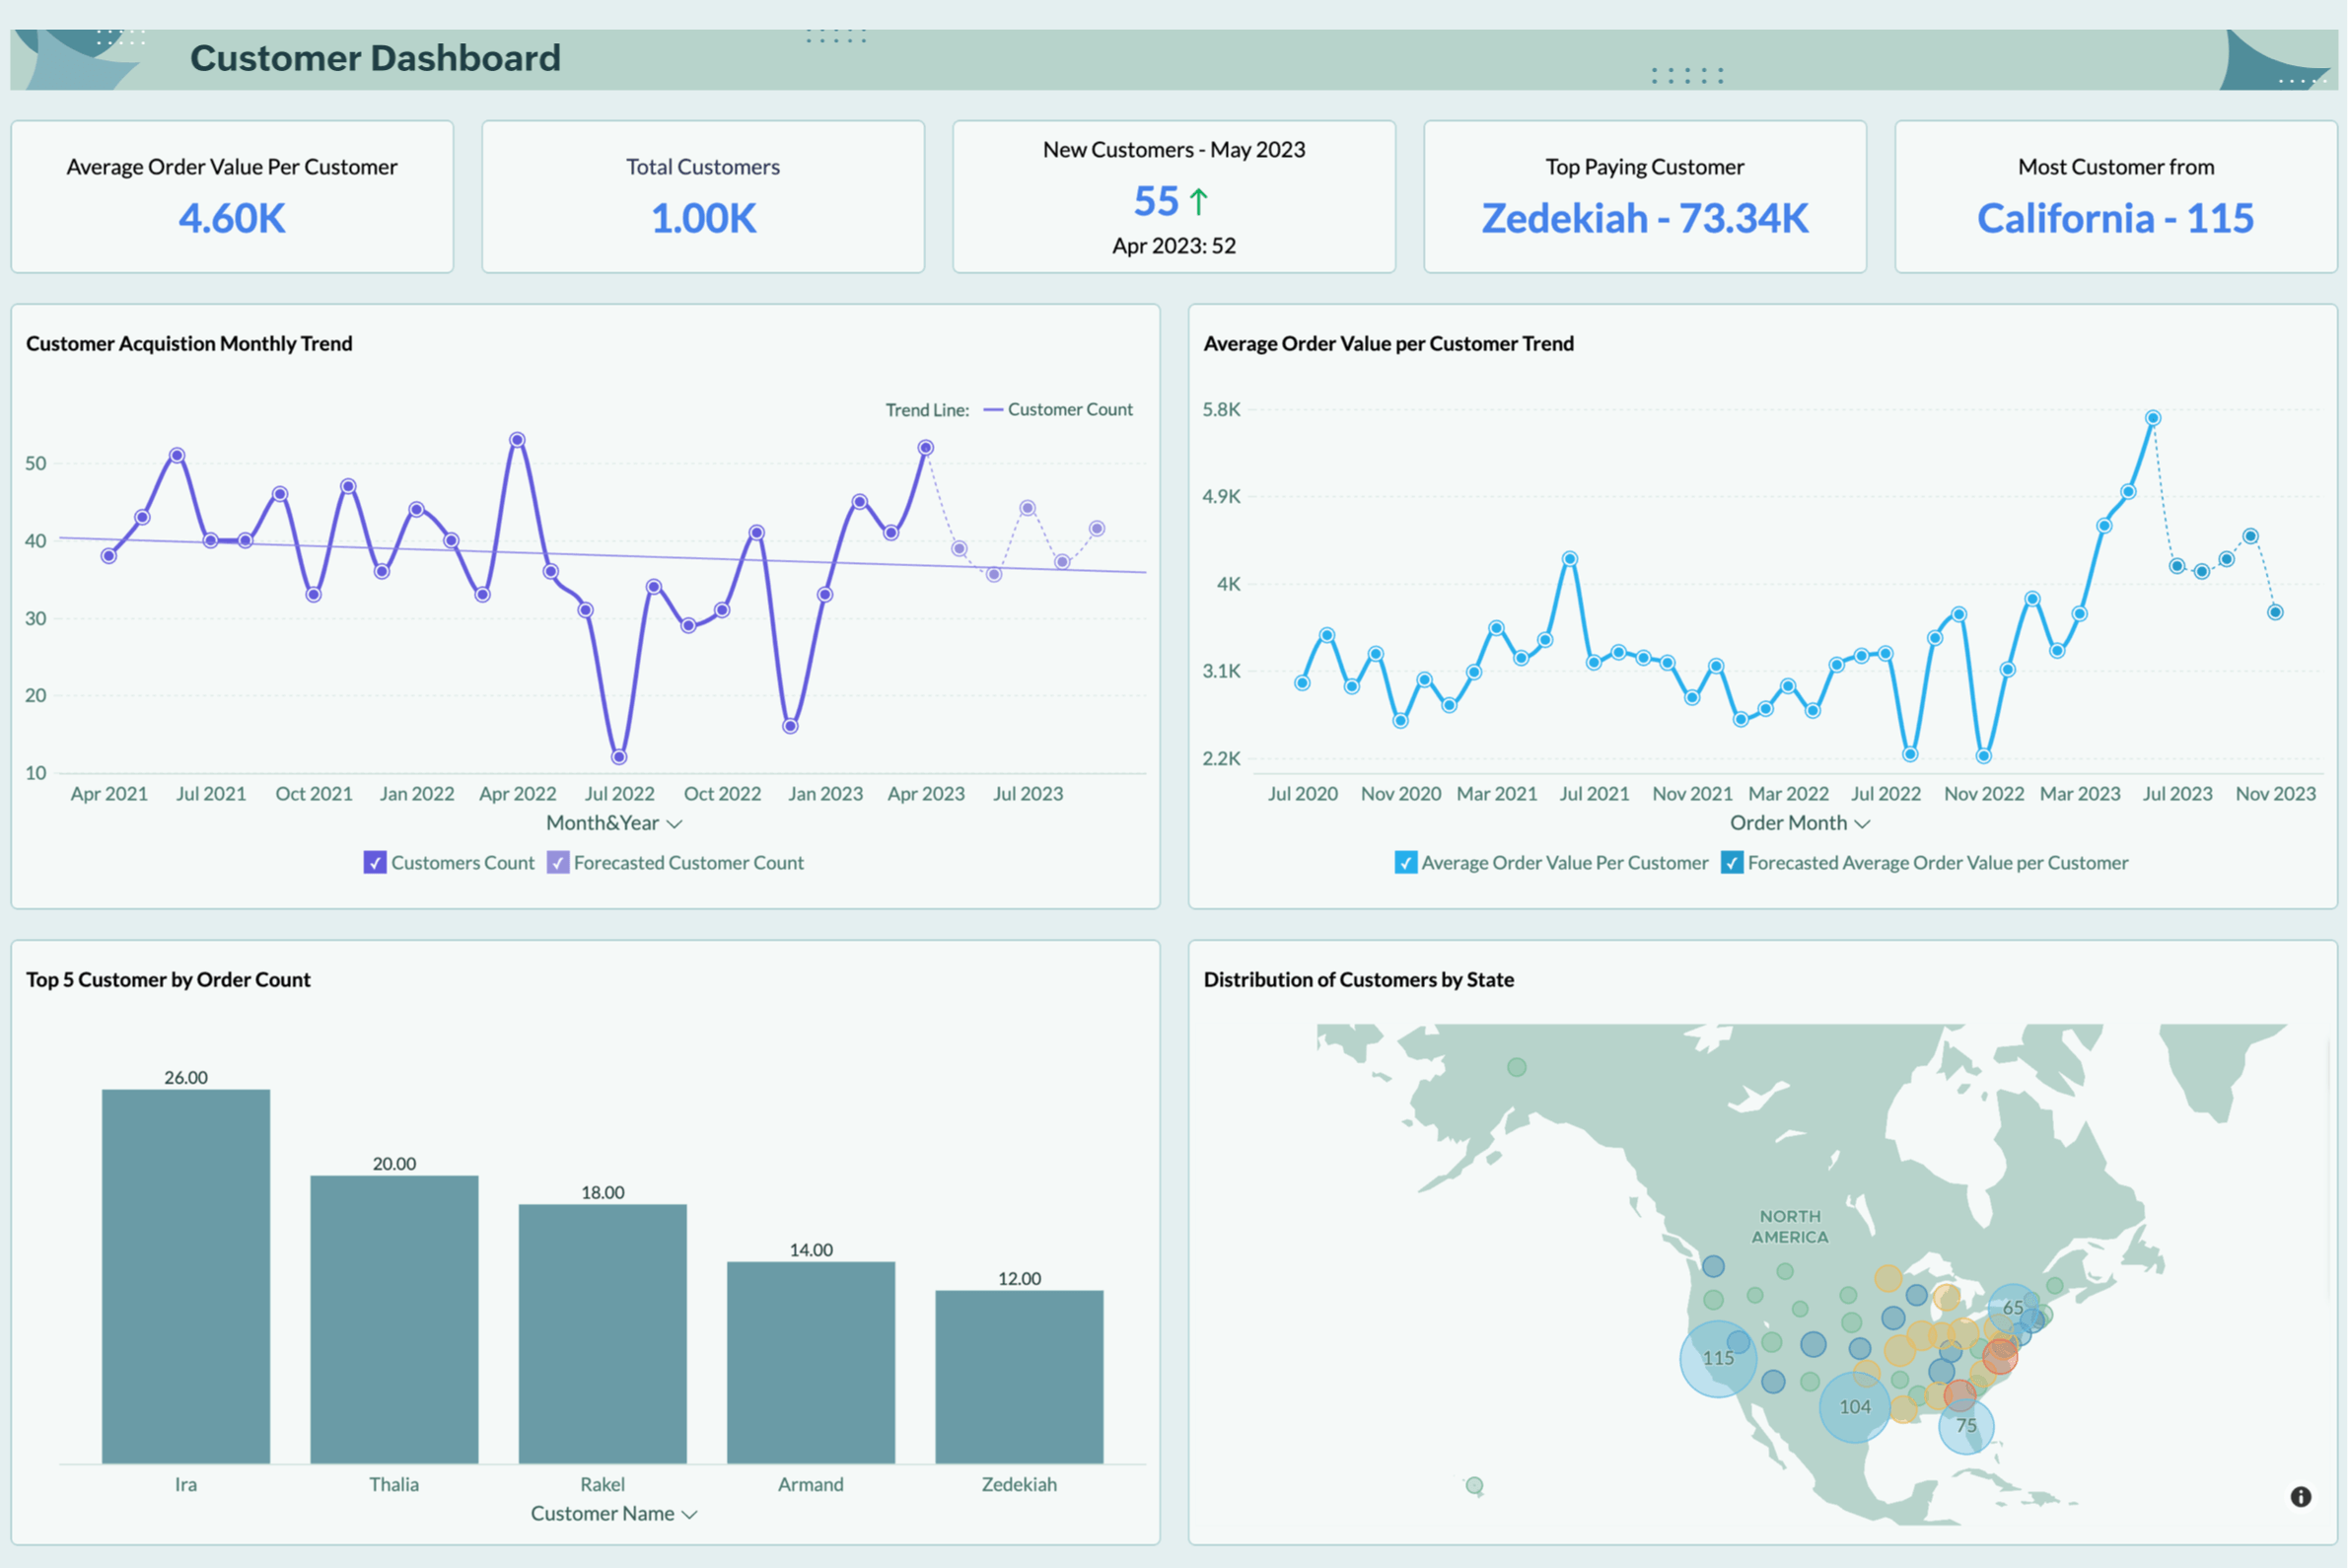
Customer Details
Track customer acquisition trend over any given time-period. Measure key indicators like average value per customer, order count and value by customers. Understand customer distribution across regions and marketplace.
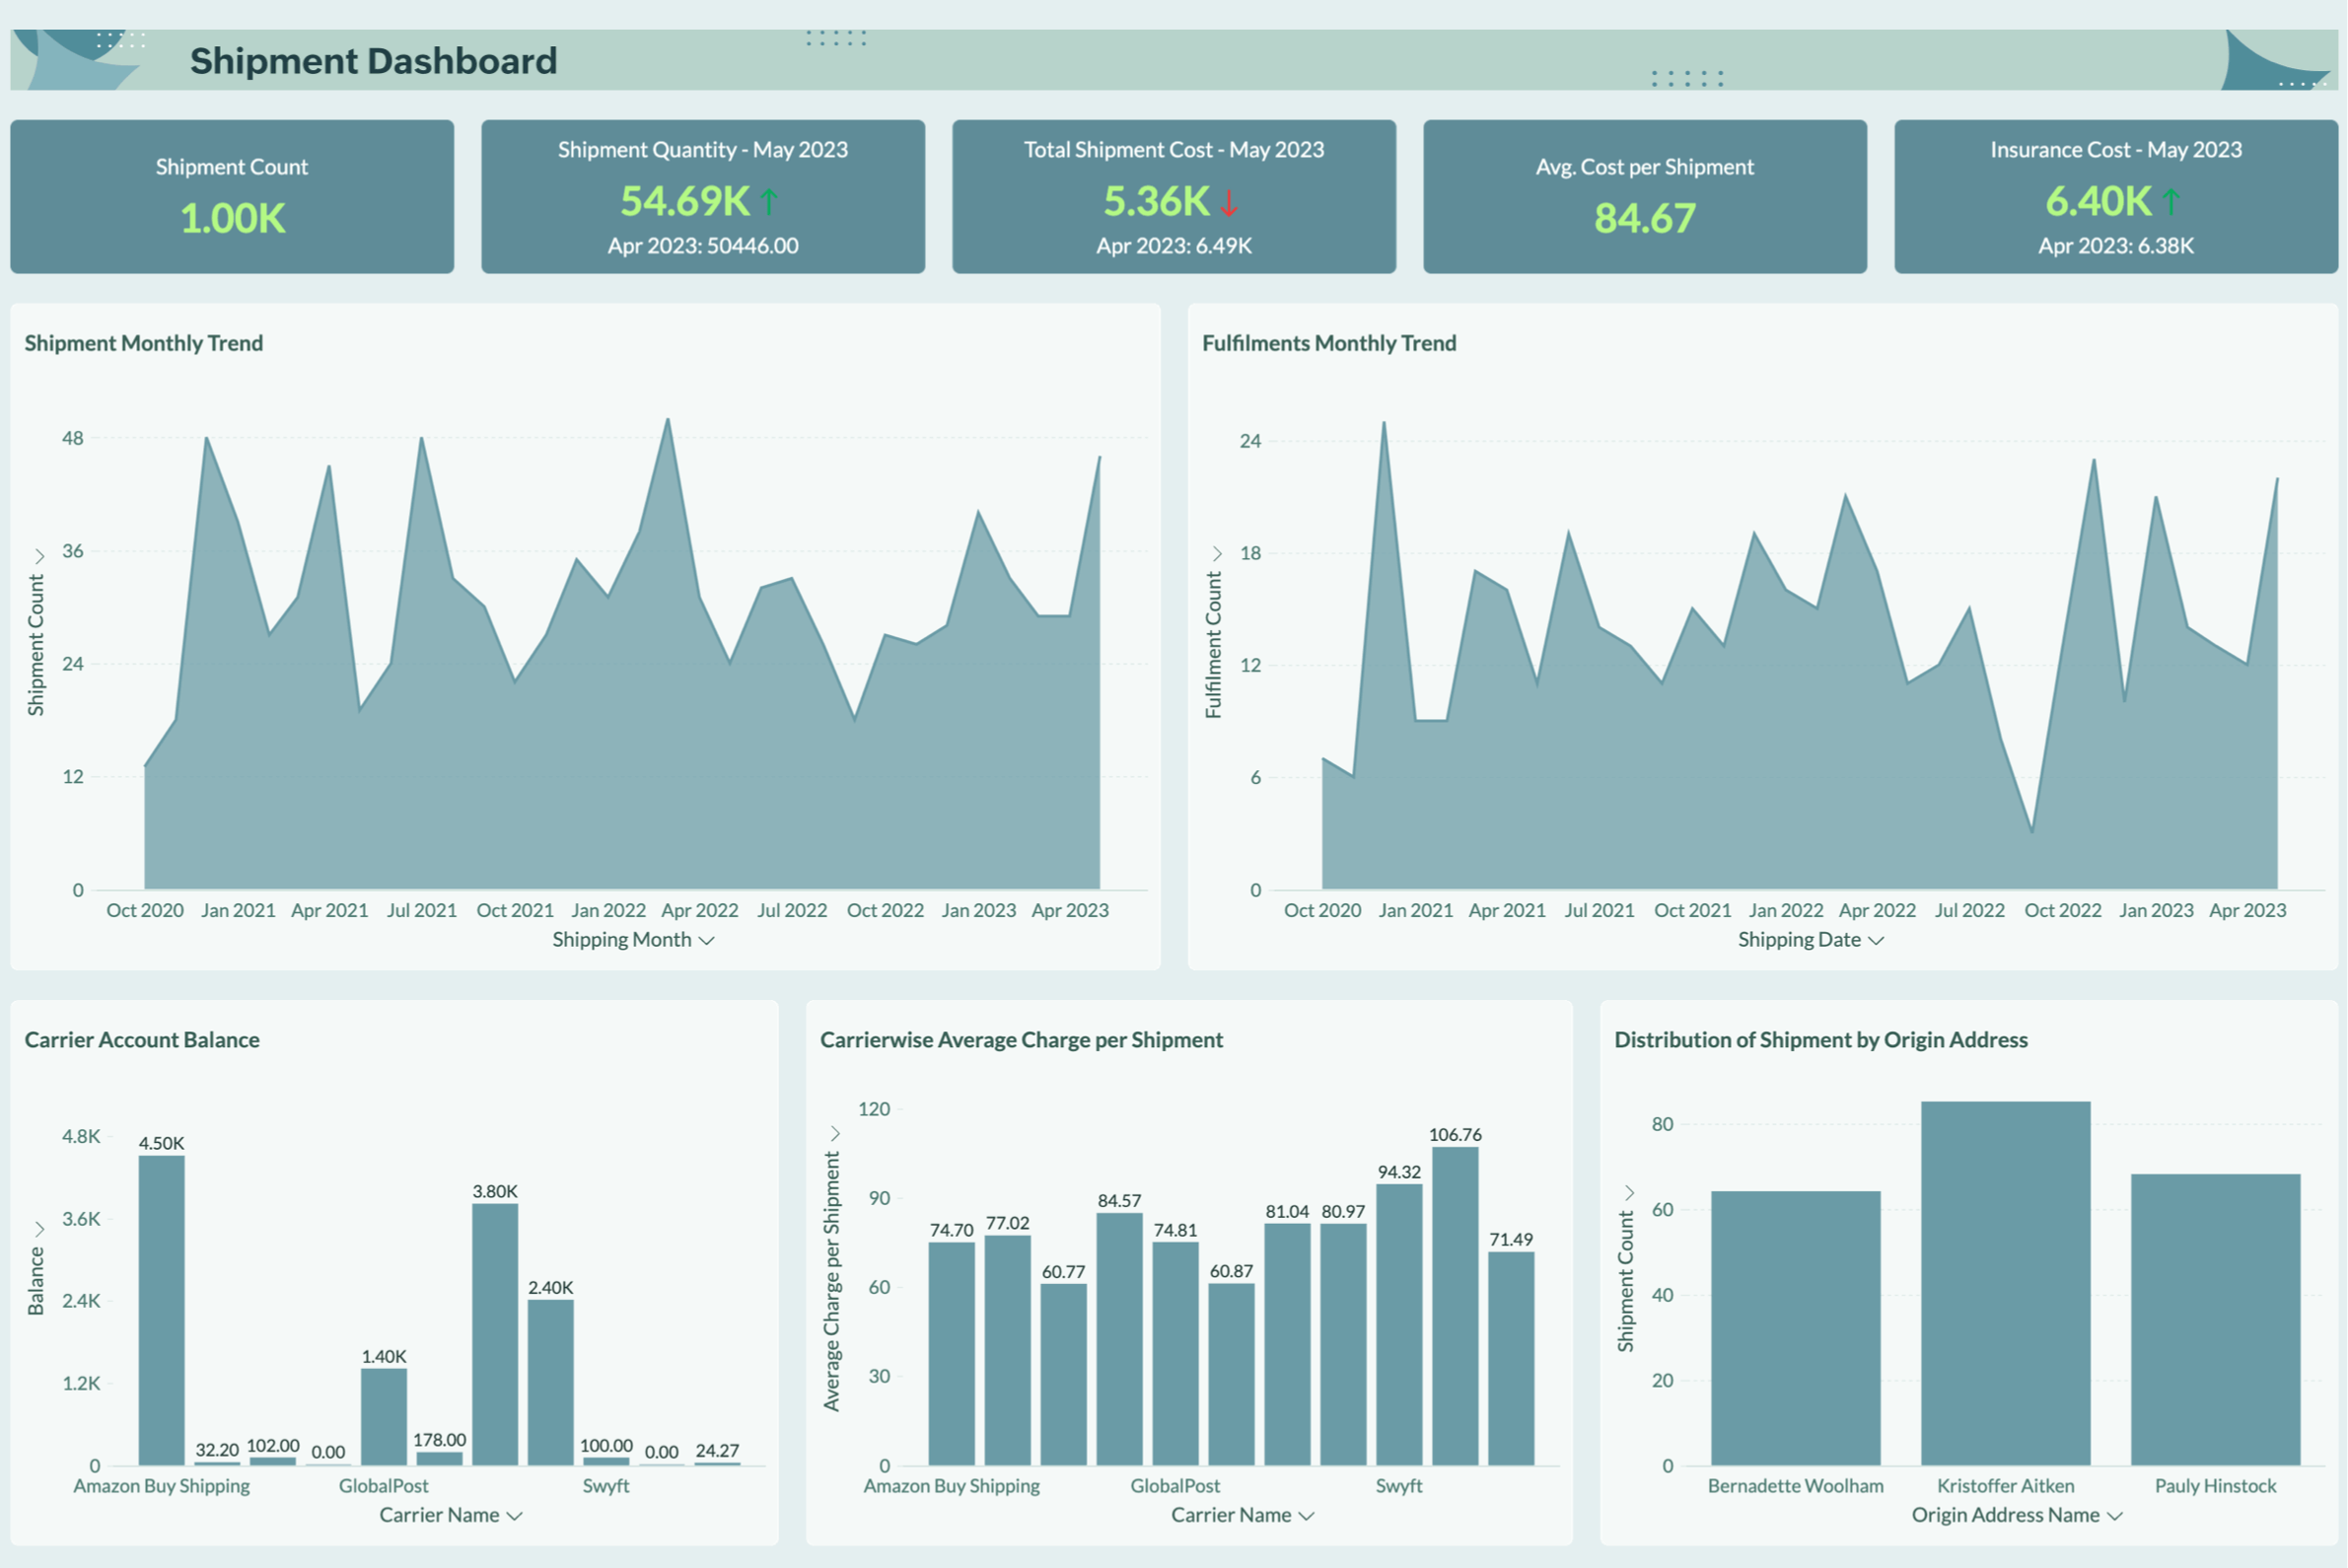
Shipment Summary
Measure total shipment cost, quantity, average cost per shipment and insurance cost in real-time. Track fulfilments by duration and region. Also understand the breakup of void vs non-void shipment over any given duration.


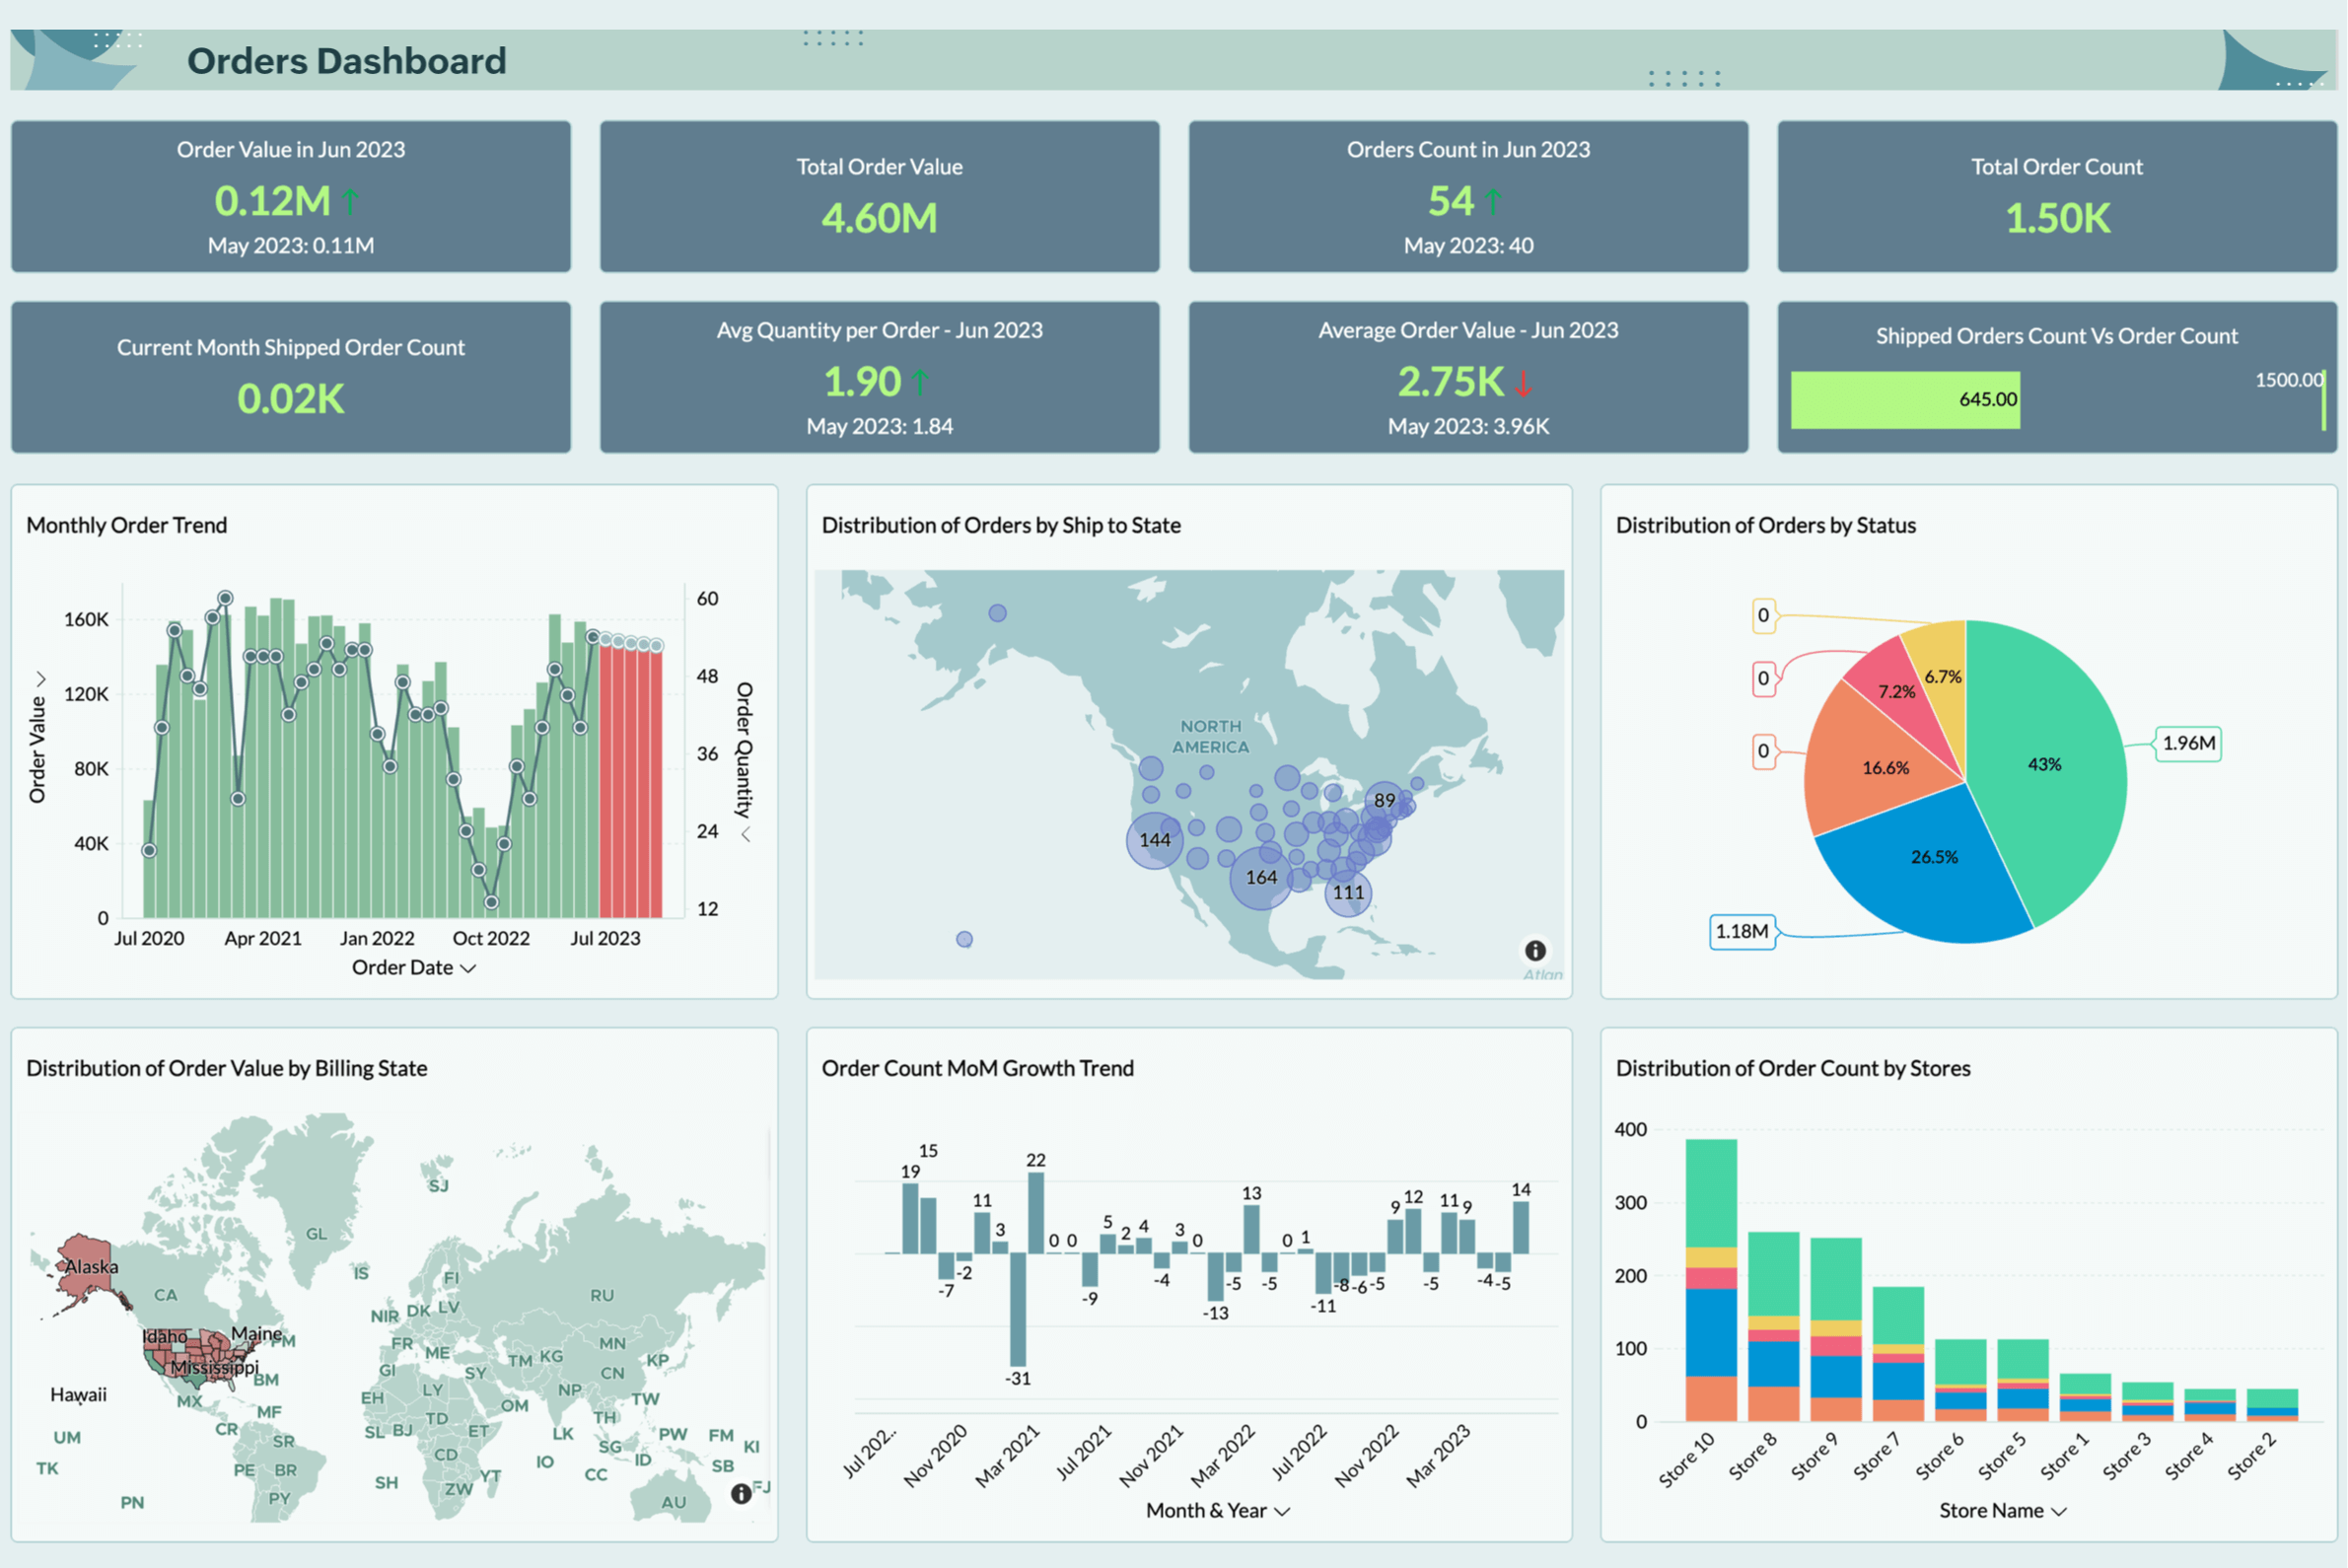
Orders Overview
Understand order distribution through various facets like carrier, payment method, order status, stores and region. Monitor order count, shipped orders, order value and average quantity per order in real-time.
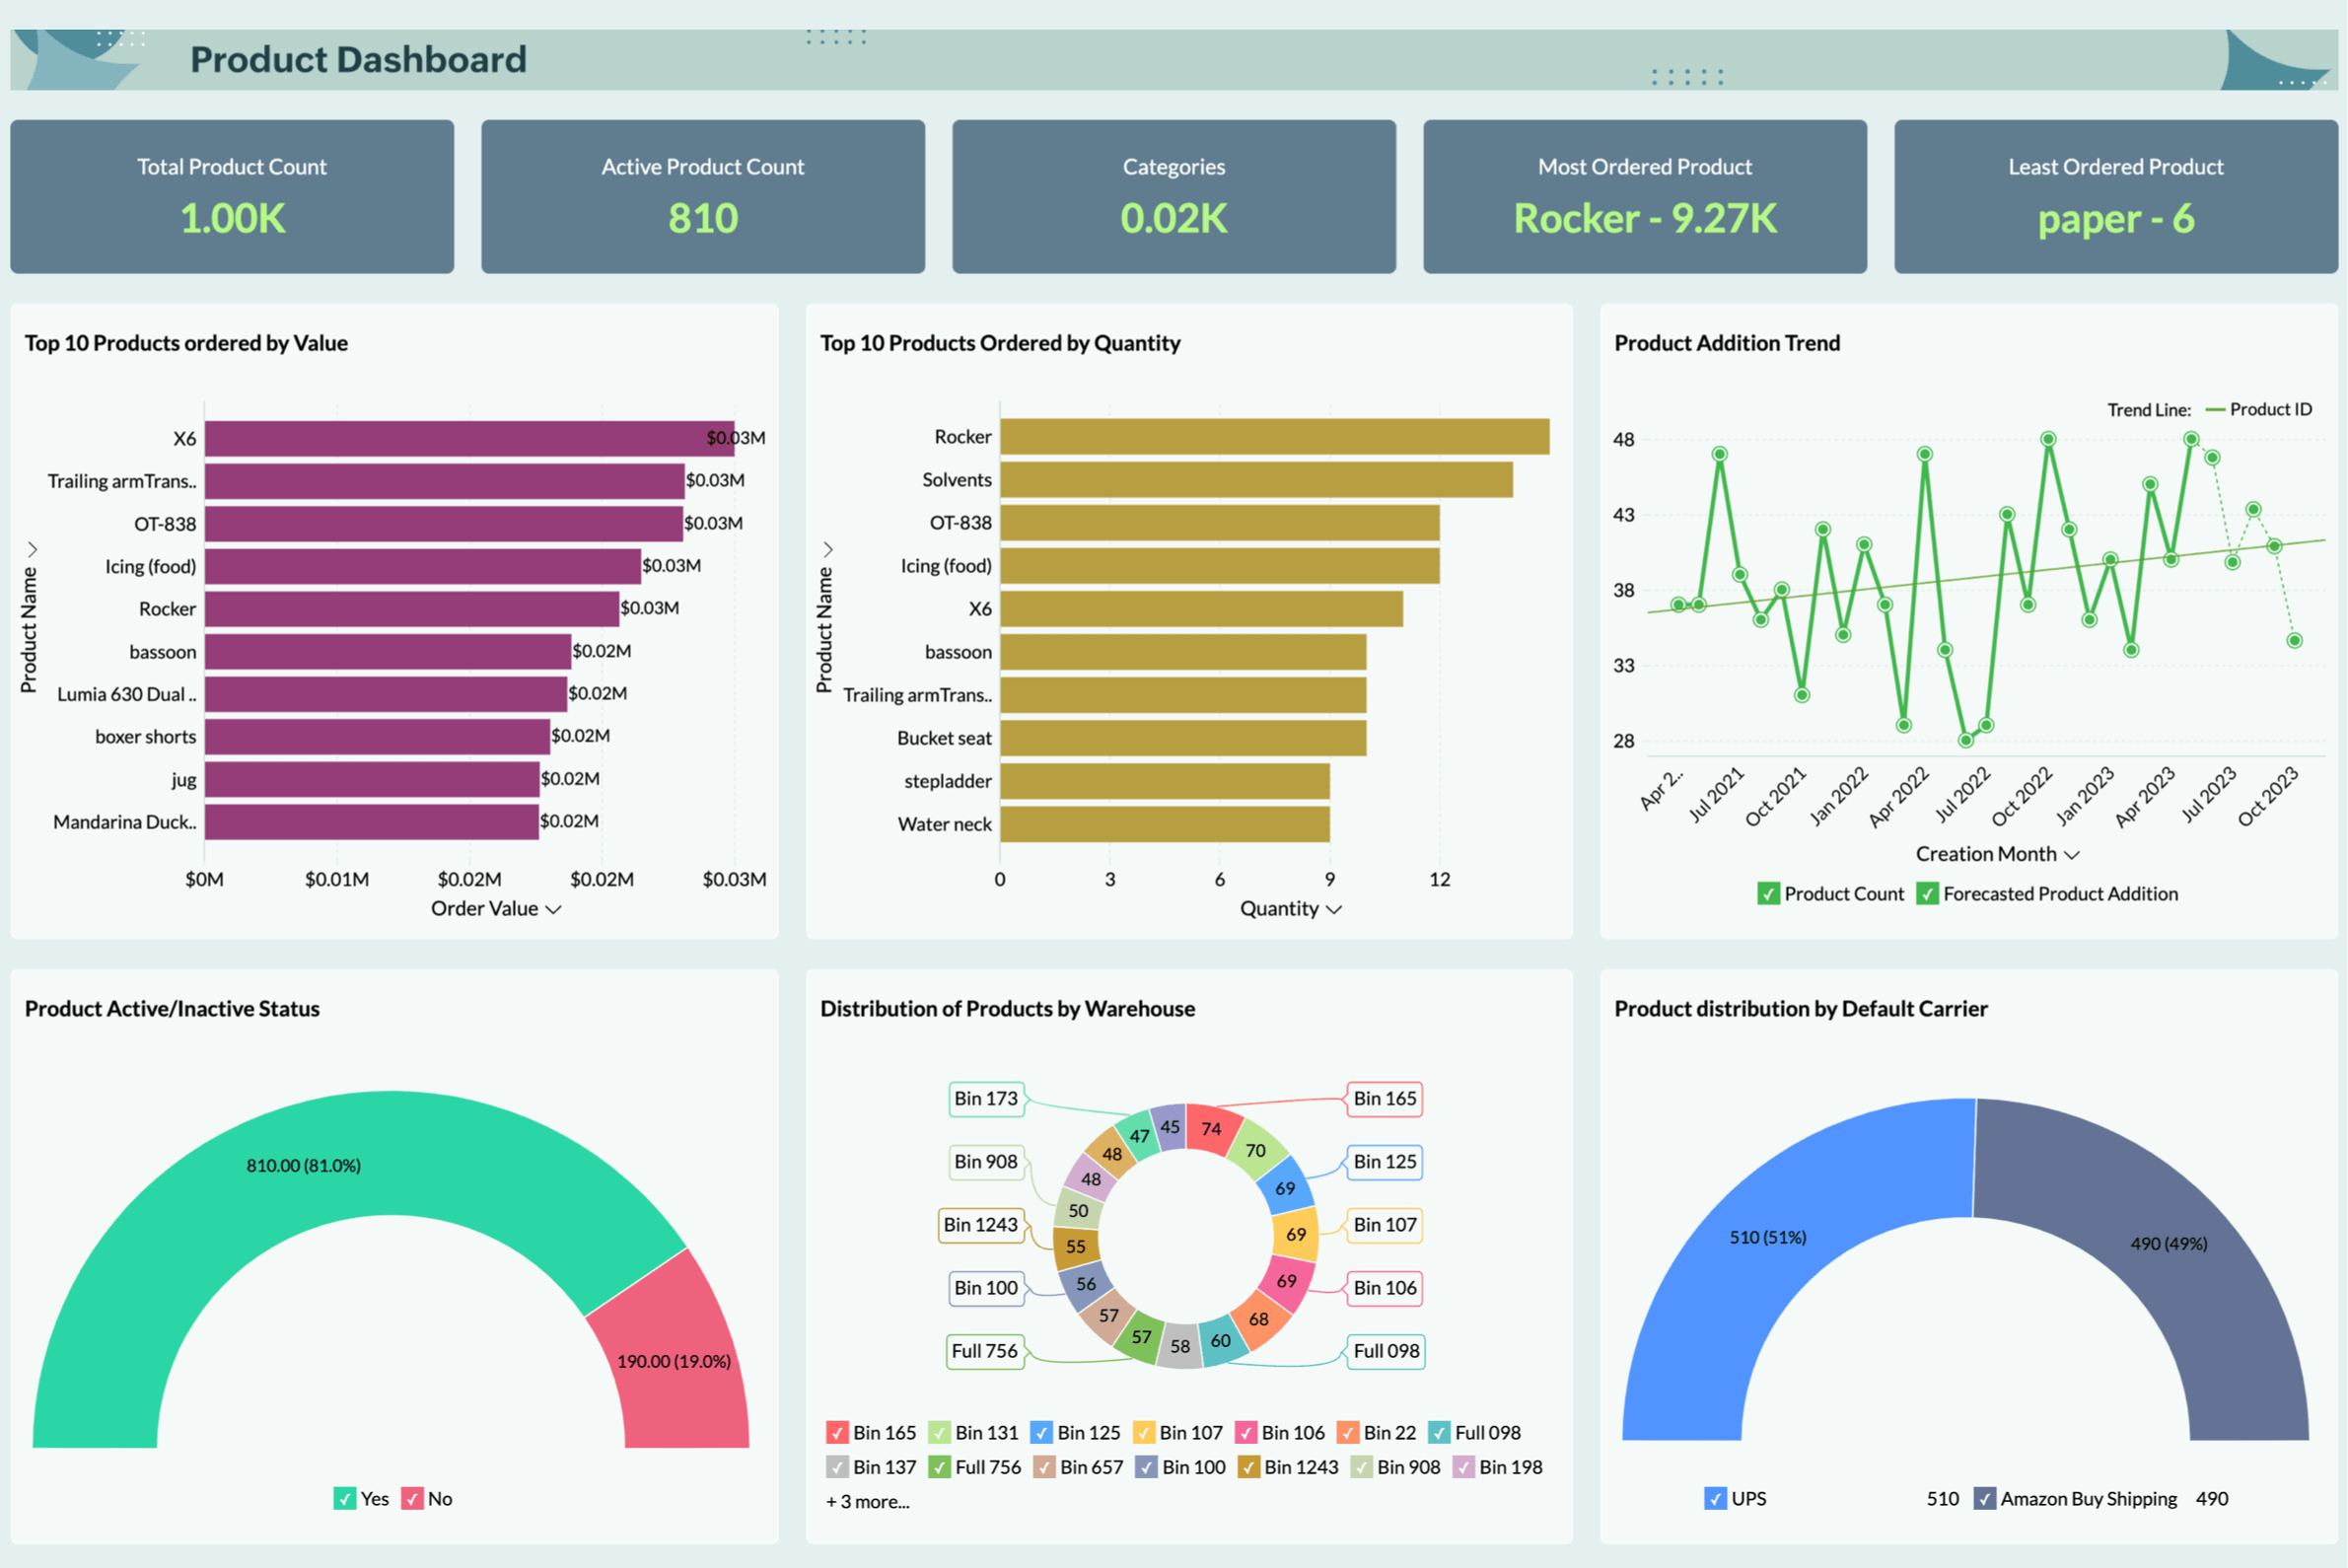
Product Summary
Track the most and least ordered products by value and quantity. Understand product distribution by various criteria such as carrier, warehouse, volume, weight, category and unit price.

See the sample dashboards for ShipStation as a reference to get started with leveraging data analytics for your own e-commerce business
Analyze ShipStation data, extract key insights, and improve your order management
2 million+ users. 5 million+ visualizations.
Access pre-built reports & dashboards
Kick-start your analytics journey instantly with over 50 pre-built reports and dashboards on your sales performance.
Analyze business performance
Review and analyze your overall business performance and get to know the top sales reps of your organization.
Forecast orders
Make informed decisions from your order management data and in turn manage your cash flow, workforce, and resources. Predict order demand to plan for future growth.
Collaborate with team
Develop & analyze reports together with your sales team. Share and embed your visualizations for wider consumption.
Ask Zia and get insights
Type out your questions, and see Zia, our AI-powered assistant, come up with suitable answers in the form of reports and KPI widgets.
Email, export, and print reports
Export or print reports for offline access. Schedule your reports and dashboards to be emailed automatically to the given recipients.
Other e-commerce Connectors
VIEW MOREHear it from our customers
"Zoho Analytics is an easy to use business intelligence tool. There are many integration options; The recommended tables are often useful. Creating custom charts and tables, then organizing them into dashboards is where this software shines."

Michael Torres
Marketing Director, Fabrication Enterprises Inc
