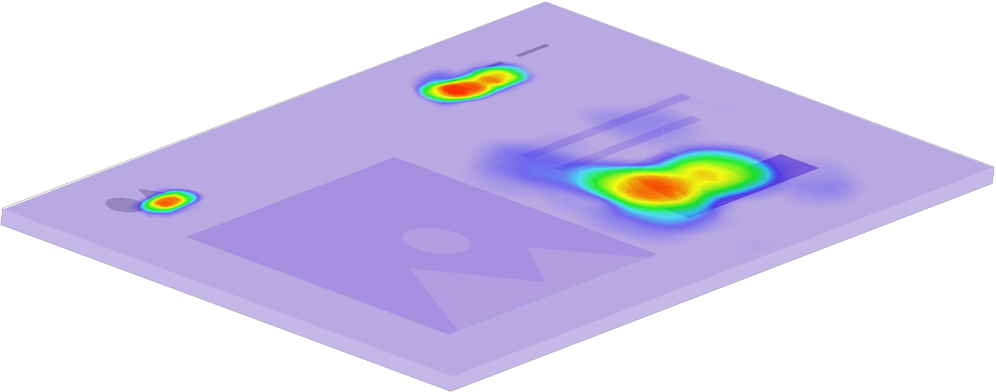
Understand visitor behavior through Heatmaps
Find which section drives the most traffic, the web elements that distract, and the content that resonates well with your audience. Get a real-time visual report of your visitor clicks, scrolls, and engagement.
START MY FREE TRIALKey Features
- View attention maps and scroll maps
- Track dynamic web elements
- Variation specific Heatmaps for AB testing and Personalization
- Detailed reports and powerful segmentation
Why do you need Heatmaps?
Get a visual map of how visitors interact with your website
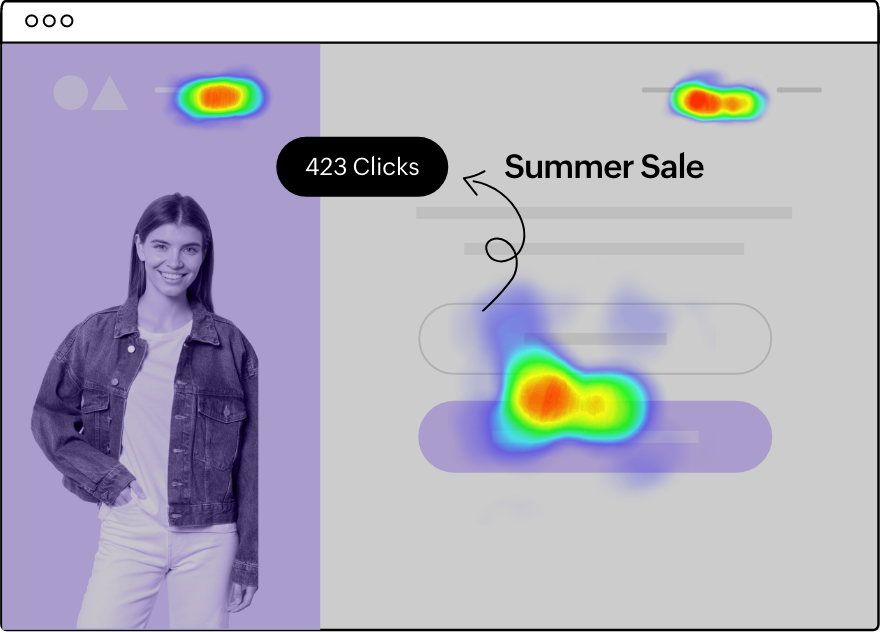
Verify if visitors interact with non-clickable web elements, assess the click rates on CTAs and ensure a smooth website experience.
Reposition CTAs and other key content
Track visitor scrolling to discover popular areas for improved content visibility, placement and better conversion rates. Determine ideal website length by studying both highly visited and abandoned sections.
Discover high-impact zones for visitor engagement
Identify visitor hotspots and coldspots, then adjust and revise content for an improved user experience.
What can you do with PageSense’s Heatmaps?
Discover deeper insights with visual reports
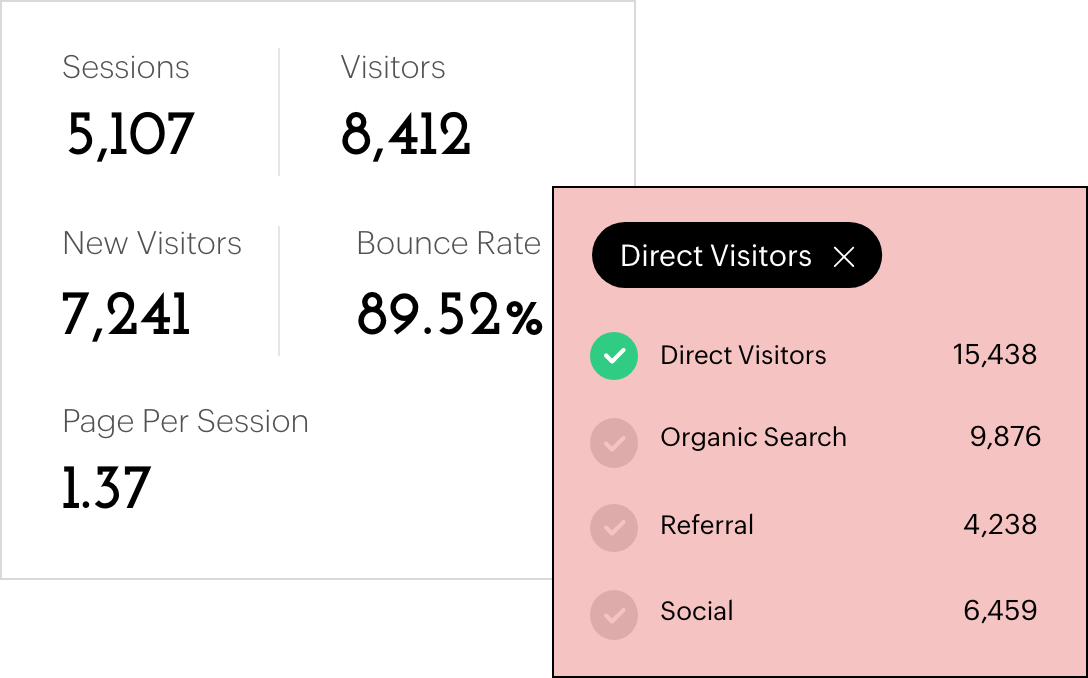
Drill down to view the behavior of specific segments of your website visitors. Study interactions with static and dynamic elements like popup menus, slider carousels, and drop-downs.

Offer a seamless experience across all devices
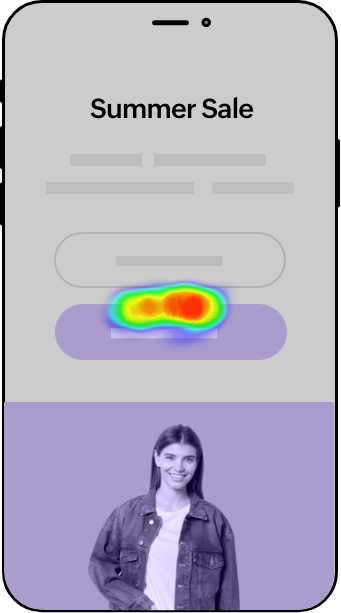
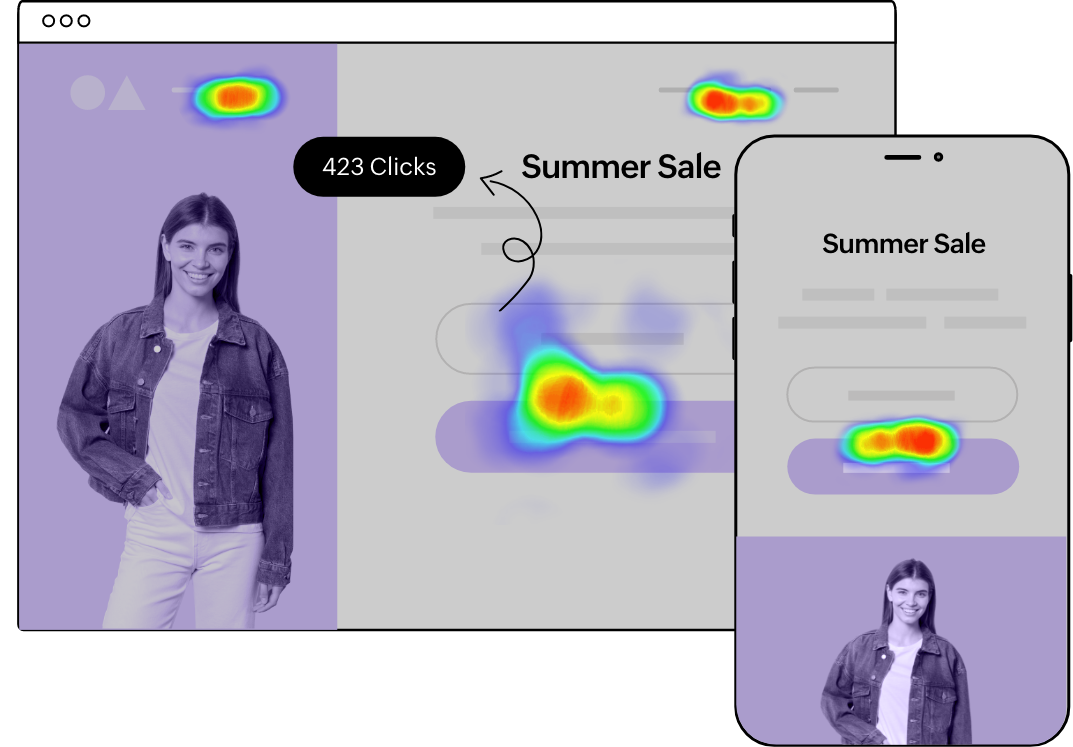
Record visitor interactions for desktop, mobile, and tablet to know how far visitors read on various devices. Ensure your website offers cross-device compatibility to facilitate a smooth navigation experience for your visitors.
Quickly launch experiments with our Chrome Extension
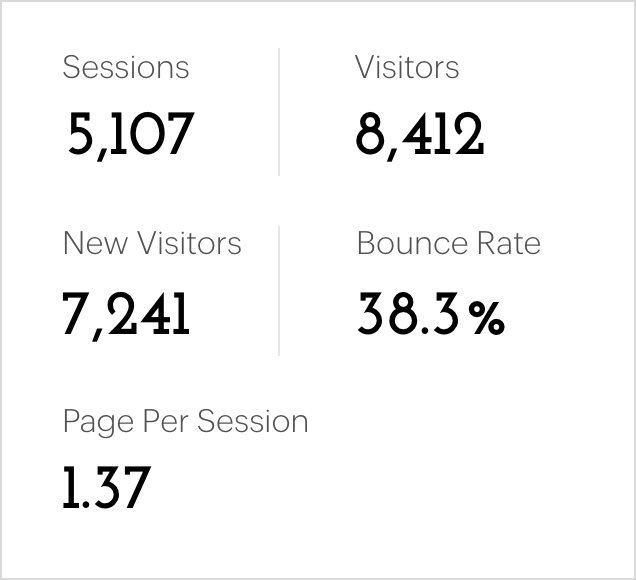
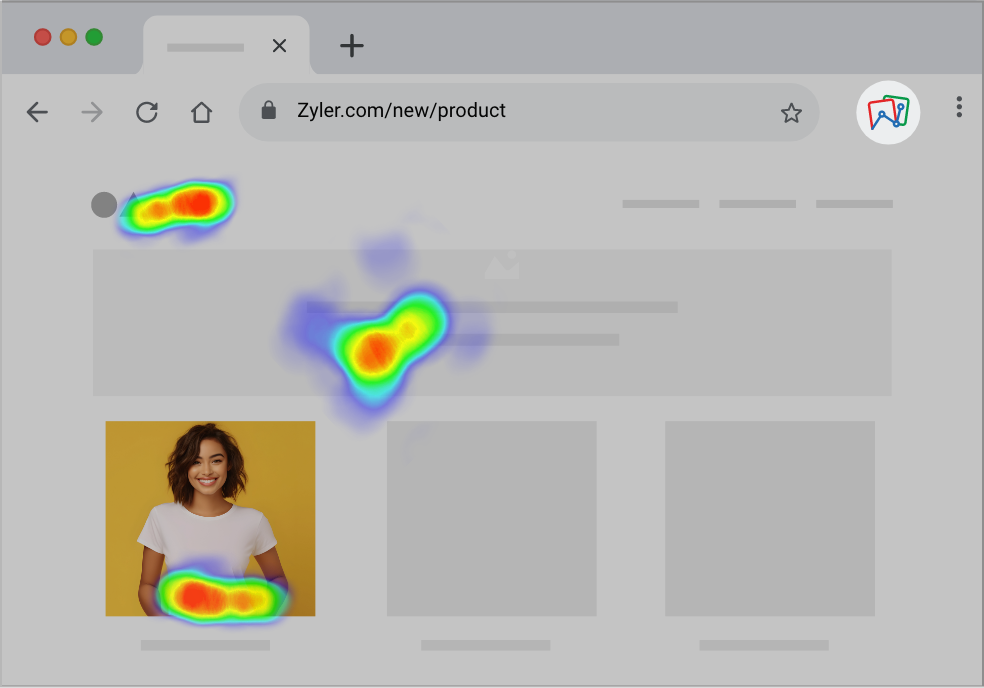
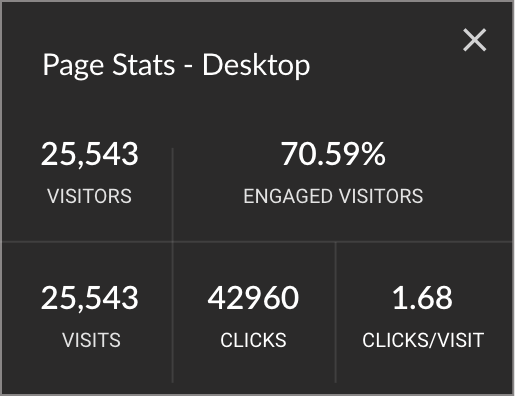
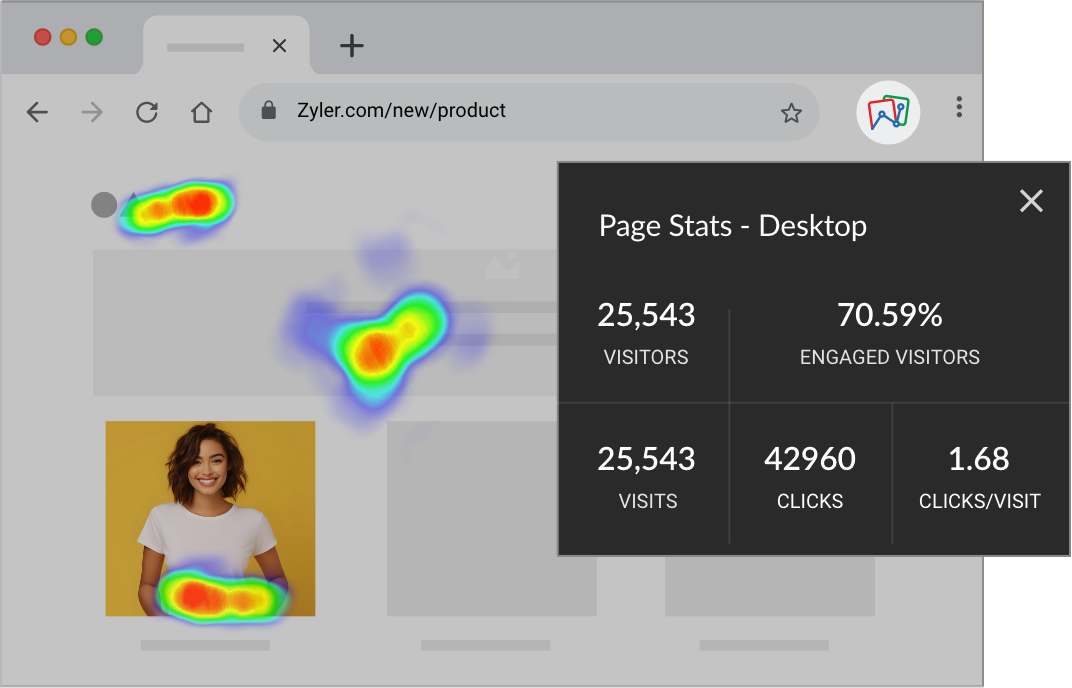
Effortlessly launch Heatmap tests and monitor visitor interactions on your site using the Chrome plugin. Additionally, you can instantly view Heatmap, Scrollmap, and Attention map results. Plus, access key stats such as visitor counts, clicks, and conversions directly in your browser.

Enable consolidated heatmaps to save time
Unlike regular heatmaps that track elements on a single page, consolidated heatmaps give you a collective report for elements such as a consistent header, footer, or a quick link sidebar that are consistent across multiple pages.


